Copyright
©The Author(s) 2023.
World J Clin Cases. Aug 26, 2023; 11(24): 5823-5829
Published online Aug 26, 2023. doi: 10.12998/wjcc.v11.i24.5823
Published online Aug 26, 2023. doi: 10.12998/wjcc.v11.i24.5823
Figure 1 Computed tomography imaging of the liver, pancreas, and other abdominal organs.
A: Multiple lesions in the liver; B: Tumor at the pancreatic tail with unclear boundaries.
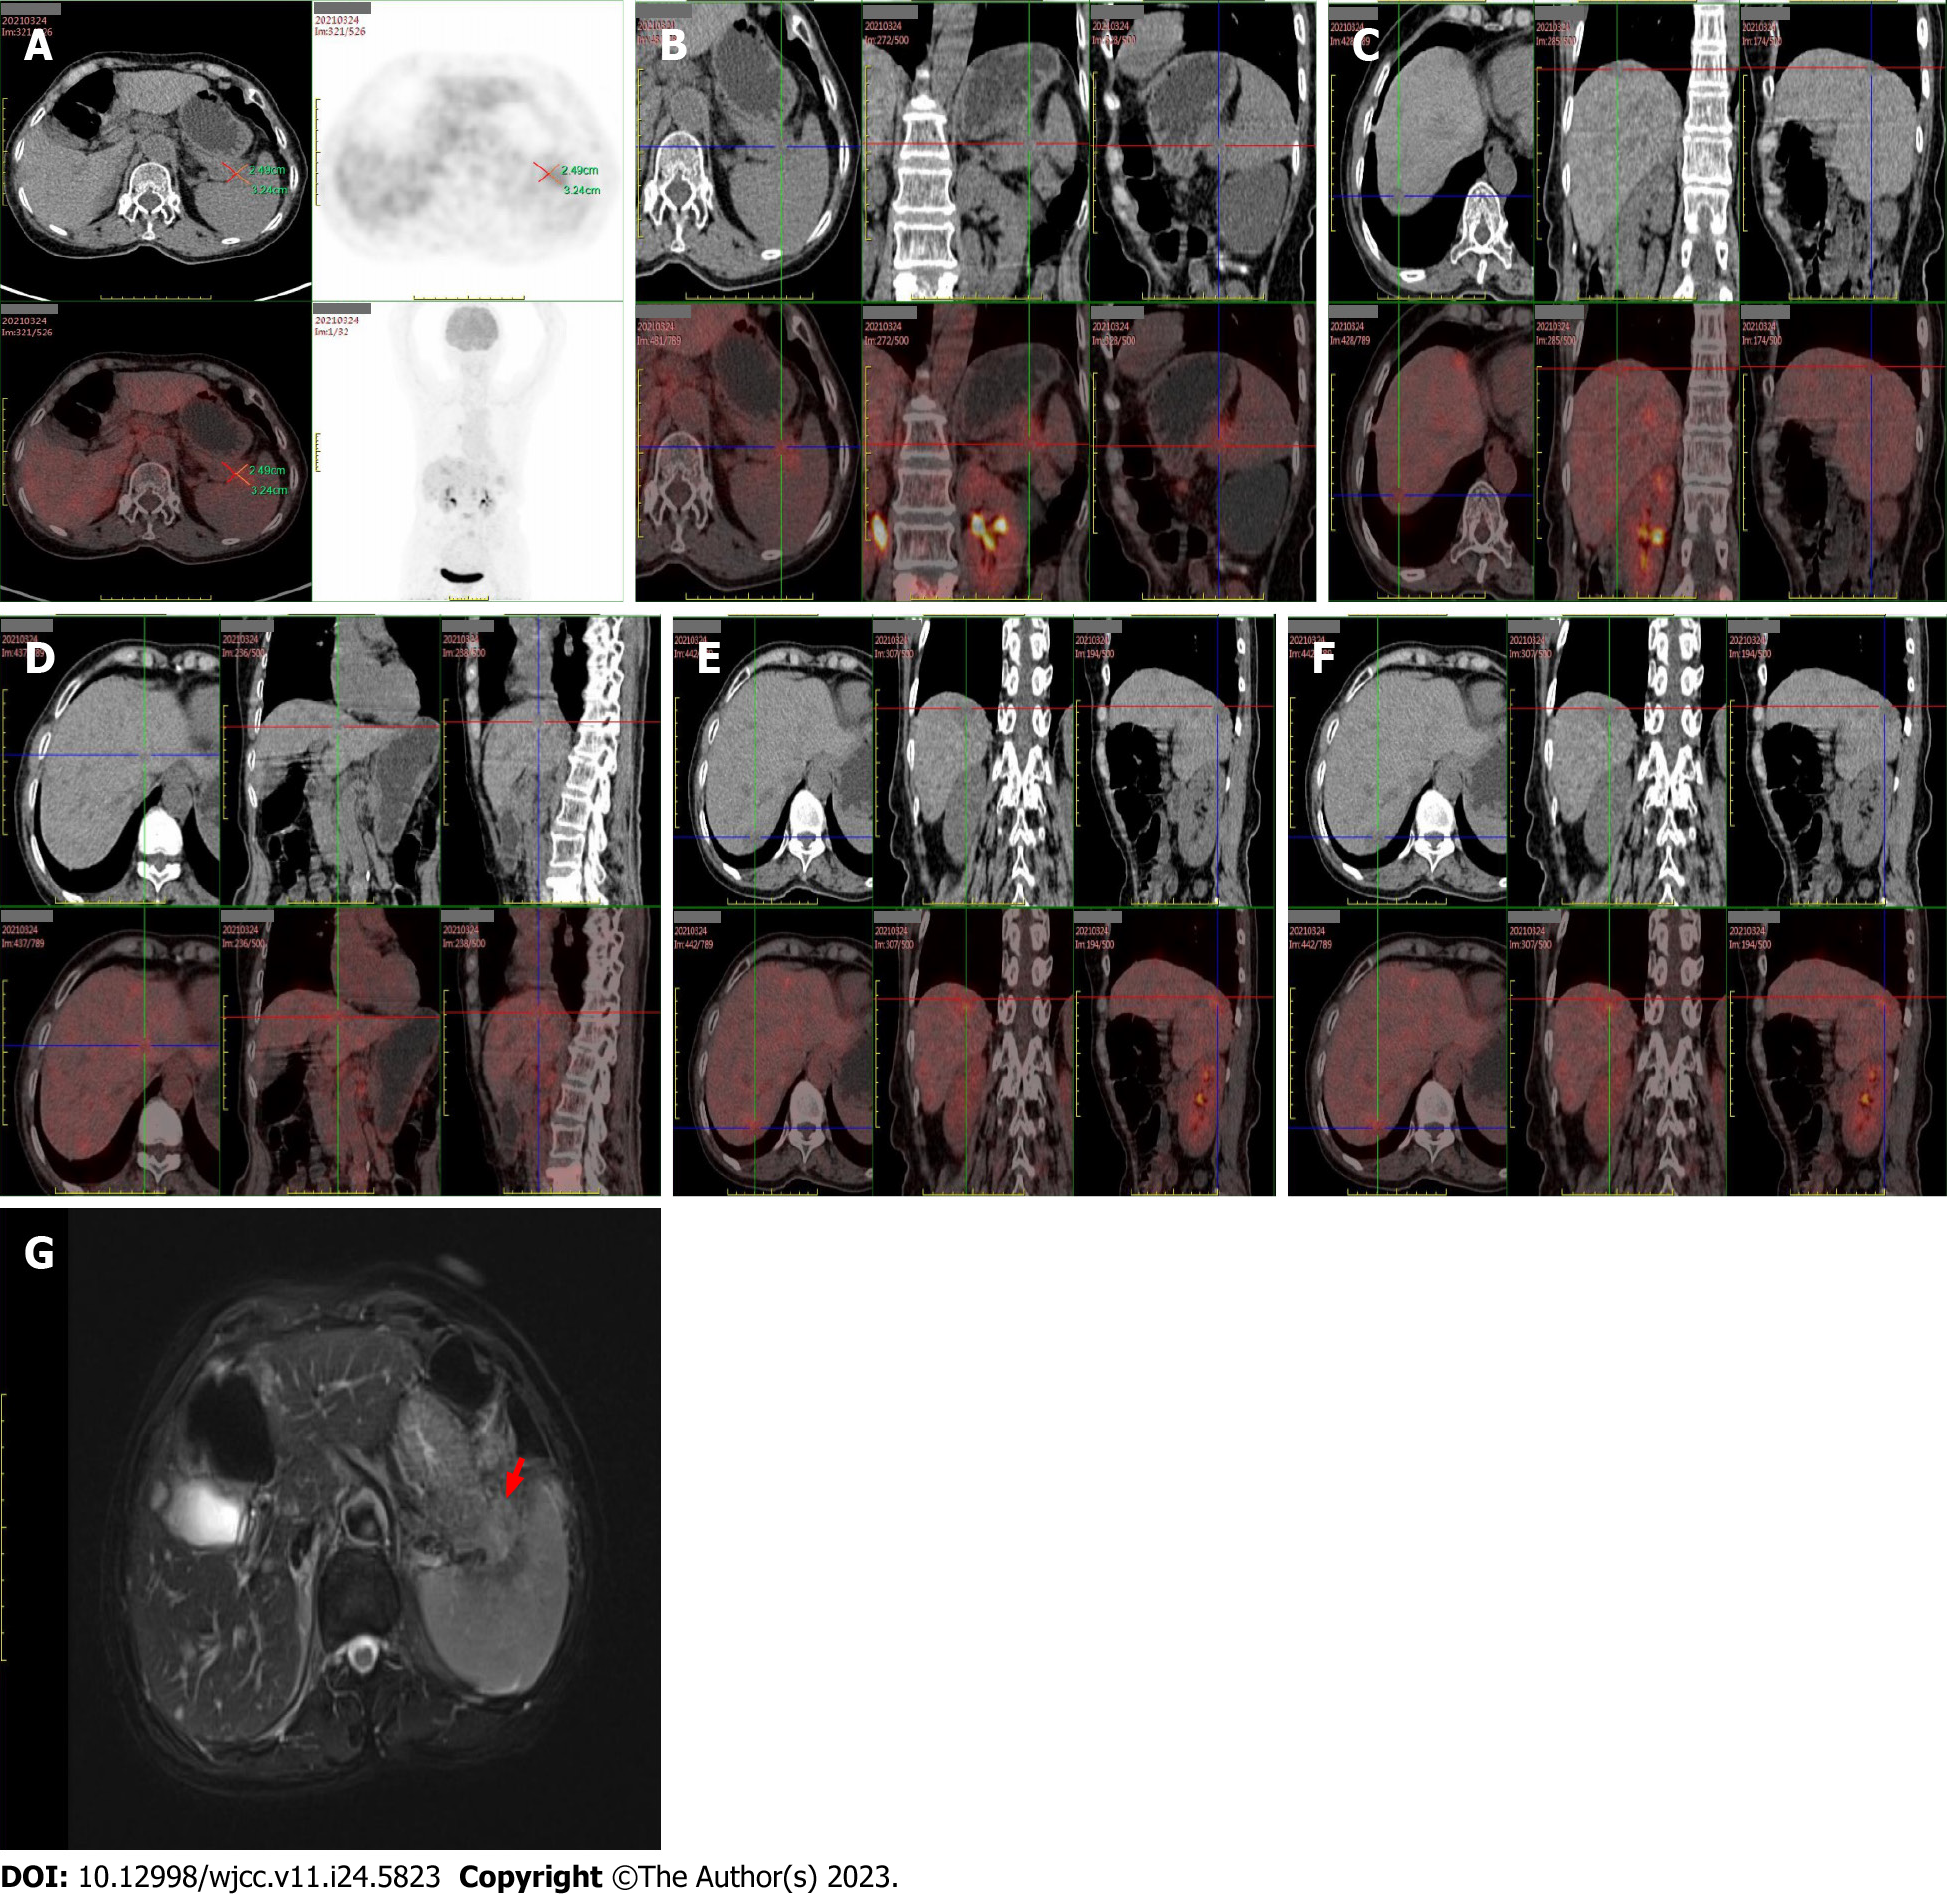
Figure 2 Positron emission tomography–computed tomography images.
A and B: Tumor at the pancreatic tail. Around the pancreatic tumor was fibrous and fat tissue with increased density and an unclear boundary shared with the gastric fundus. The tumor was invading the local hilum of the spleen; C-F: Multiple liver lesions with increased fluorodeoxyglucose metabolism; G: High-density T2-weighted magnetic resonance image.
Figure 3 Biopsy images of acinar cell carcinoma.
Microscopically, several clusters of nests, alveolar and papillary arrangement, fine nuclear chromatin, fine nucleoli, scattered cells, deviated nuclei, and extracellular particles are visible in the background suggestive of neoplastic lesions. A: Staining was positive for cytokeratin (original magnification 200); B: Staining was positive for epithelial membrane antigen 1 (original magnification 100); C: Staining was positive for hematoxylin and eosin (original magnification 100).
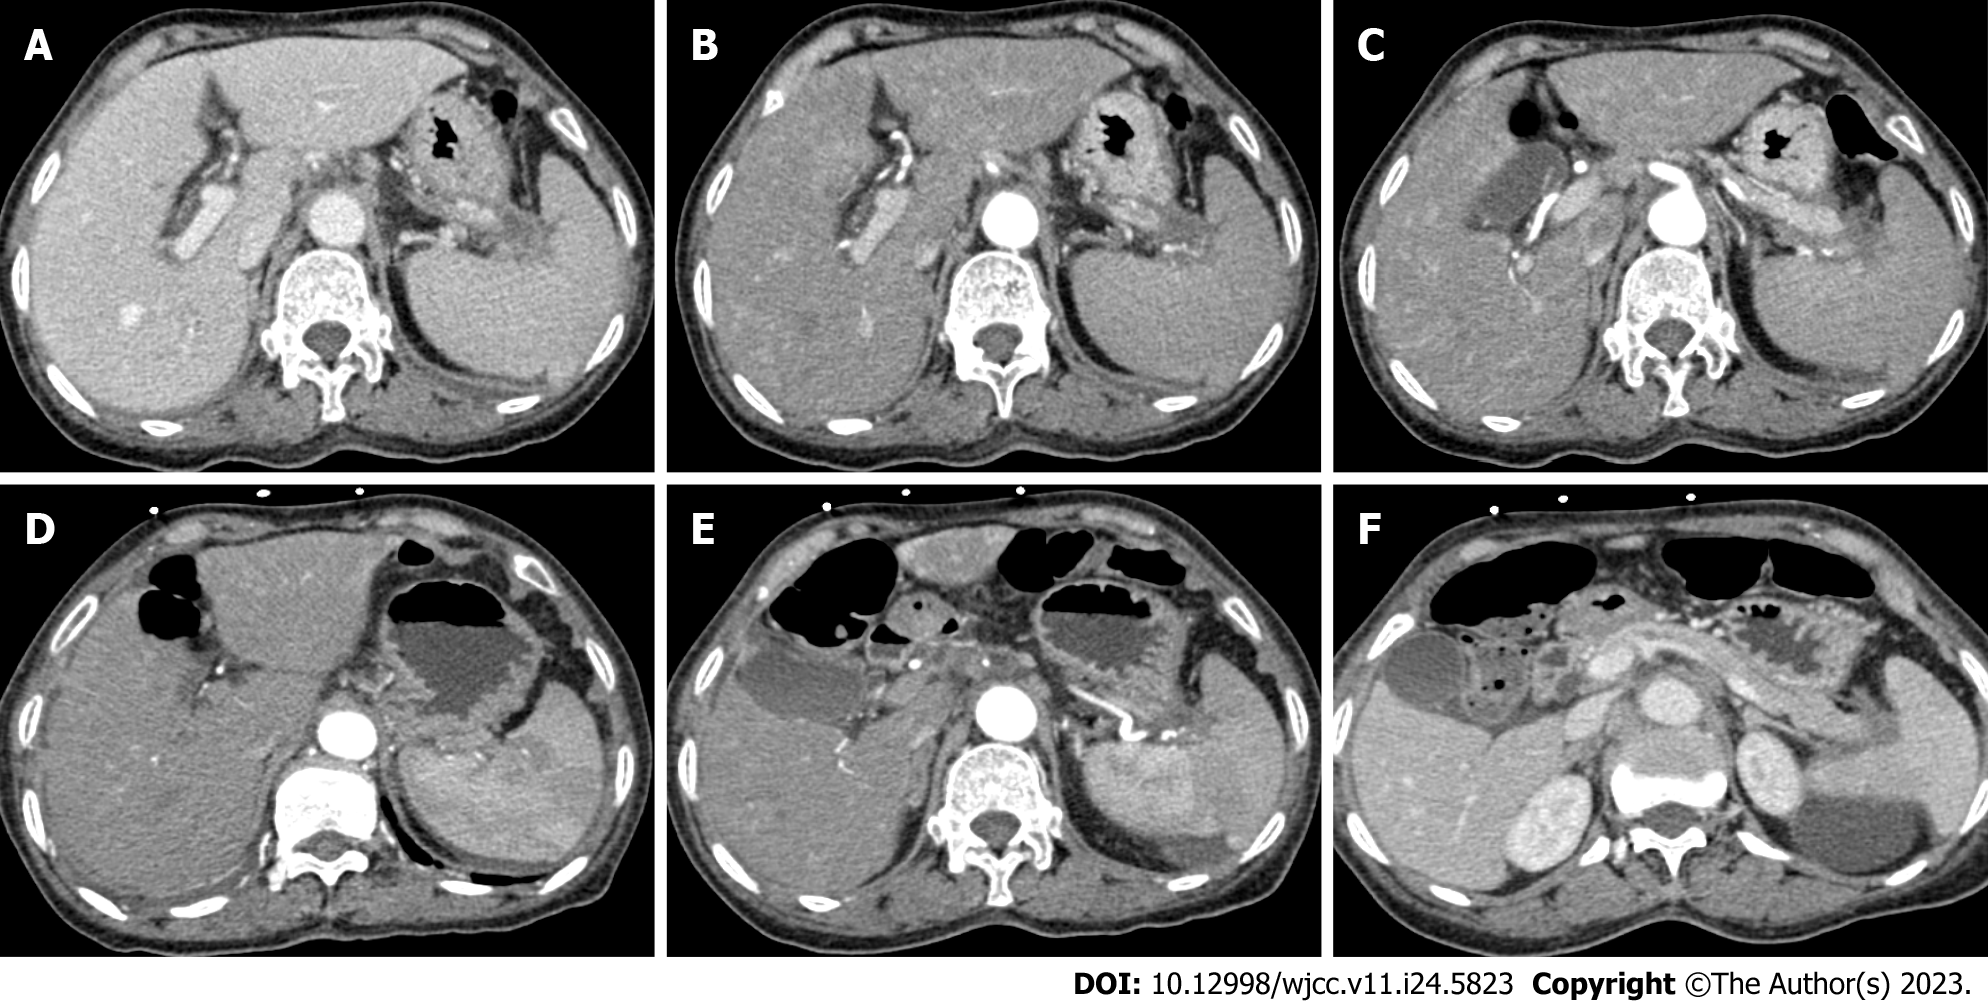
Figure 4 Computed tomography images of the abdomen before vs after treatment.
A-C: Pretreatment enhanced computed tomography images showing lesions in the liver and pancreas in the arterial and portal phases; D-F: Post-treatment images of the liver metastases and pancreatic tumor.
- Citation: Wang T, Shen YY. Rare ROS1-CENPW gene in pancreatic acinar cell carcinoma and the effect of crizotinib plus AG chemotherapy: A case report. World J Clin Cases 2023; 11(24): 5823-5829
- URL: https://www.wjgnet.com/2307-8960/full/v11/i24/5823.htm
- DOI: https://dx.doi.org/10.12998/wjcc.v11.i24.5823


