Copyright
©The Author(s) 2023.
World J Clin Cases. Jul 16, 2023; 11(20): 4883-4889
Published online Jul 16, 2023. doi: 10.12998/wjcc.v11.i20.4883
Published online Jul 16, 2023. doi: 10.12998/wjcc.v11.i20.4883
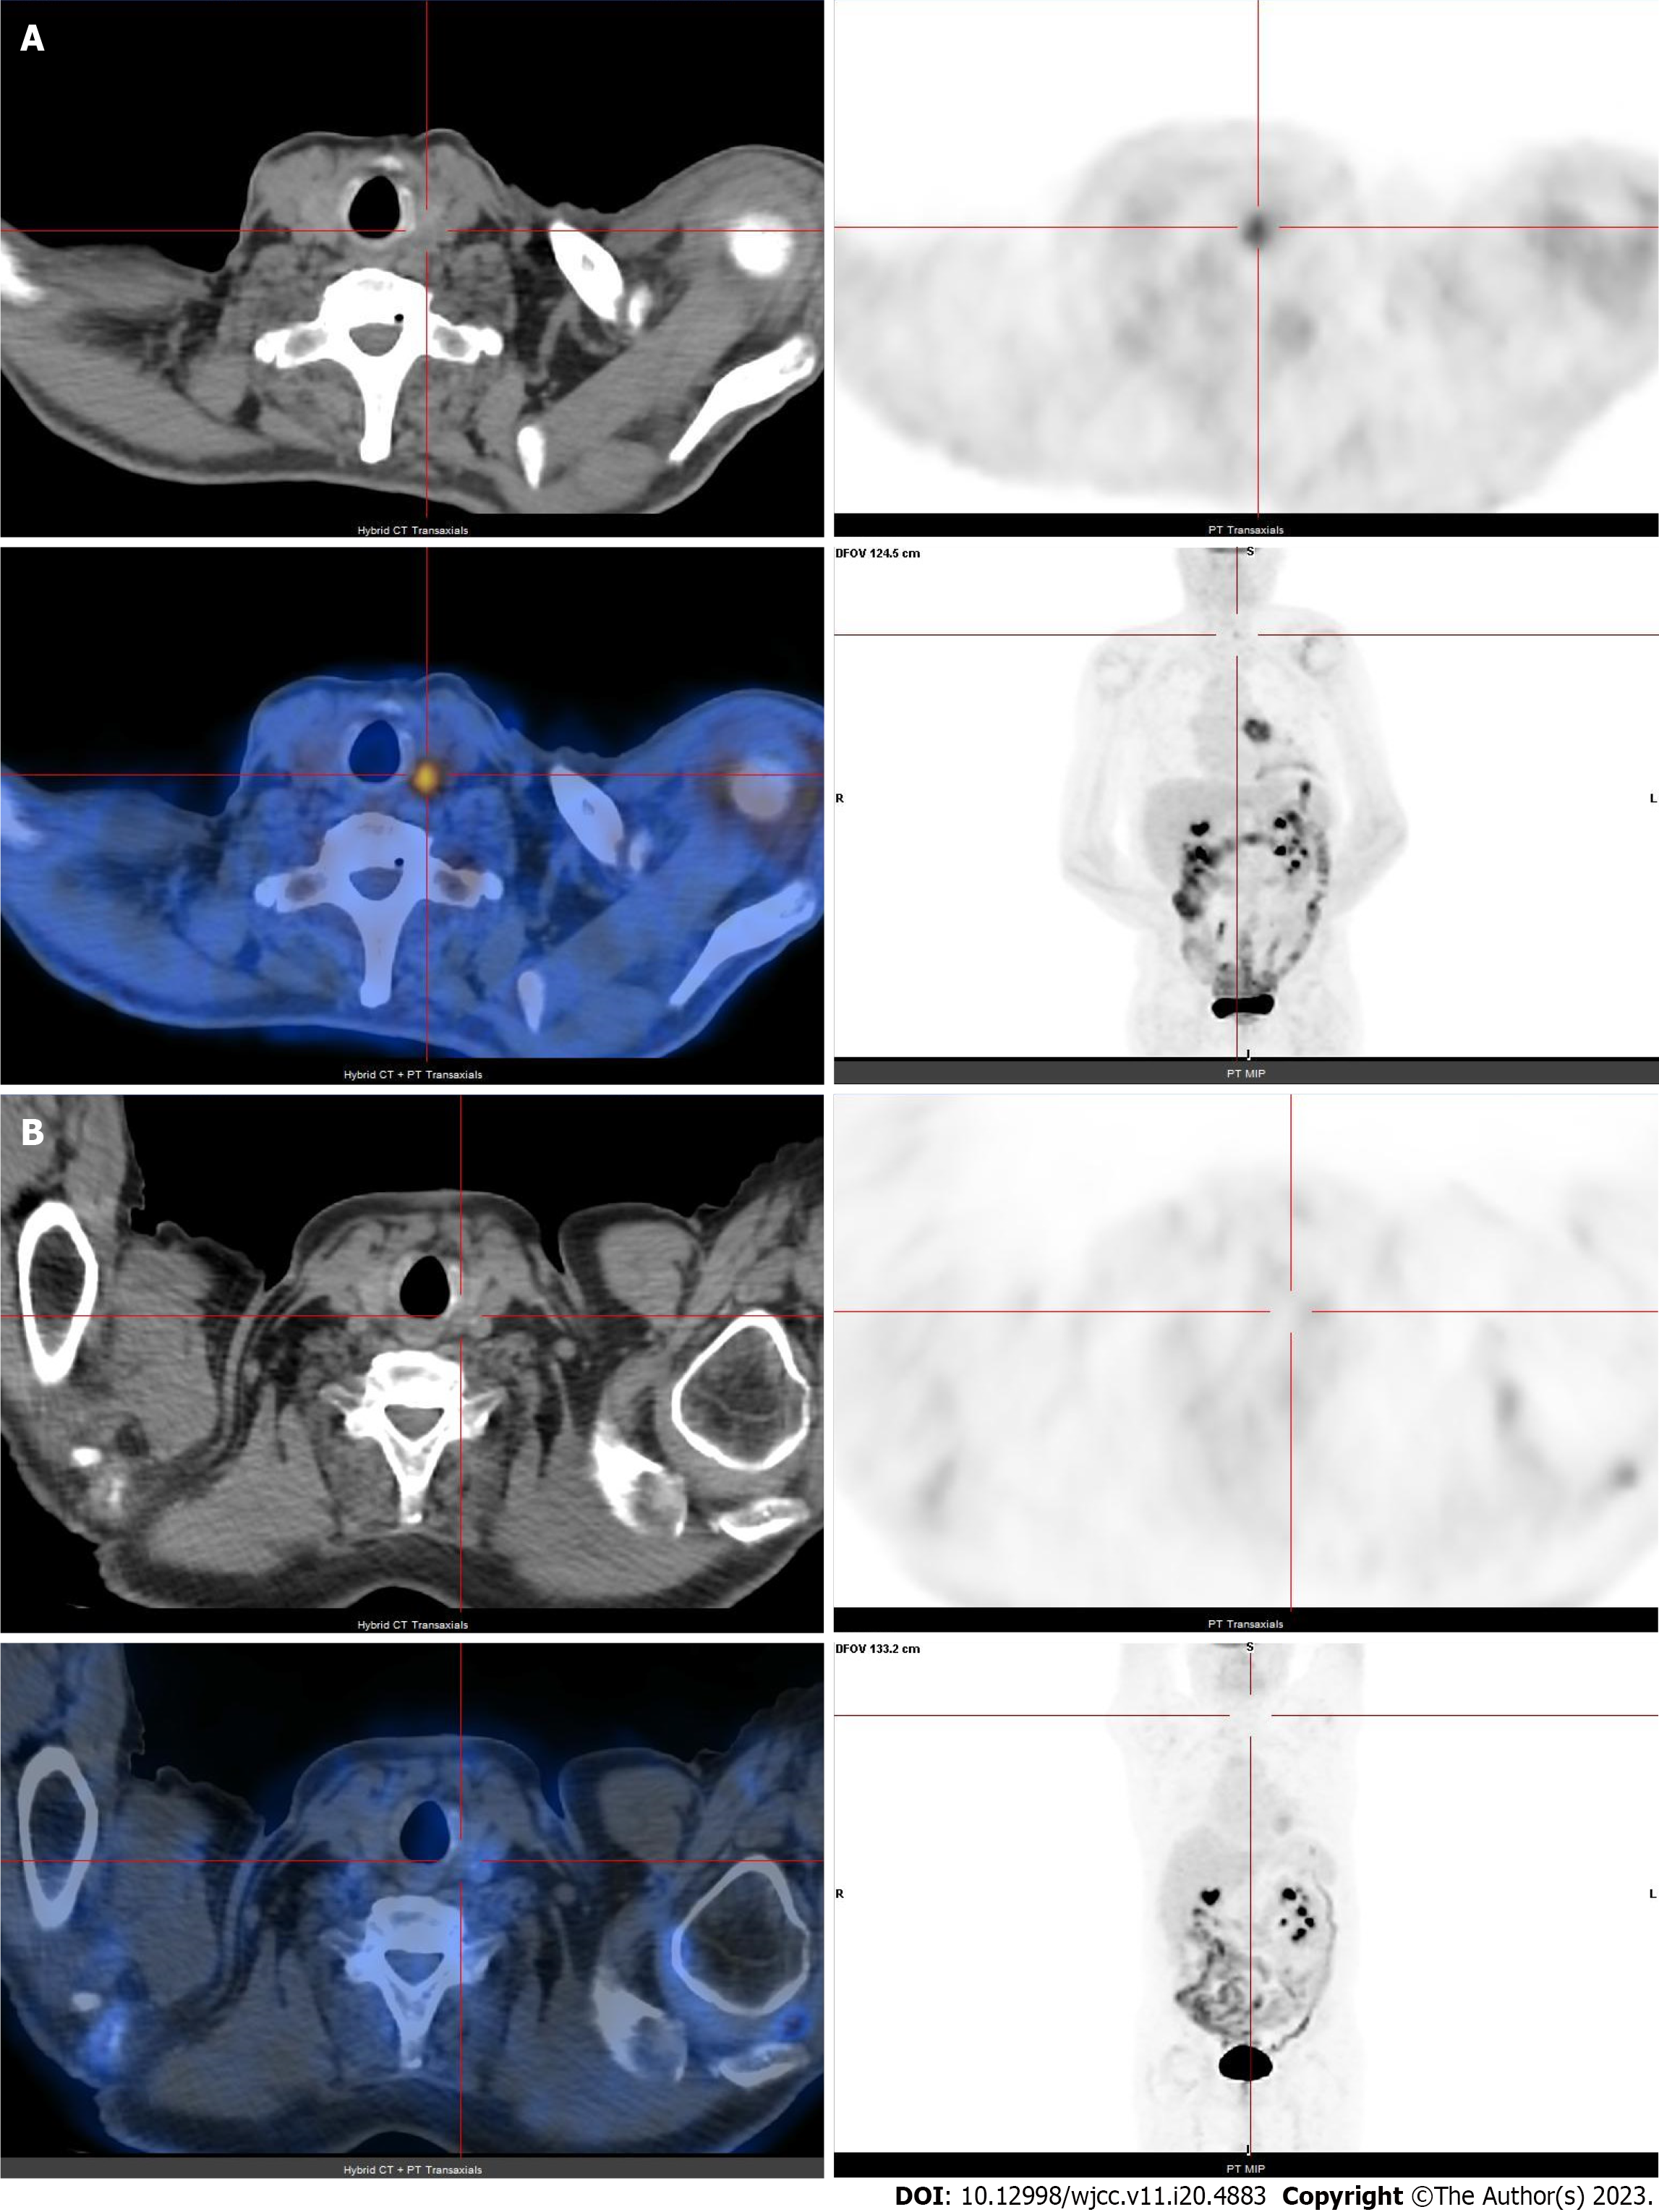
Figure 1 18F-fluorodeoxyglucose positron emission tomography/computed tomography.
A: Before thermal ablation positron emission tomography (PET) shows focal and intense uptake of 18F- fluorodeoxyglucose on left lobe of the thyroid gland (SUVmax. 3,4); B: Six months post thermal ablation PET did not identify hypermetabolic tumor lesions.
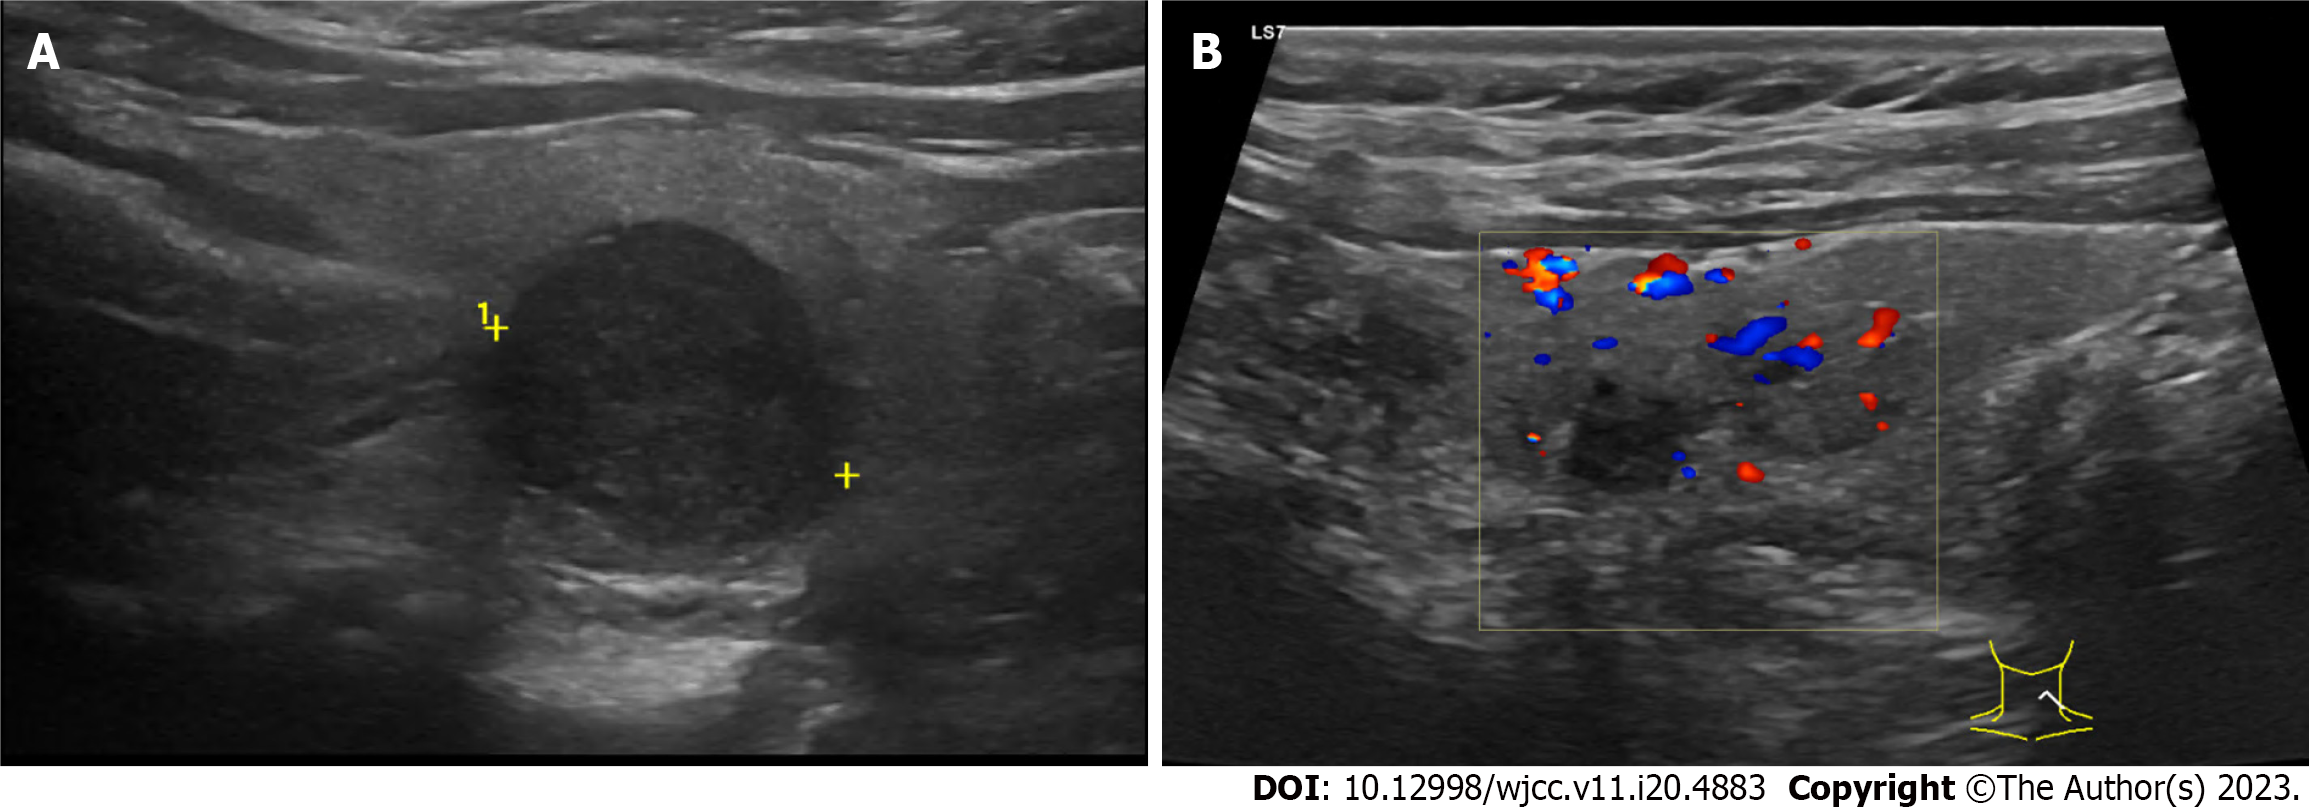
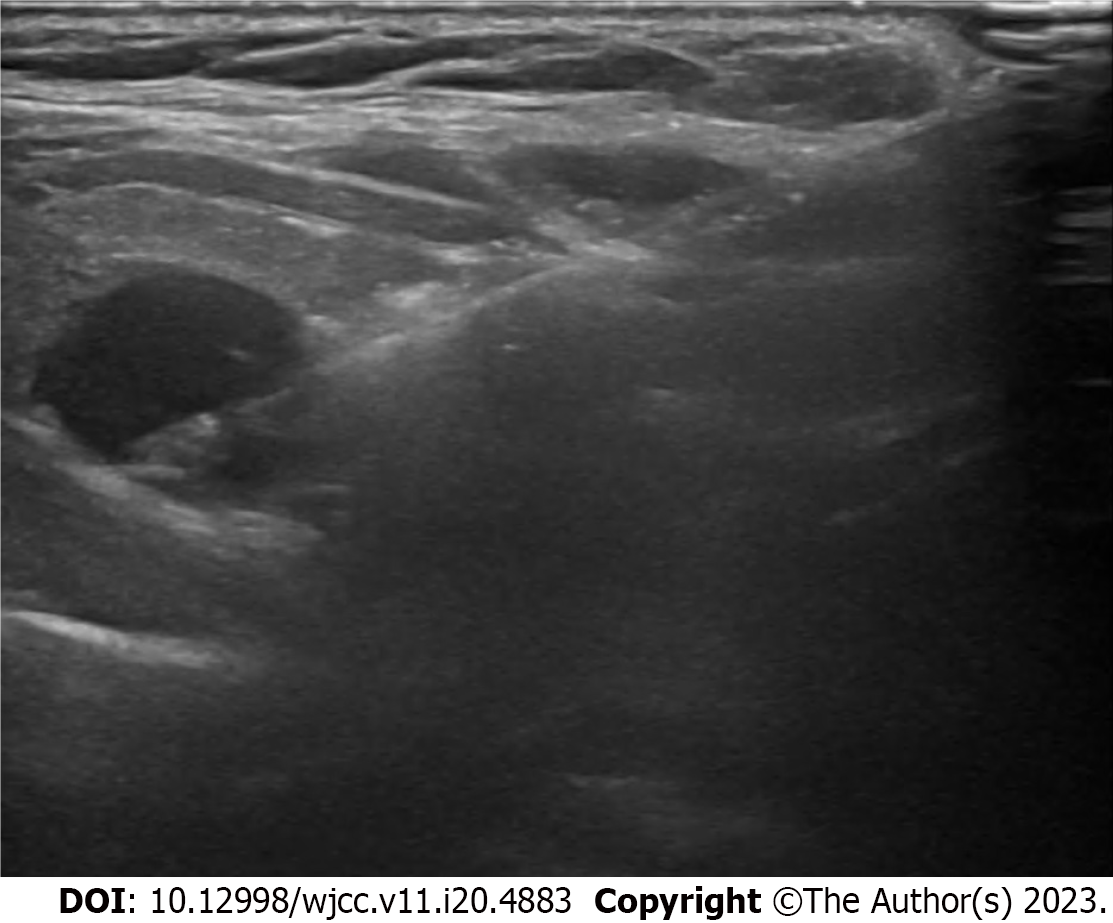
Figure 2 Thyroid ultrasound.
A: Ultrasonography done before thermal ablation revealed a hypoechogenic mass, with a diameter of 1.7 cm, on the left lobe of the thyroid; B: Ultrasound performed 6 months after thermal ablation showed an hypoechogenic avascularized area corresponding to the area submitted to ablation.
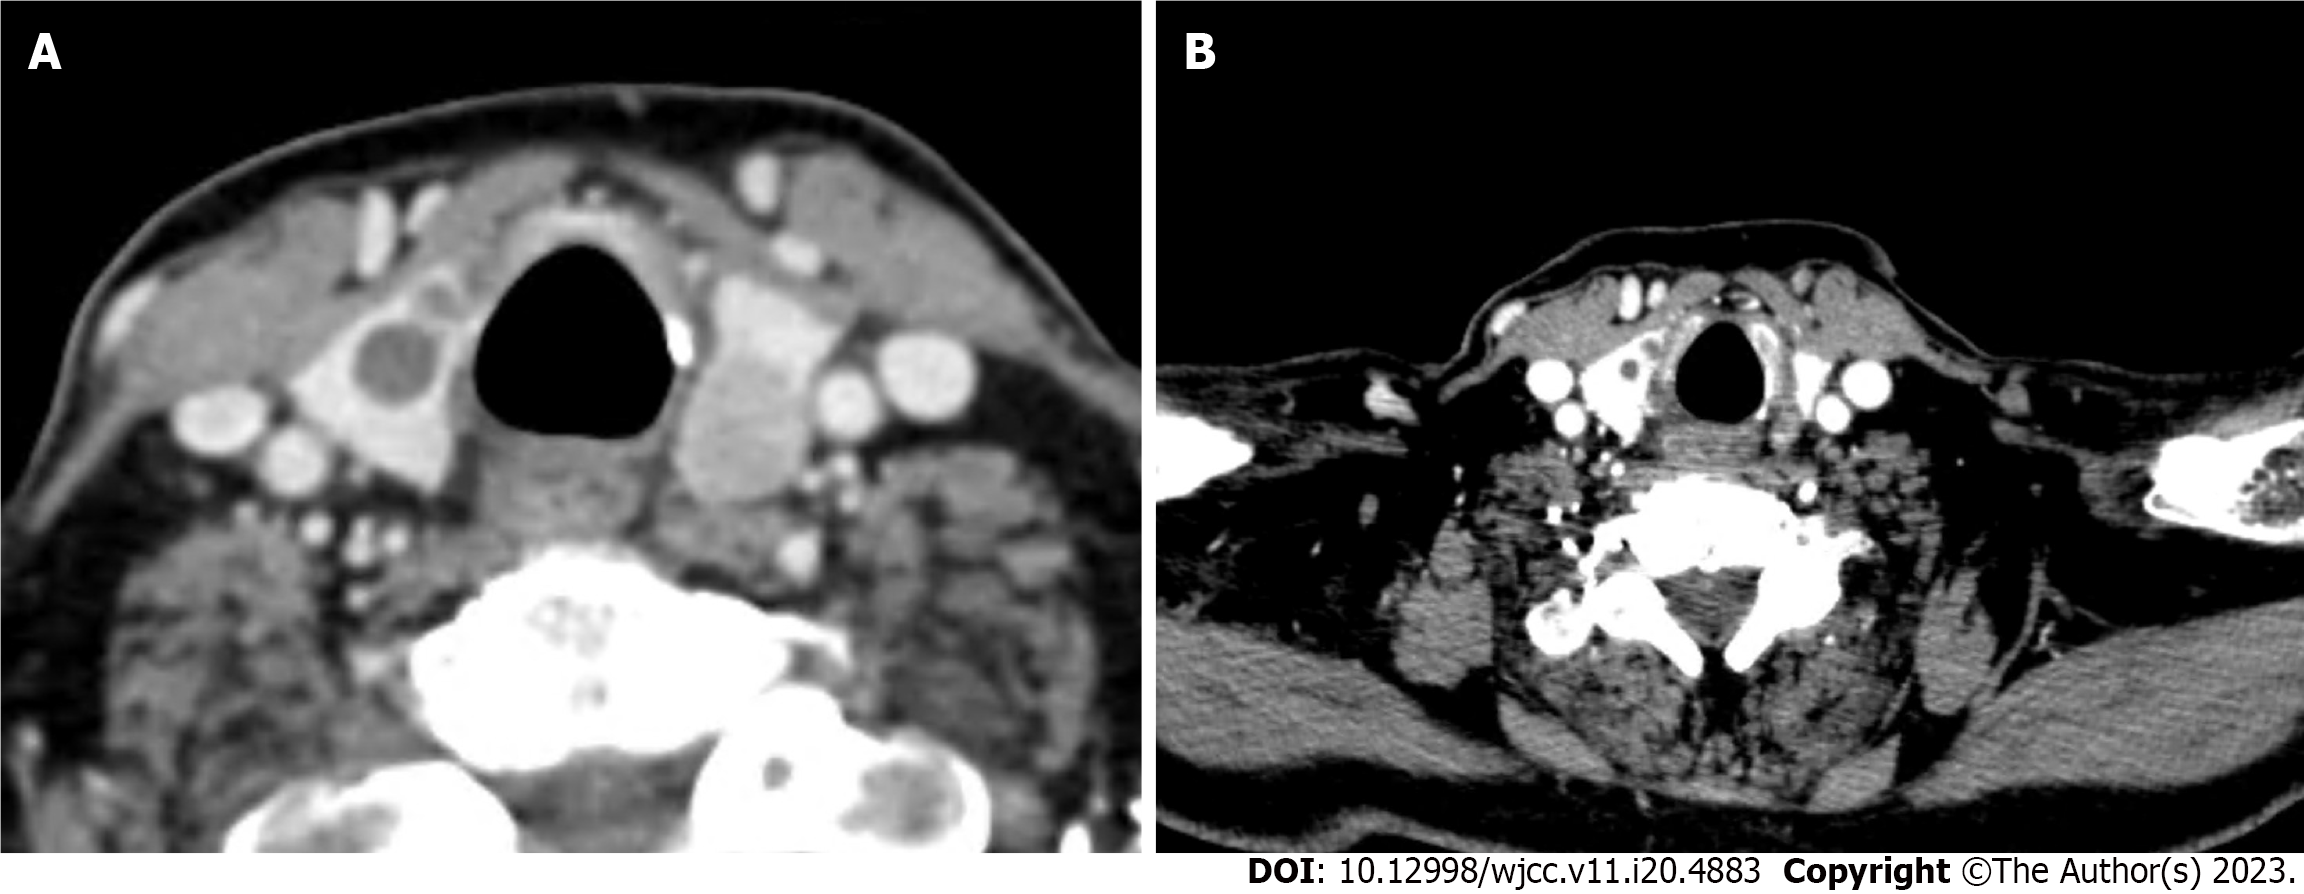
Figure 3 Neck computed tomography.
A: Before thermal ablation shows a left lobe solitary papillary carcinoma and no suspicious cervical lymph nodes were seen; B: Computed tomography scan 4 mo after microwave ablation thermal ablation shows tumor disappearance and absence of locoregional or distant disease progression.
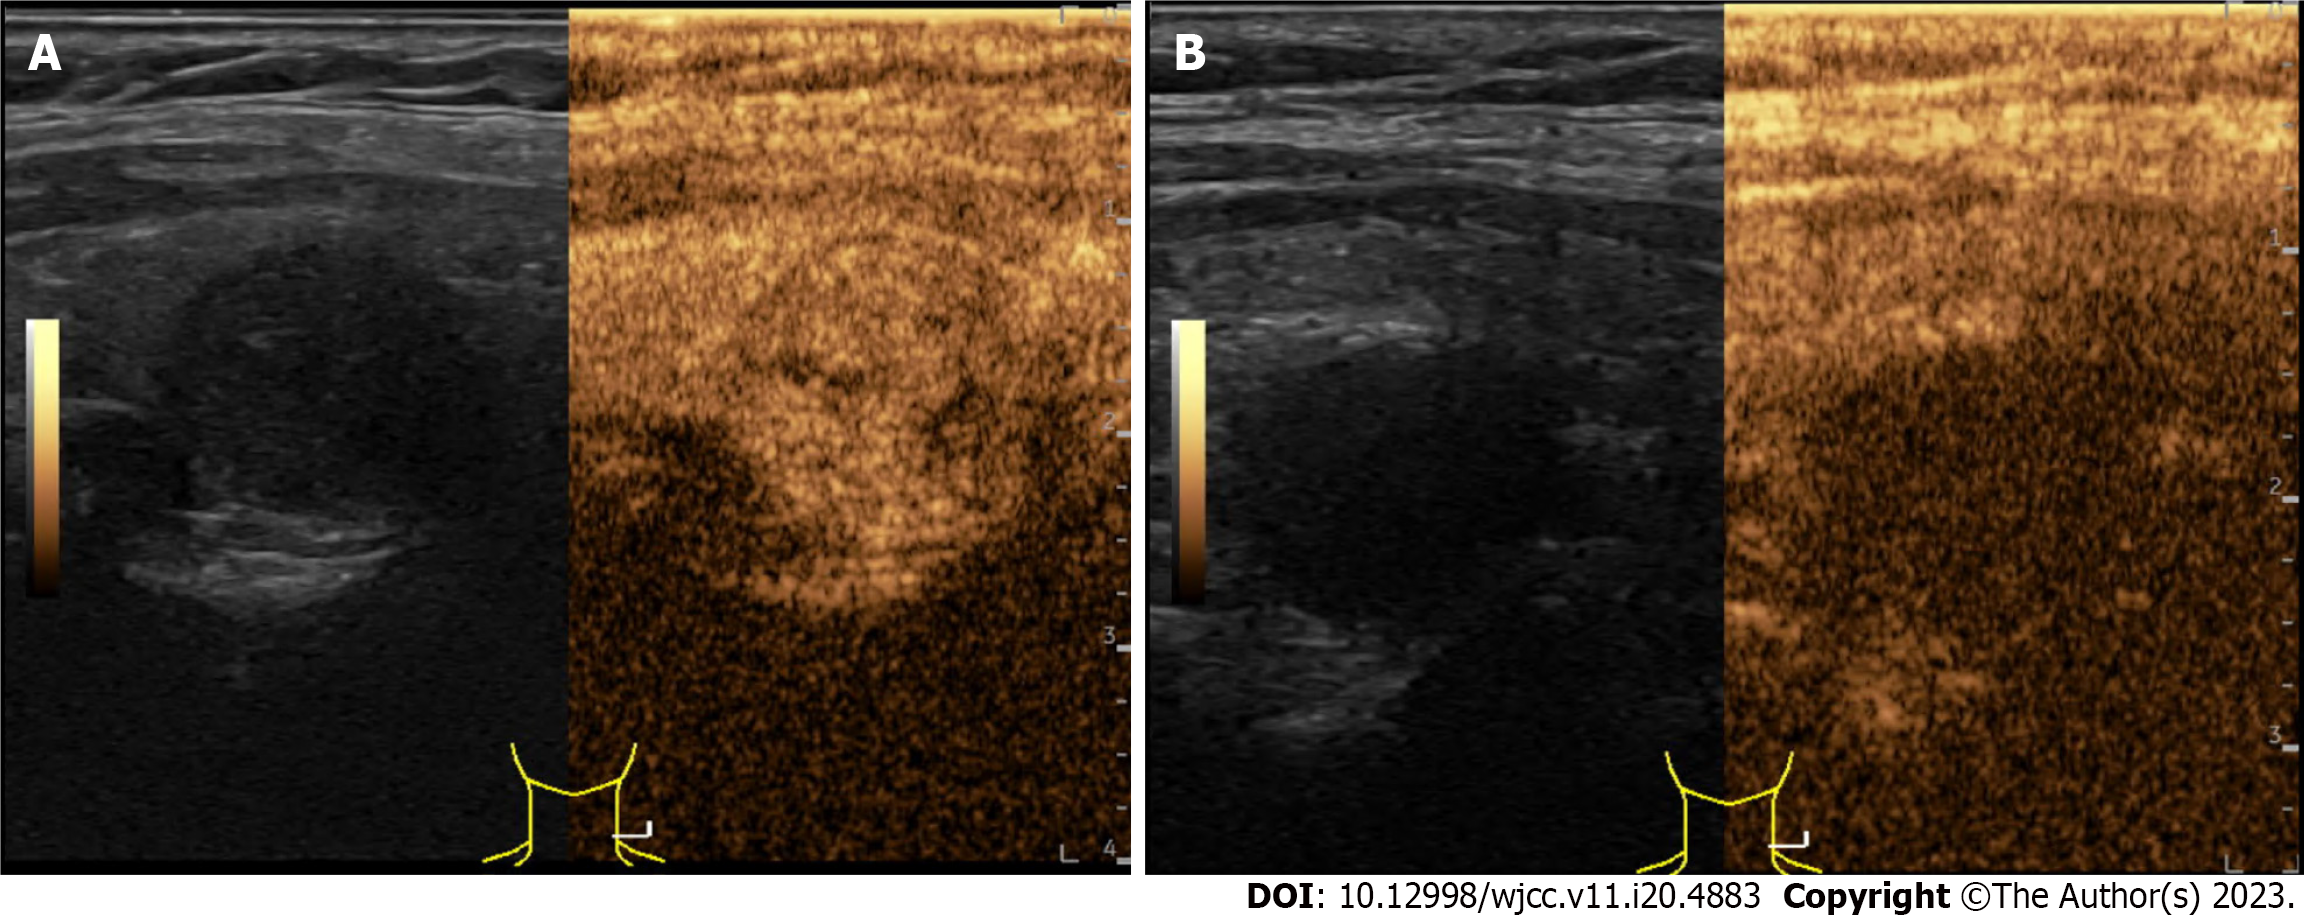
Figure 4 Contrast enhanced ultrasound.
A: Before procedure contrast-enhanced ultrasound (CEUS) shows a solid nodule showing a fast wash-in, slow washout and homogeneous and high enhancement; B: Post-procedure CEUS confirms lack of contrast enhancement inside the ablated nodule.
Figure 5 Ultrasound guided microwave thermal ablation.
- Citation: Dionísio T, Lajut L, Sousa F, Violante L, Sousa P. Microwave ablation of solitary T1N0M0 papillary thyroid carcinoma: A case report. World J Clin Cases 2023; 11(20): 4883-4889
- URL: https://www.wjgnet.com/2307-8960/full/v11/i20/4883.htm
- DOI: https://dx.doi.org/10.12998/wjcc.v11.i20.4883


