Copyright
©The Author(s) 2022.
World J Clin Cases. Dec 6, 2022; 10(34): 12594-12604
Published online Dec 6, 2022. doi: 10.12998/wjcc.v10.i34.12594
Published online Dec 6, 2022. doi: 10.12998/wjcc.v10.i34.12594
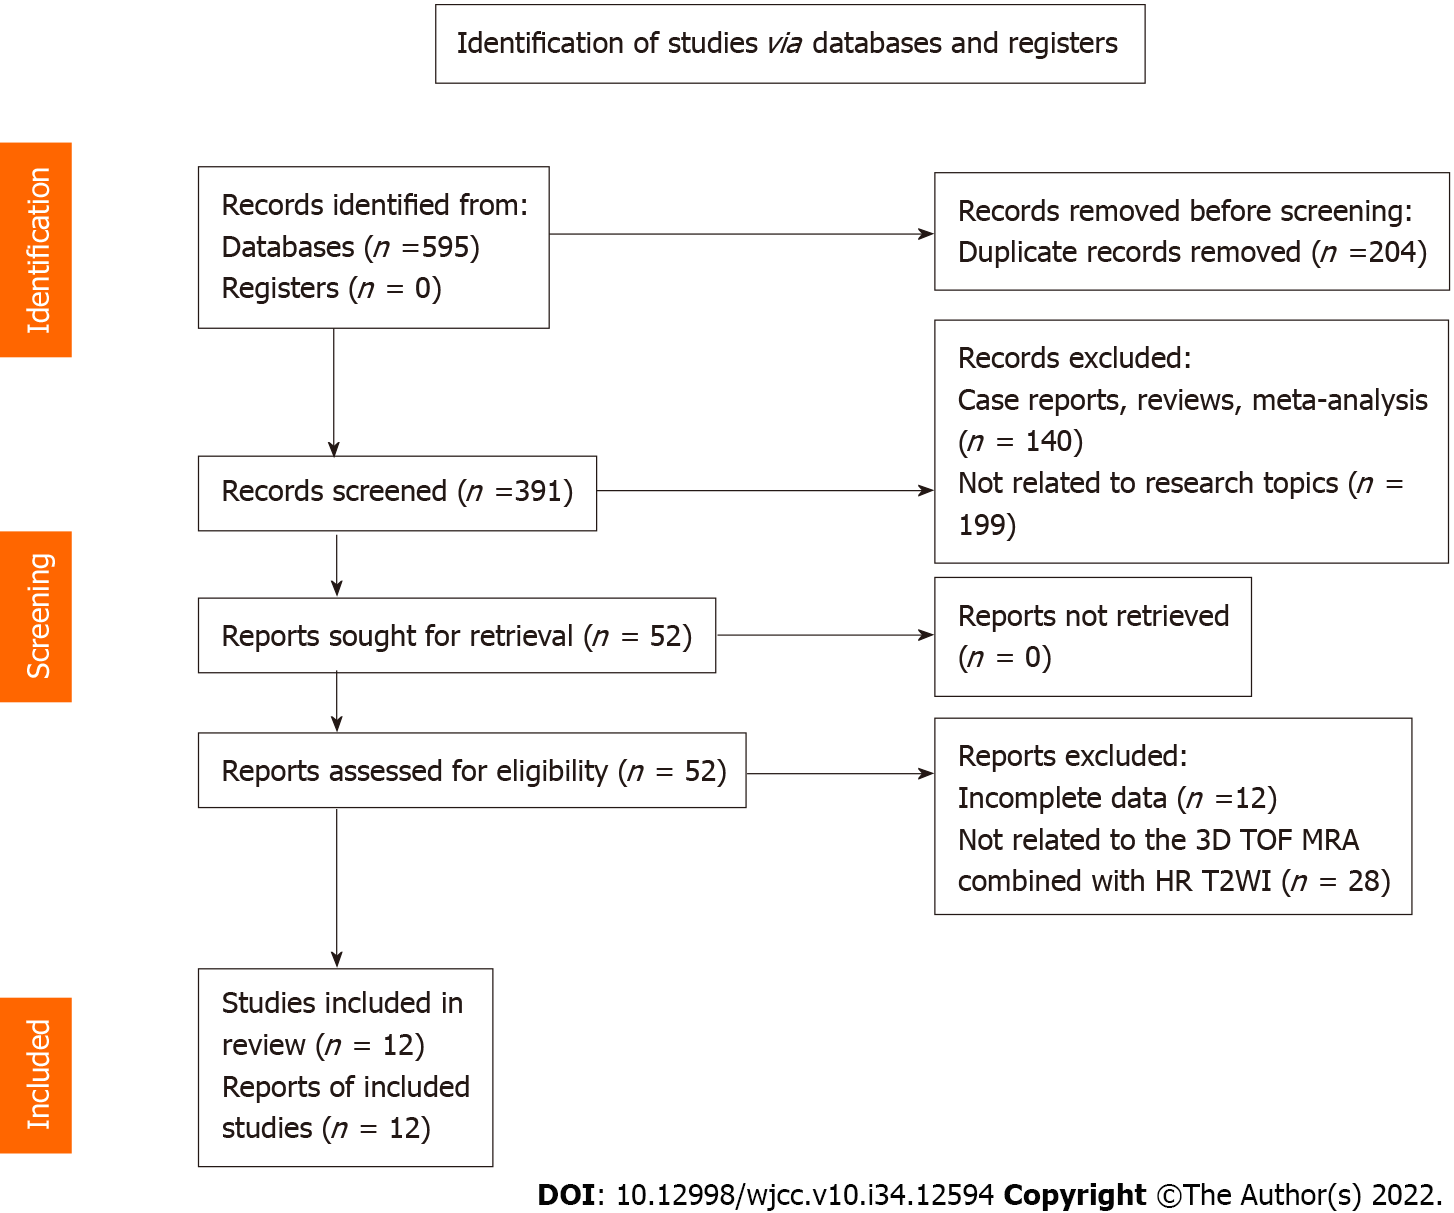
Figure 1 Literature search and results.
3D TOF MRA: Three-dimensional time-of-flight magnetic resonance angiography; HR T2WI: High resolution T2-weighted imaging.
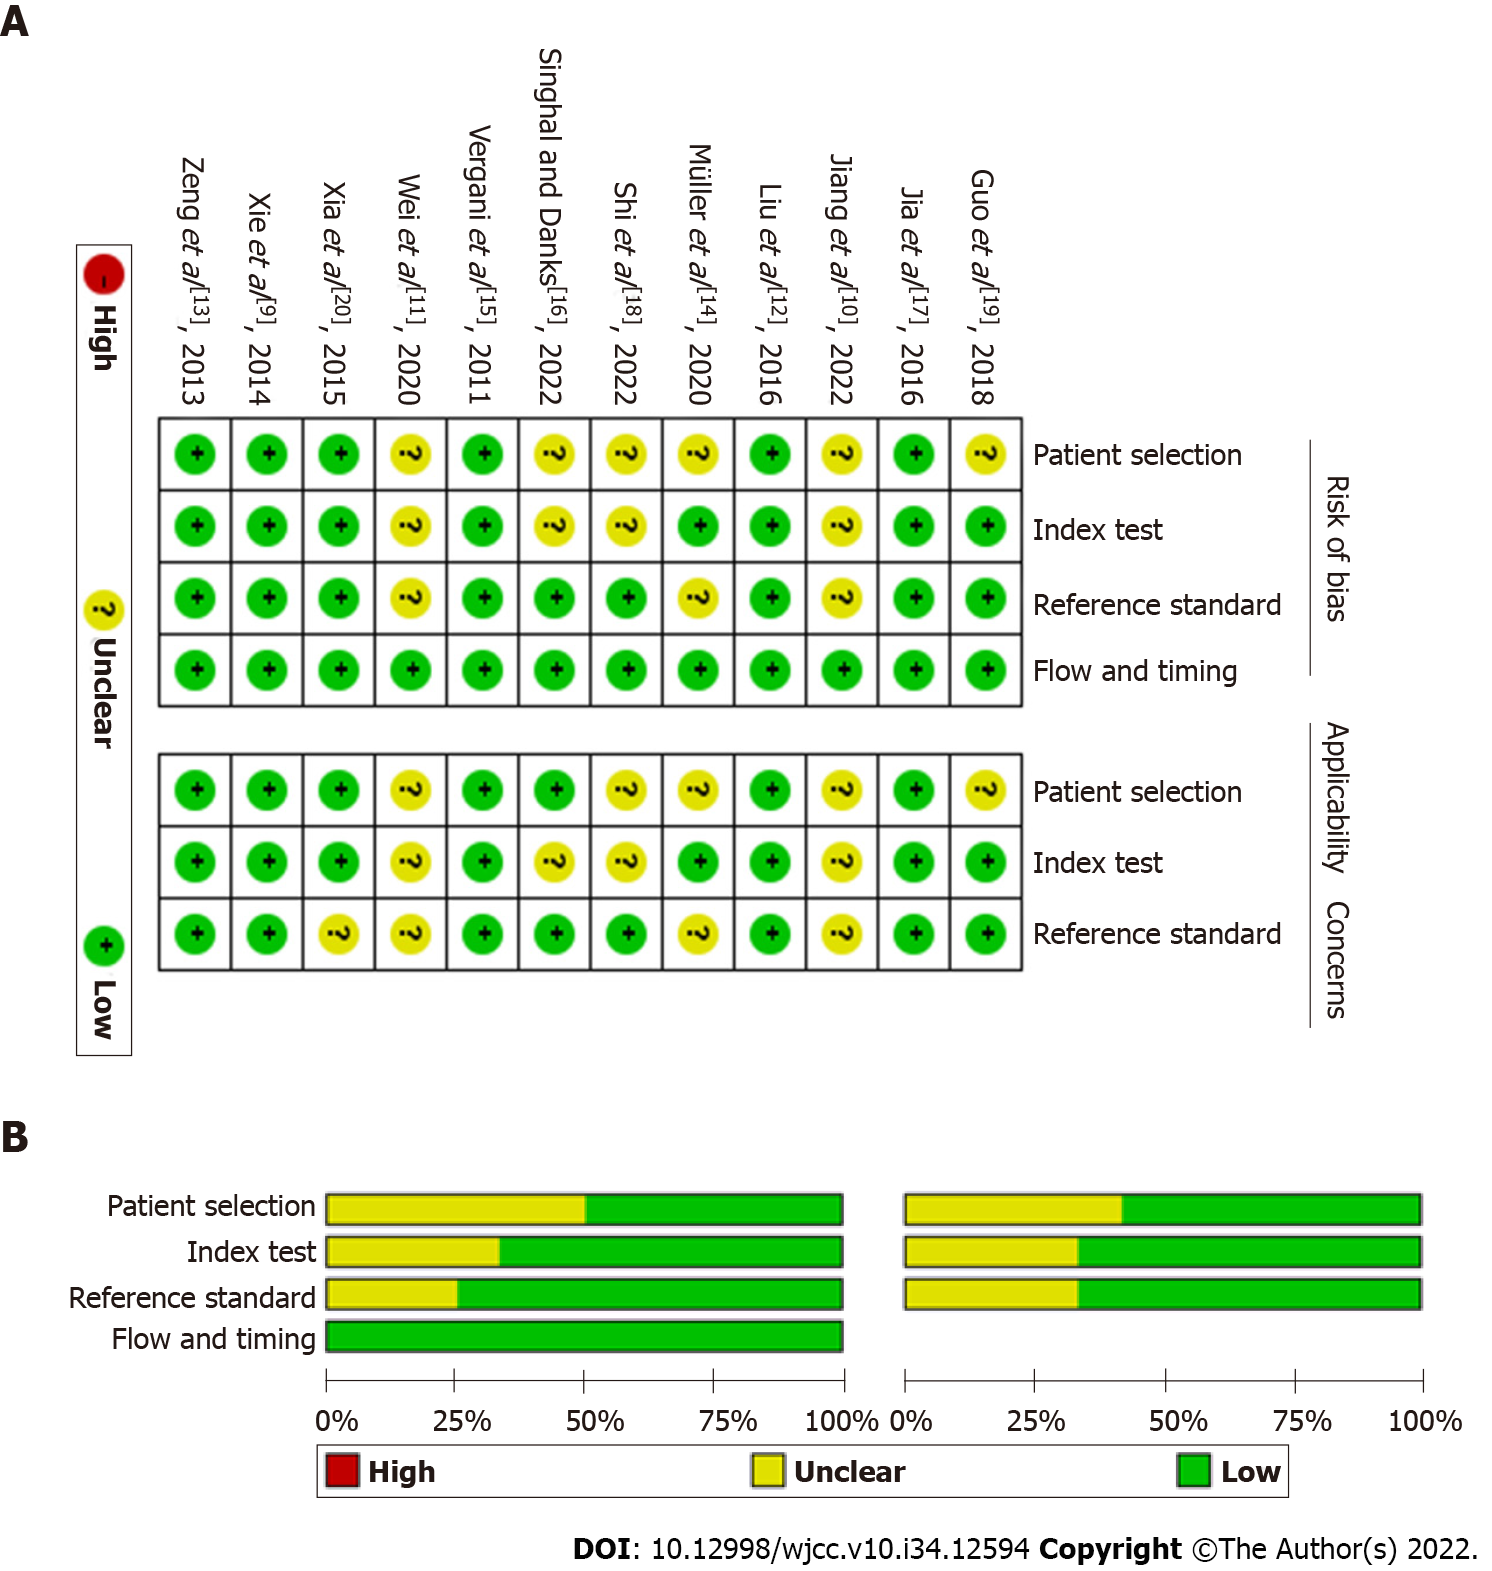
Figure 2 Methodological quality of the included studies assessed by the Quality Assessment of Diagnostic Accuracy Studies checklist.
A: Methodological quality graph; B: Methodological quality summary.
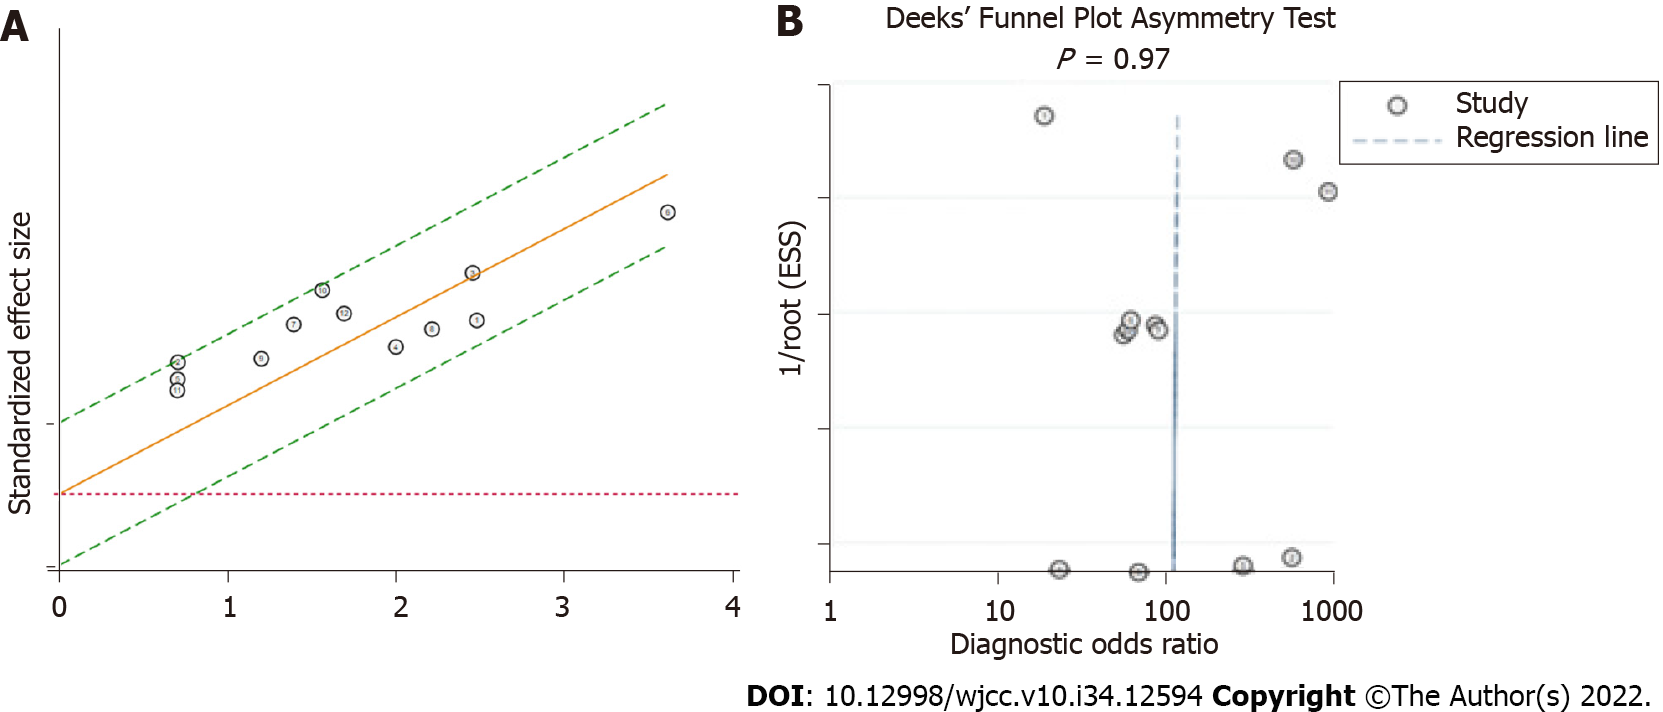
Figure 3 Heterogeneity and publication bias of the meta-analysis.
A: Galbraith plot; B: Deeks’ funnel plot.
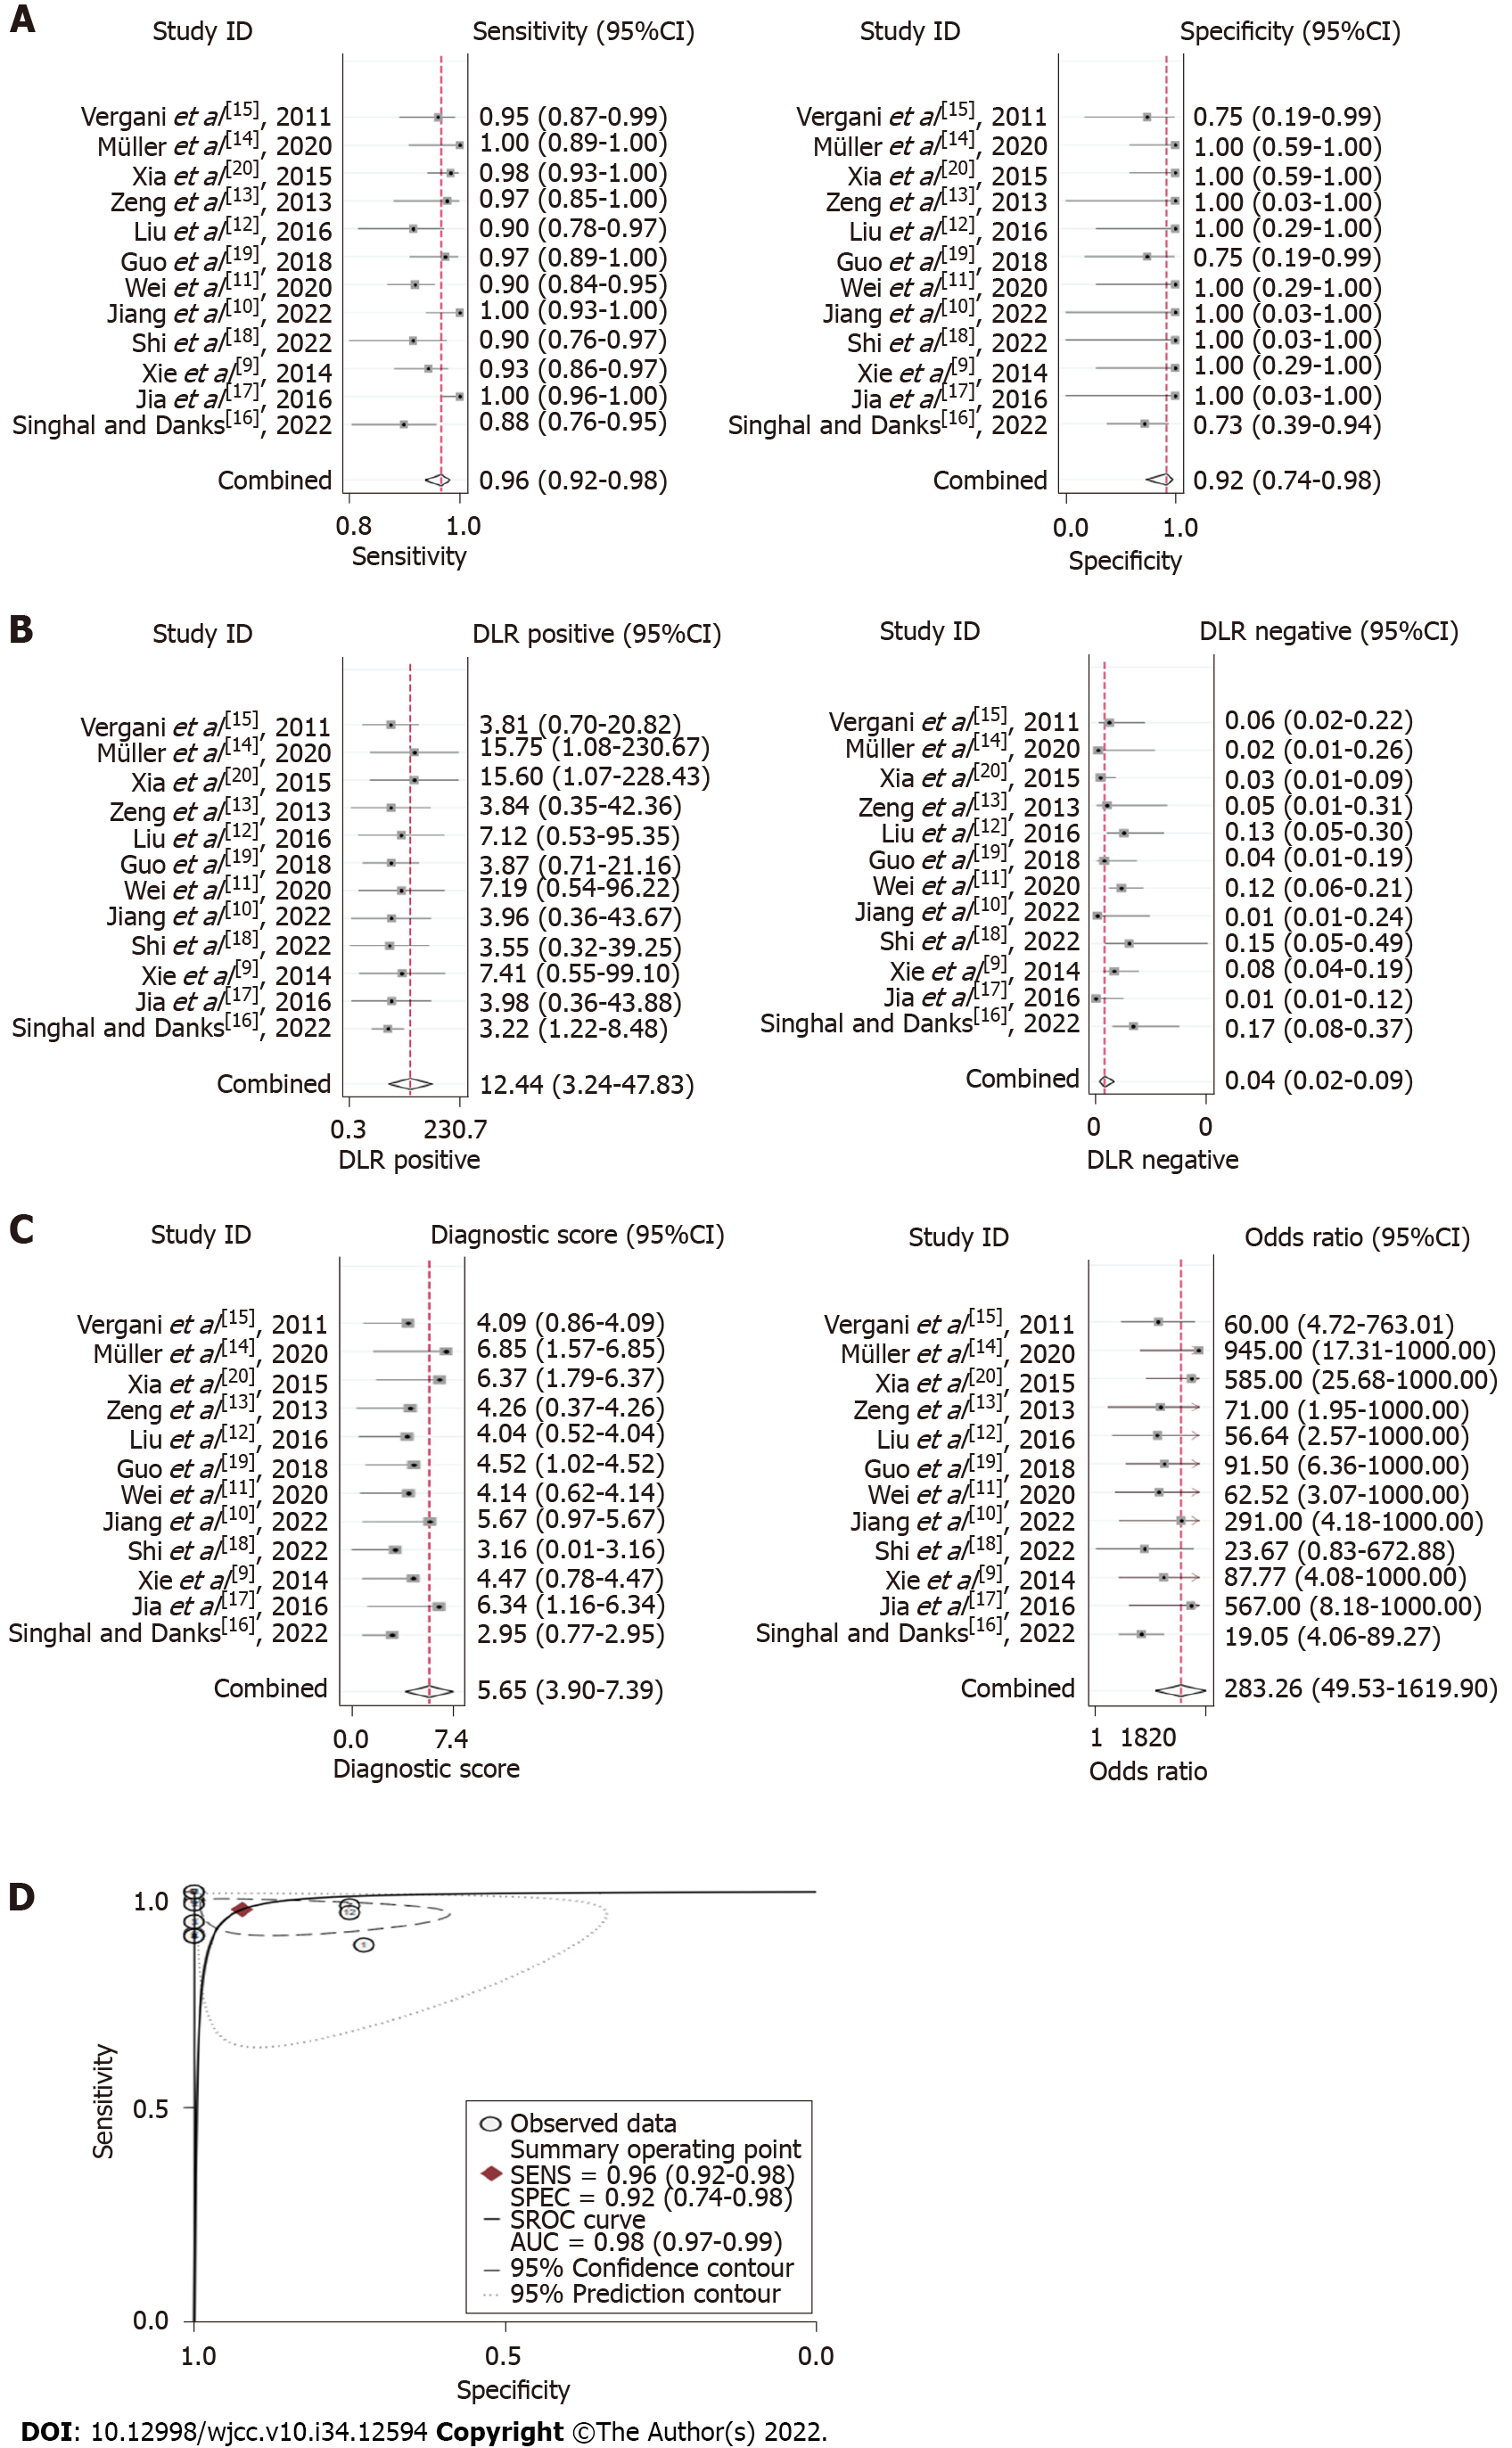
Figure 4 Summary effect size of the meta-analysis.
A: Pooled sensitivity and specificity; B: Pooled positive likelihood ratio and pooled negative likelihood ratio; C: Pooled diagnostic odds ratio; D: Summary receiver operating characteristic curve. CI: Confidence interval; AUC: Area under the curve.
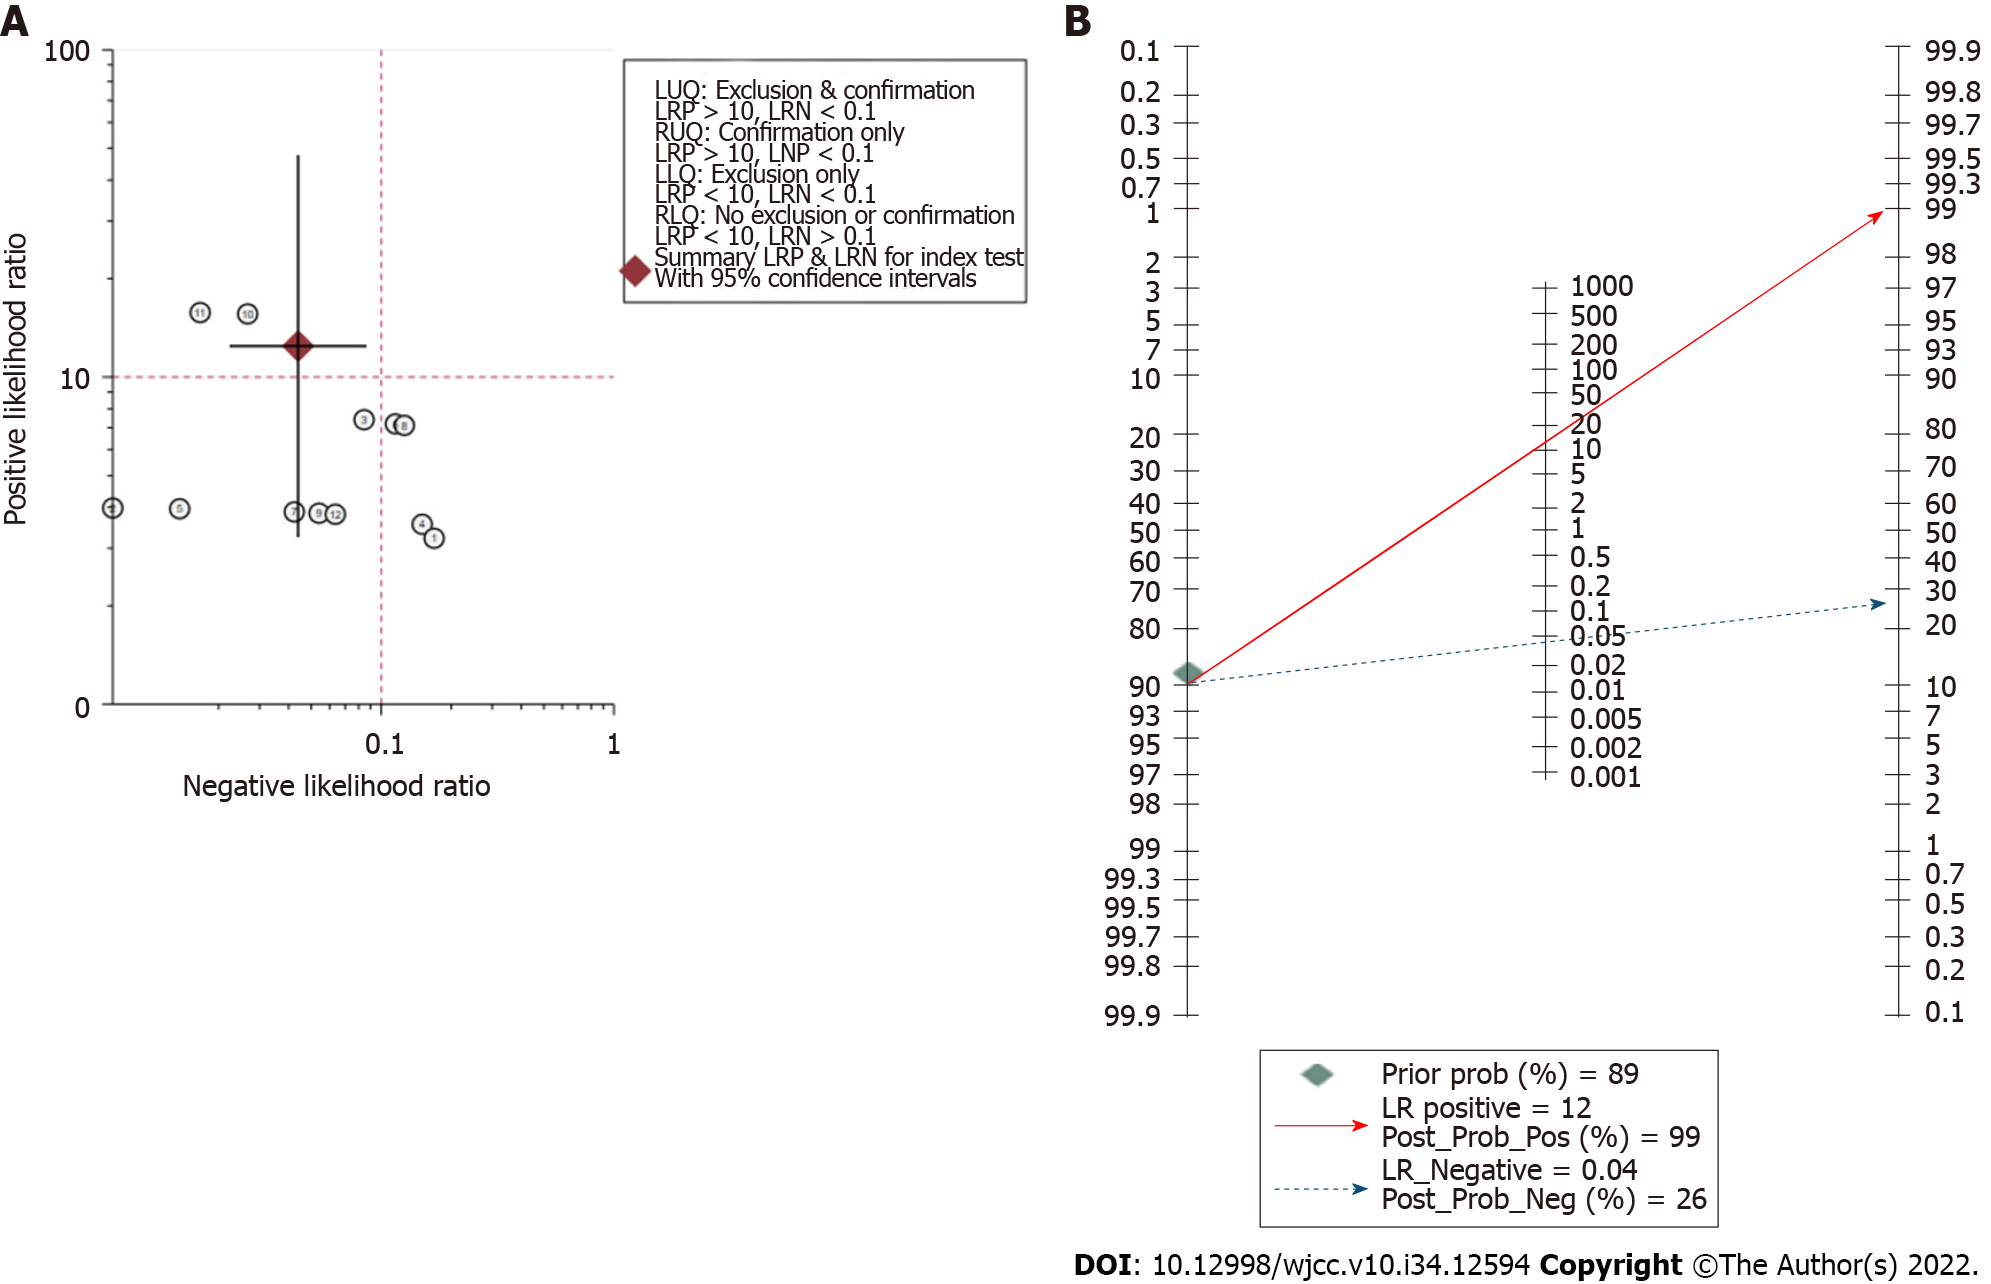
Figure 5 Assessment of clinical application value of three-dimensional time-of-flight magnetic resonance angiography combined with high resolution T2-weighted imaging.
A: Likelihood ratio scatter plot; B: Fagan nomogram shows the post-test probability.
- Citation: Liang C, Yang L, Zhang BB, Guo SW, Li RC. Three-dimensional time-of-flight magnetic resonance angiography combined with high resolution T2-weighted imaging in preoperative evaluation of microvascular decompression. World J Clin Cases 2022; 10(34): 12594-12604
- URL: https://www.wjgnet.com/2307-8960/full/v10/i34/12594.htm
- DOI: https://dx.doi.org/10.12998/wjcc.v10.i34.12594


