Copyright
©The Author(s) 2022.
World J Clin Cases. Sep 26, 2022; 10(27): 9670-9679
Published online Sep 26, 2022. doi: 10.12998/wjcc.v10.i27.9670
Published online Sep 26, 2022. doi: 10.12998/wjcc.v10.i27.9670
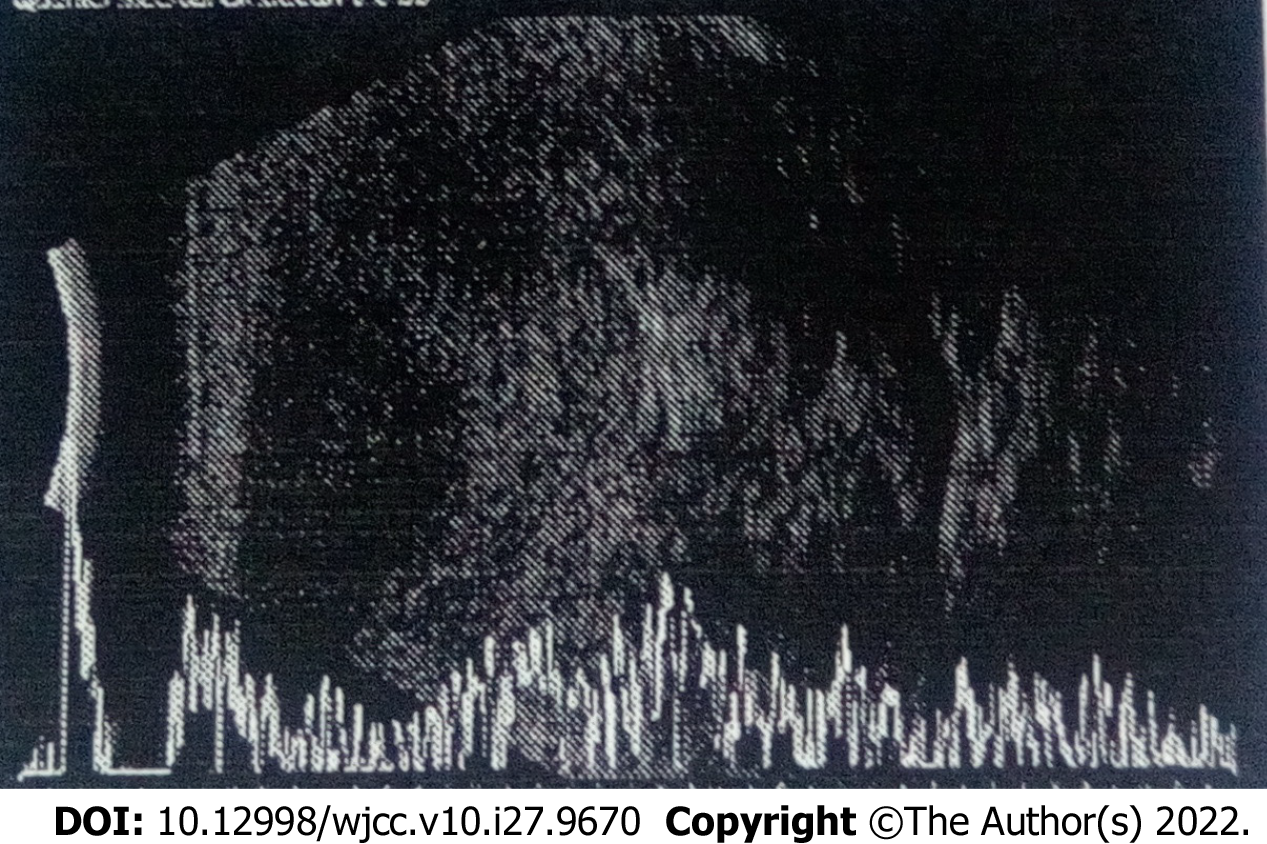
Figure 1 Ultrasonographic examination showing irregular, non-uniform, mixed echogenic masses.
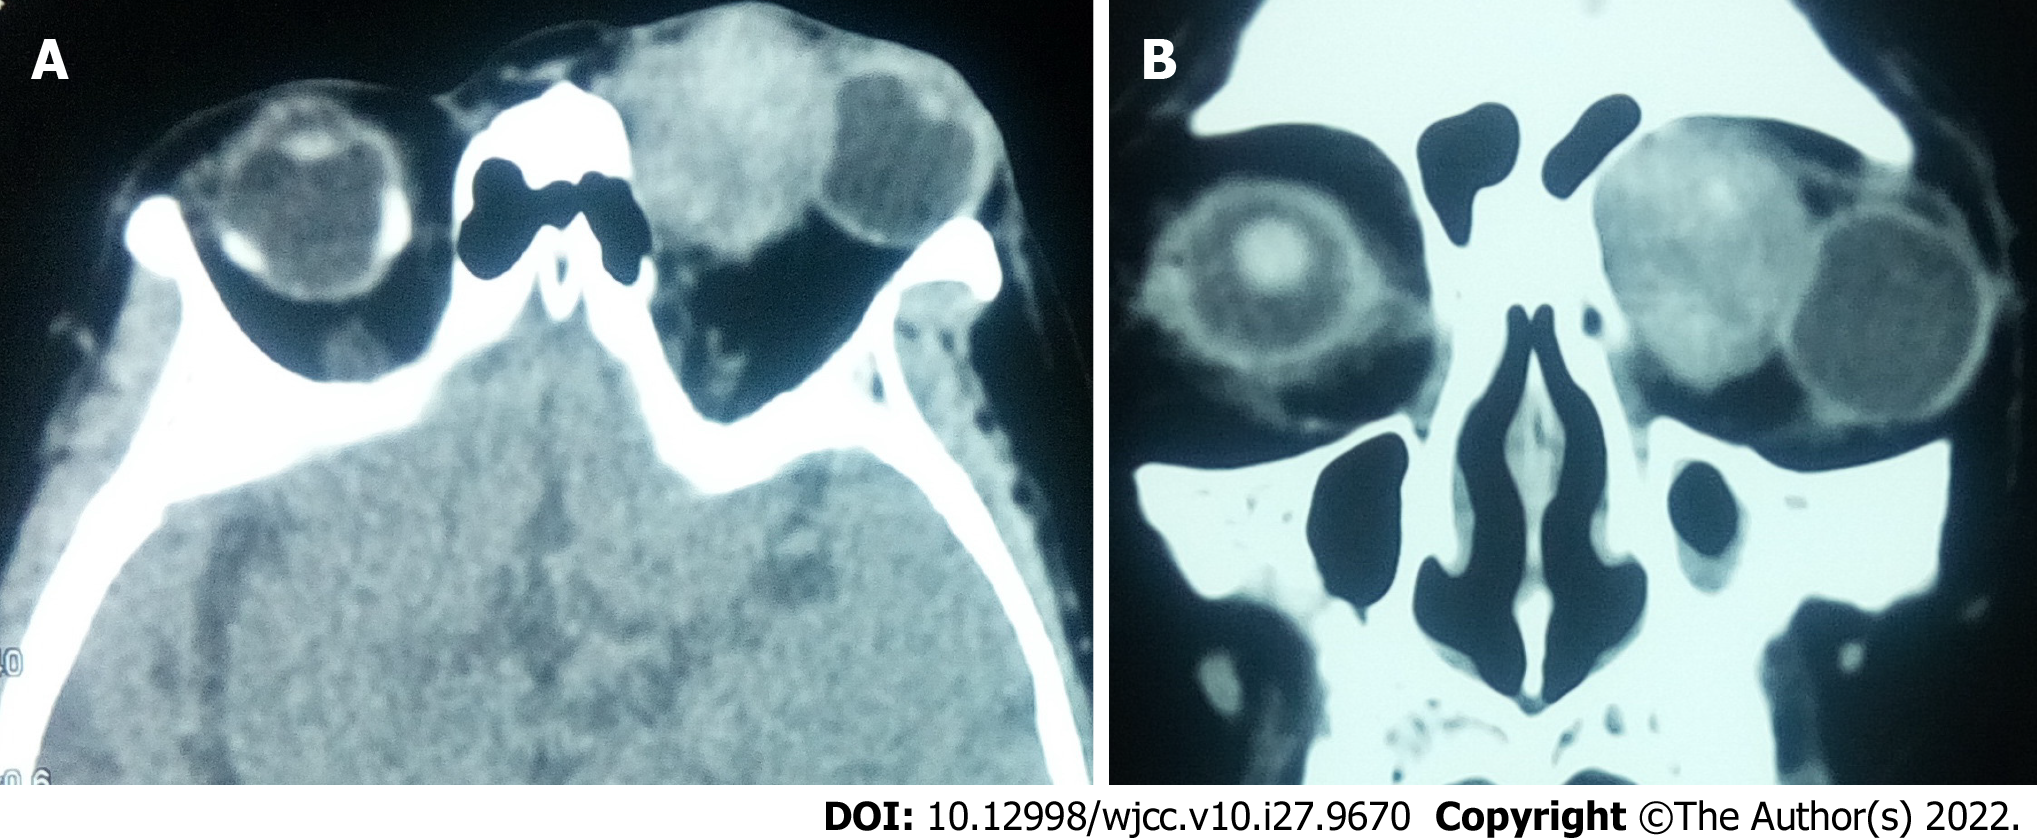
Figure 2 Computed tomography images showing a well-defined, solitary, ovoid soft tissue density mass in the superomedial quadrant of the left orbit.
A: Axial computed tomography (CT) scan; B: Coronal CT scan.
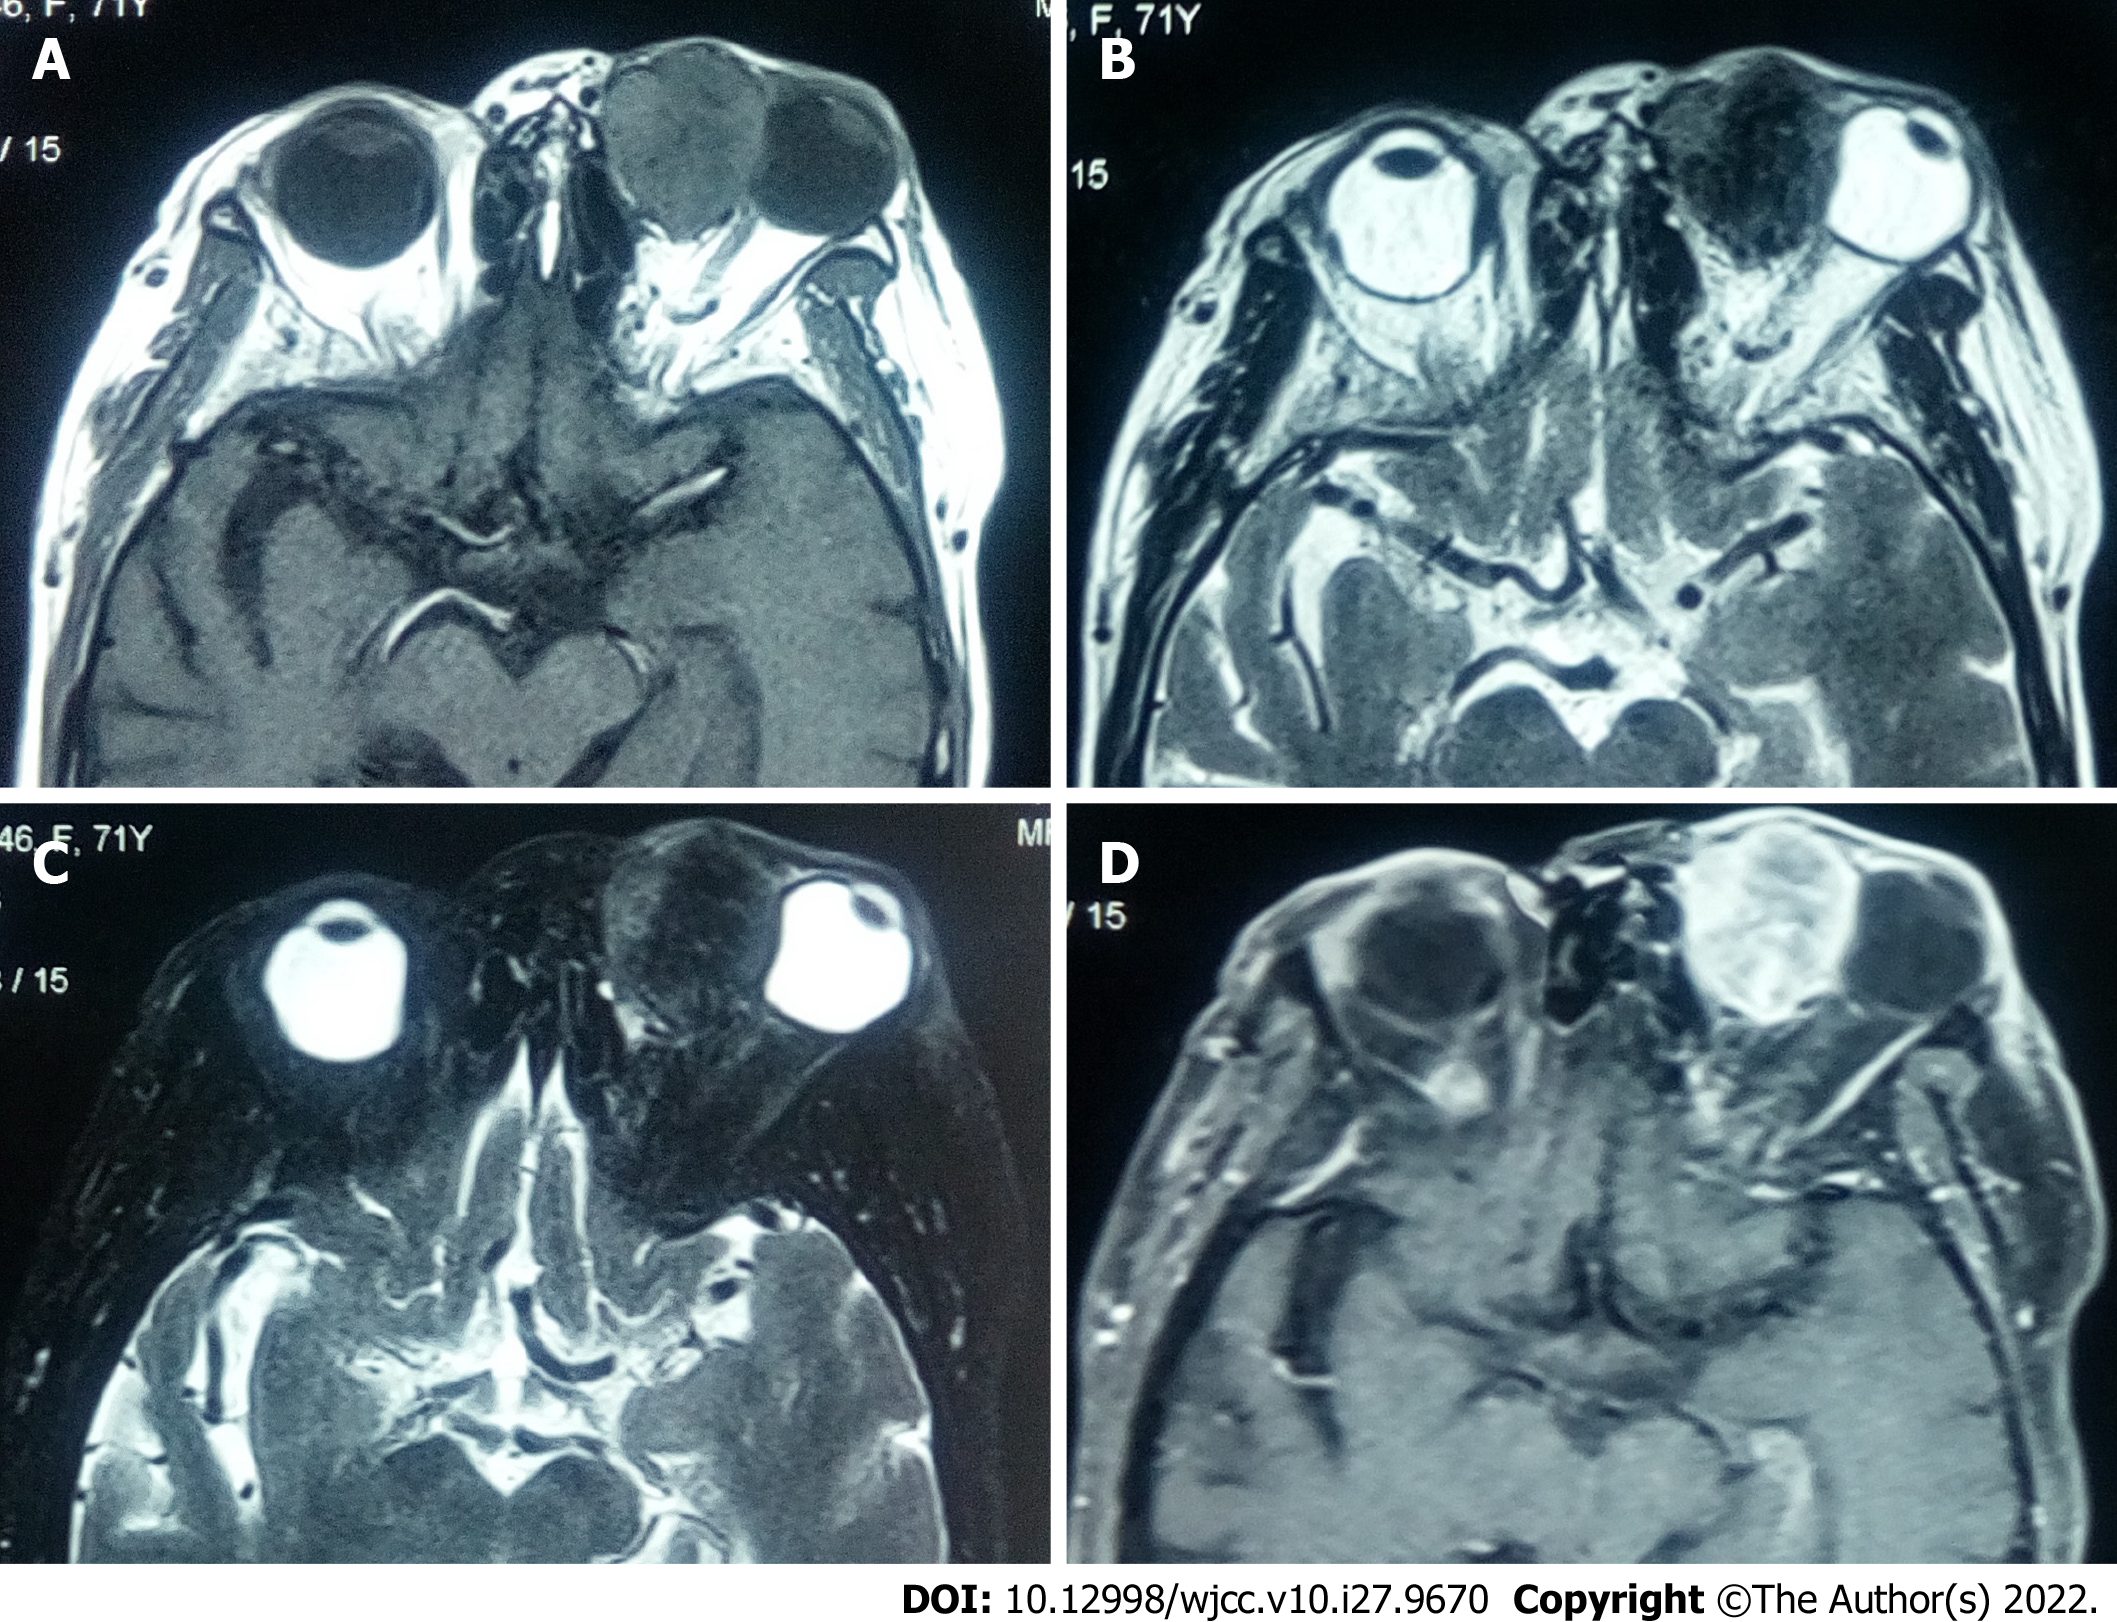
Figure 3 Magnetic resonance images showing a well-circumscribed circular mass in the superomedial quadrant of the left orbit.
A: Isointense mixed-signal on T1 weighted image; B: Hypointense mixed signal on T2 weighted image; C: Hypointense mixed signal on fat-suppressed T2 weighted image; D: Most part of the tumor had significant enhancement, whereas there were patchy slightly enhanced areas in the tumor on contrast-enhanced T1 weighted image.
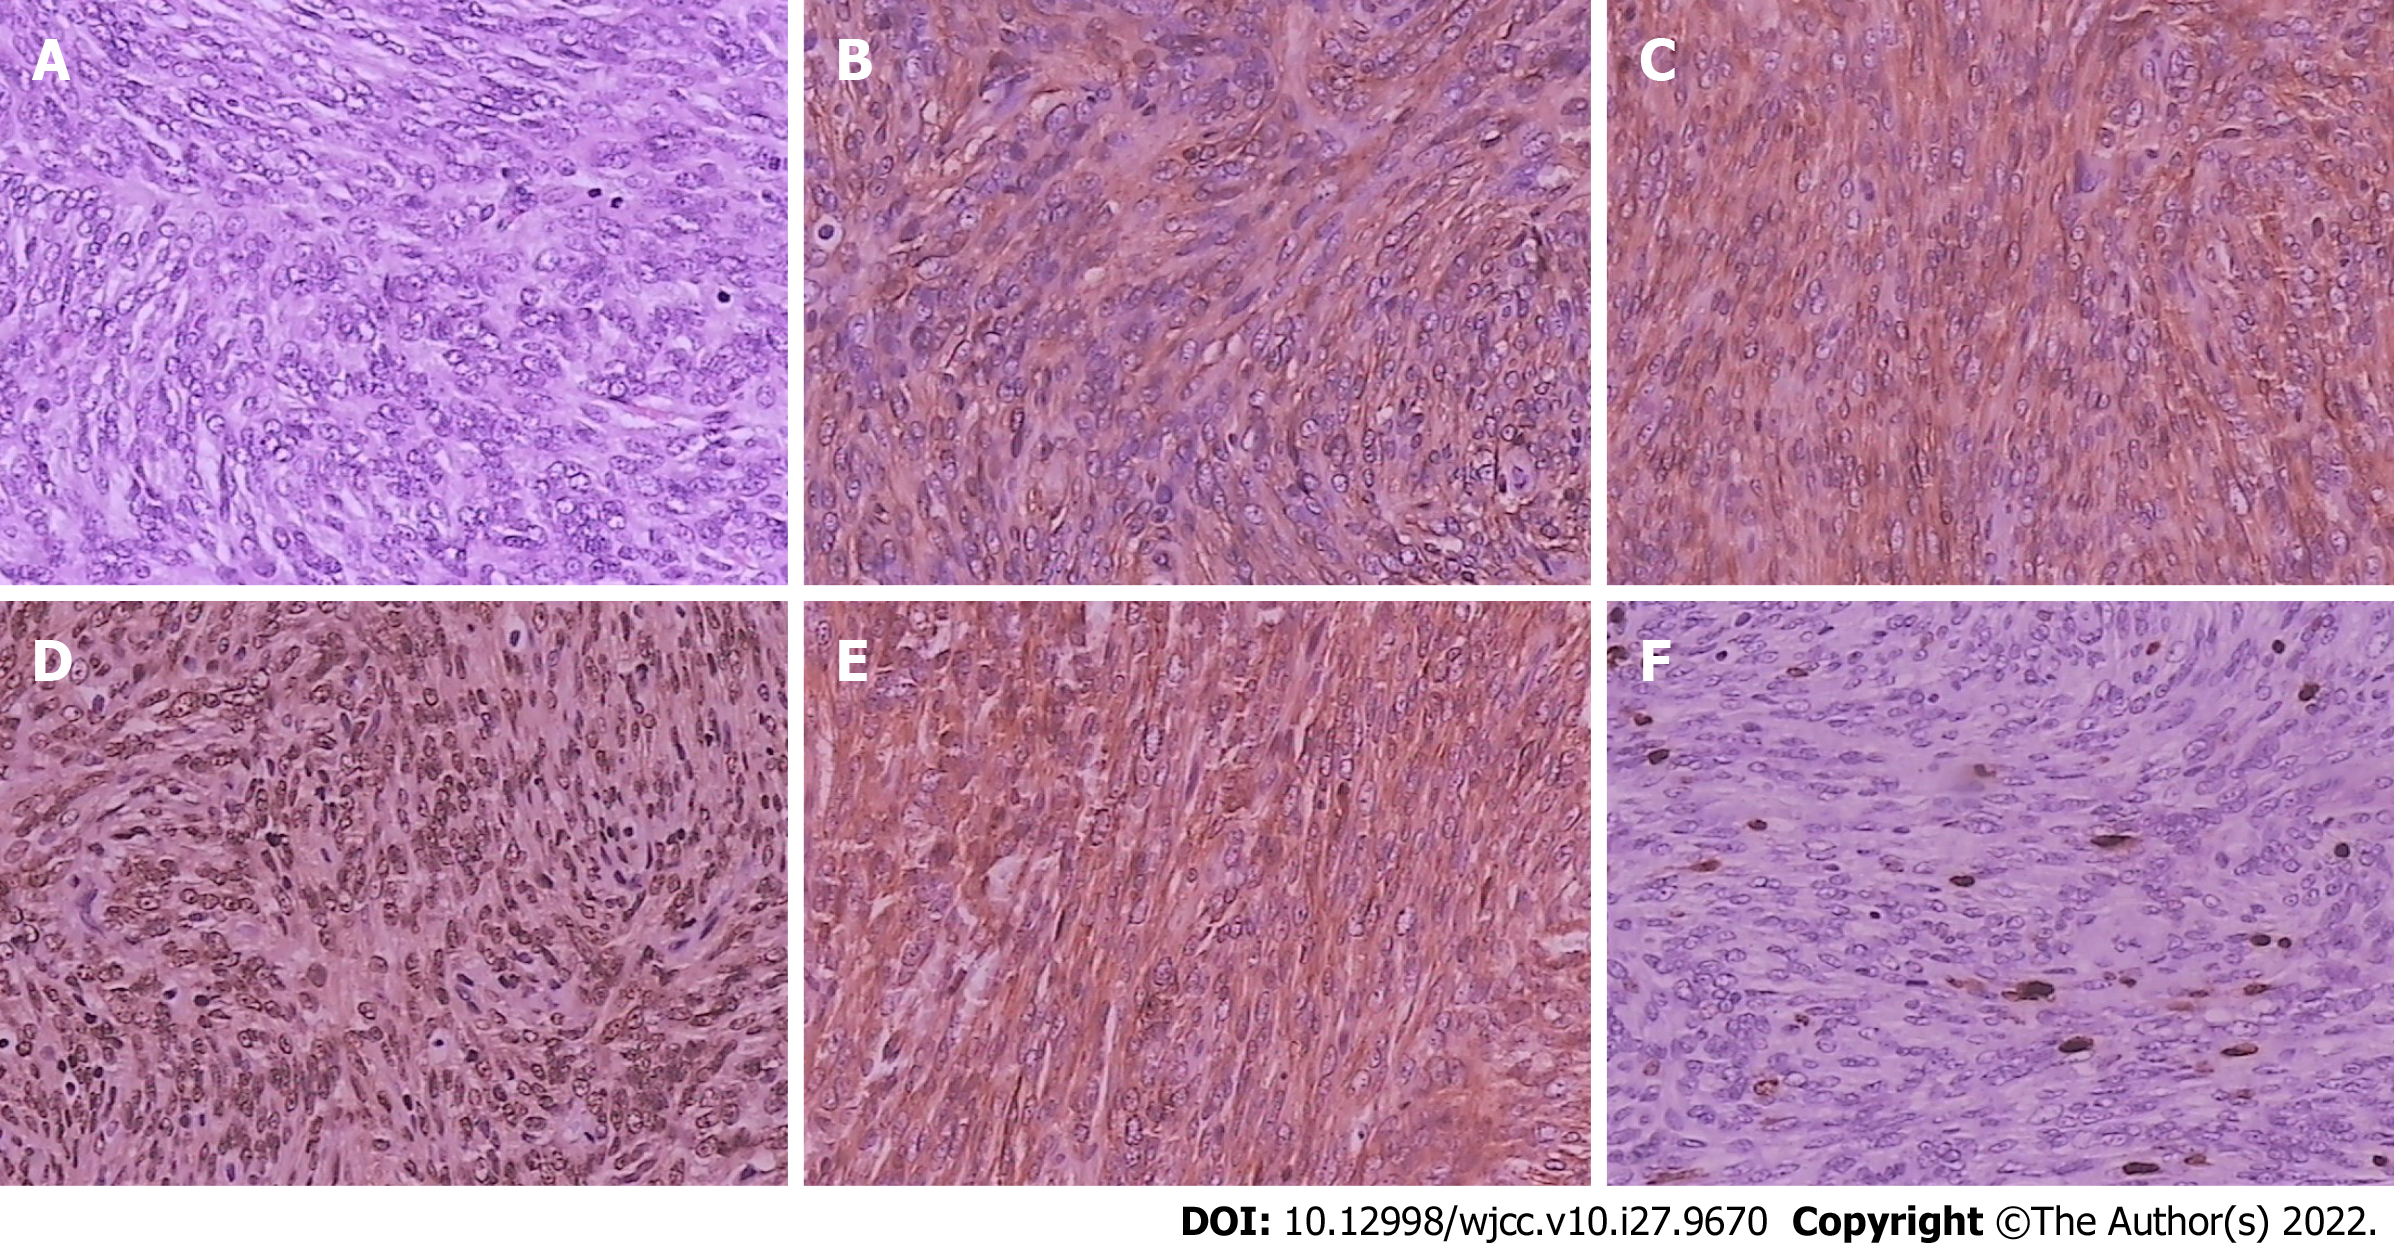
Figure 4 Histopathological and immunohistochemical examinations of tumors.
A: Tumor cells with oval nuclei, conspicuous nucleoli, and mitotic activity (hematoxylin and eosin staining, 200 ×); B: Tumor cells positive for CD34 (200 ×); C: Tumor cells positive for CD99 (200 ×); D: Tumor cells positive for STAT-6 (200 ×); E: Tumor cells positive for Bcl-2 (200 ×); F: Tumor cells positive for Ki-67 (close to 10%) (200 ×).
- Citation: Ren MY, Li J, Wu YX, Li RM, Zhang C, Liu LM, Wang JJ, Gao Y. Clinical characteristics and prognosis of orbital solitary fibrous tumor in patients from a Chinese tertiary eye hospital. World J Clin Cases 2022; 10(27): 9670-9679
- URL: https://www.wjgnet.com/2307-8960/full/v10/i27/9670.htm
- DOI: https://dx.doi.org/10.12998/wjcc.v10.i27.9670


