Copyright
©The Author(s) 2022.
World J Clin Cases. May 26, 2022; 10(15): 4886-4894
Published online May 26, 2022. doi: 10.12998/wjcc.v10.i15.4886
Published online May 26, 2022. doi: 10.12998/wjcc.v10.i15.4886
Figure 1 Abdominal magnetic resonance imaging from 2015 to 2017.
A: Magnetic resonance imaging (MRI) in 2015. Axial post-contrast T2-weighted fat saturated MRI in pancreatic phase showed enlarged pancreas with diffuse homogenous enhancement (*). The main pancreatic duct (triangle) and common bile duct (arrow) appear slightly dilated; B: MRI in 2016. Axial post-contrast T2-weighted fat saturated MRI in pancreatic phase showed enlarged pancreas with diffuse homogenous enhancement (*). The main pancreatic duct (triangle) appeared irregularly dilated, and the common bile duct showed mild dilatation (arrow); C: MRI in 2017. Axial post-contrast T2-weighted fat saturated MRI in pancreatic phase showed enlarged pancreas with diffuse homogenous enhancement (*). The head of the pancreas showed obvious swelling (*). The main pancreatic duct (triangle) appeared irregularly expanded, and the common bile duct showed compression (arrow).
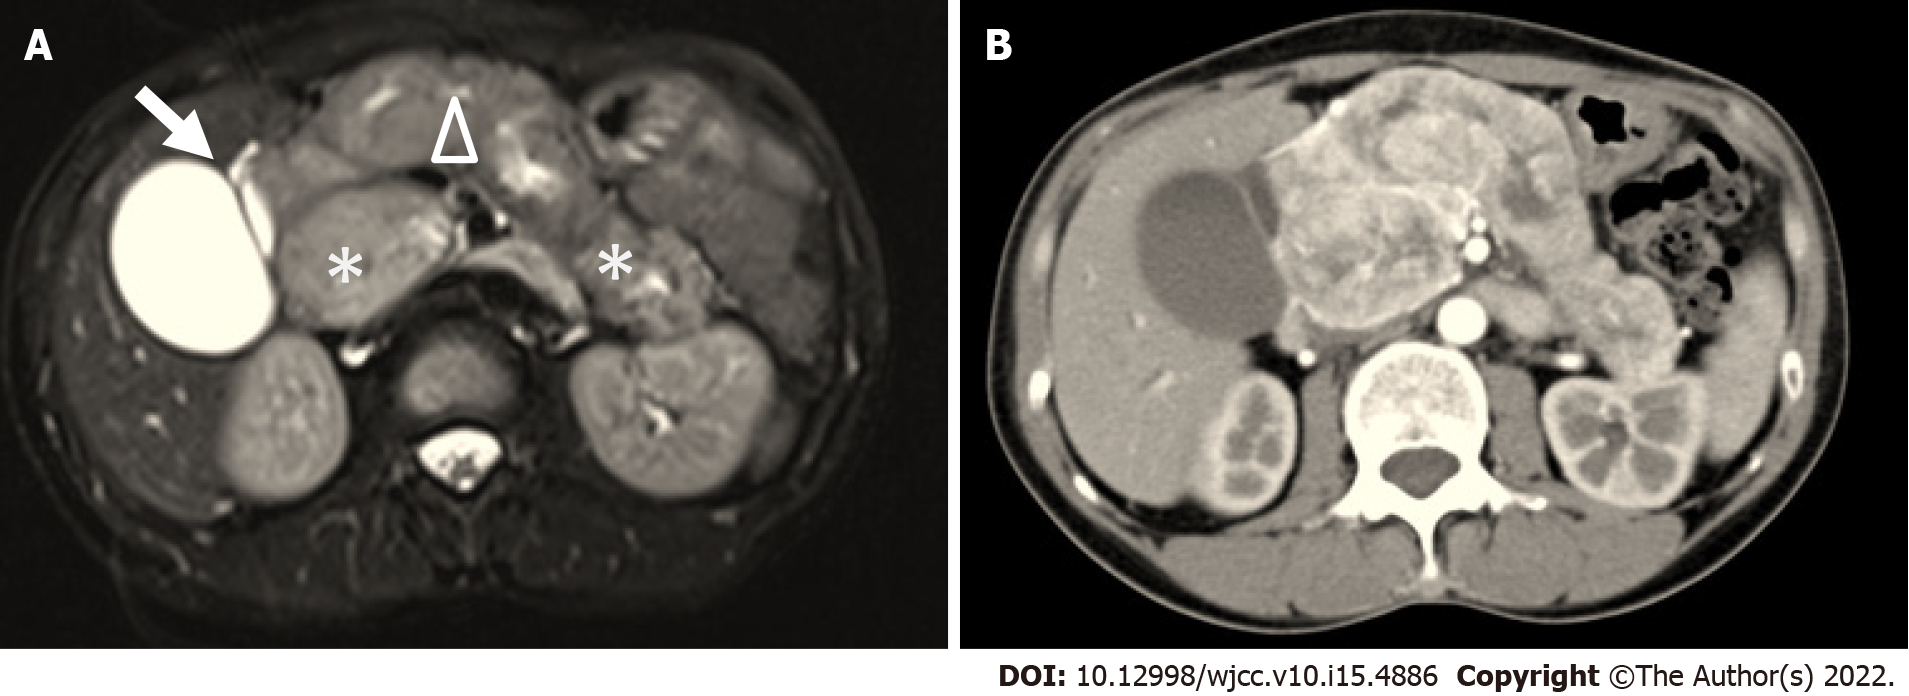
Figure 2 Abdominal imaging in 2018.
A: Abdominal magnetic resonance imaging. Axial post-contrast T2-weighted fat saturated magnetic resonance imaging in pancreatic phase showed enlarged pancreas with diffuse uneven homogenous enhancement and sausage-like diffuse enlargement, especially in the pancreatic head (*). The main pancreatic duct (triangle) appeared irregularly dilated. The gallbladder and common bile duct showed compression (arrow); B: Multi-detector computed tomography. Axial post-contrast arterial phase in pancreatic phase showed no substantial space occupying lesion.
Figure 3 Immunohistochemical imaging of the pancreas from endoscopic ultrasonography-guided fine needle biopsy.
Hematoxylin and eosin stain showed pancreatic tissue (× 200); immunohistochemical staining showed chromogranin A (+), synaptophysin (+), pan-cytokeratin (+) and Ki-67 (MIB-1) (about 10%+) in the pancreatic tissue by endoscopic ultrasonography-guided fine needle biopsy. (× 200). HE: Hematoxylin and eosin; CgA: Chromogranin A; Syn: Synaptophysin; PCK: Pan-cytokeratin.
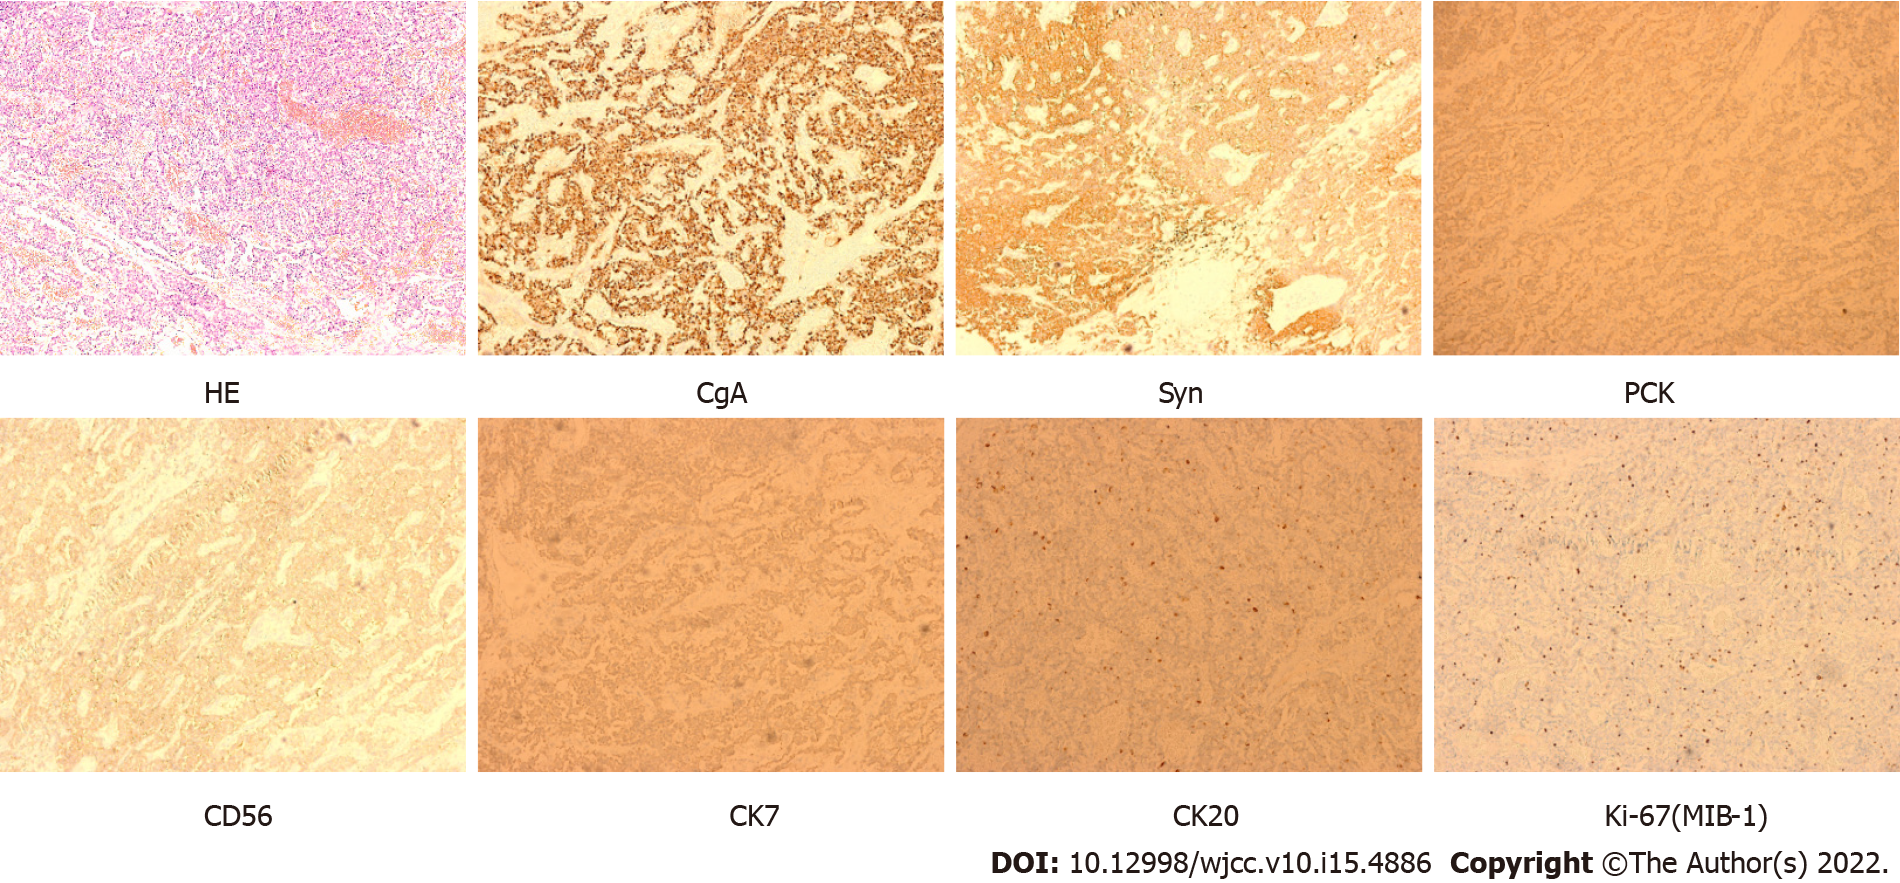
Figure 4 Immunohistochemical imaging of the pancreas from pancreatectomy.
Hematoxylin and eosin stain showed pancreatic tissue (× 200). immunohistochemical staining showed chromogranin A (+), synaptophysin (+), pan-cytokeratin (+), CD56 (+), CK7 (+), CK20 (+) and Ki-67 (MIB-1) (+, 3%-7%). (× 200). HE: Hematoxylin and eosin; CgA: Chromogranin A; Syn: Synaptophysin; PCK: Pan-cytokeratin.
- Citation: Lin ZQ, Li X, Yang Y, Wang Y, Zhang XY, Zhang XX, Guo J. Nonfunctional pancreatic neuroendocrine tumours misdiagnosed as autoimmune pancreatitis: A case report and review of literature. World J Clin Cases 2022; 10(15): 4886-4894
- URL: https://www.wjgnet.com/2307-8960/full/v10/i15/4886.htm
- DOI: https://dx.doi.org/10.12998/wjcc.v10.i15.4886


