Copyright
©The Author(s) 2022.
World J Clin Cases. May 16, 2022; 10(14): 4404-4413
Published online May 16, 2022. doi: 10.12998/wjcc.v10.i14.4404
Published online May 16, 2022. doi: 10.12998/wjcc.v10.i14.4404
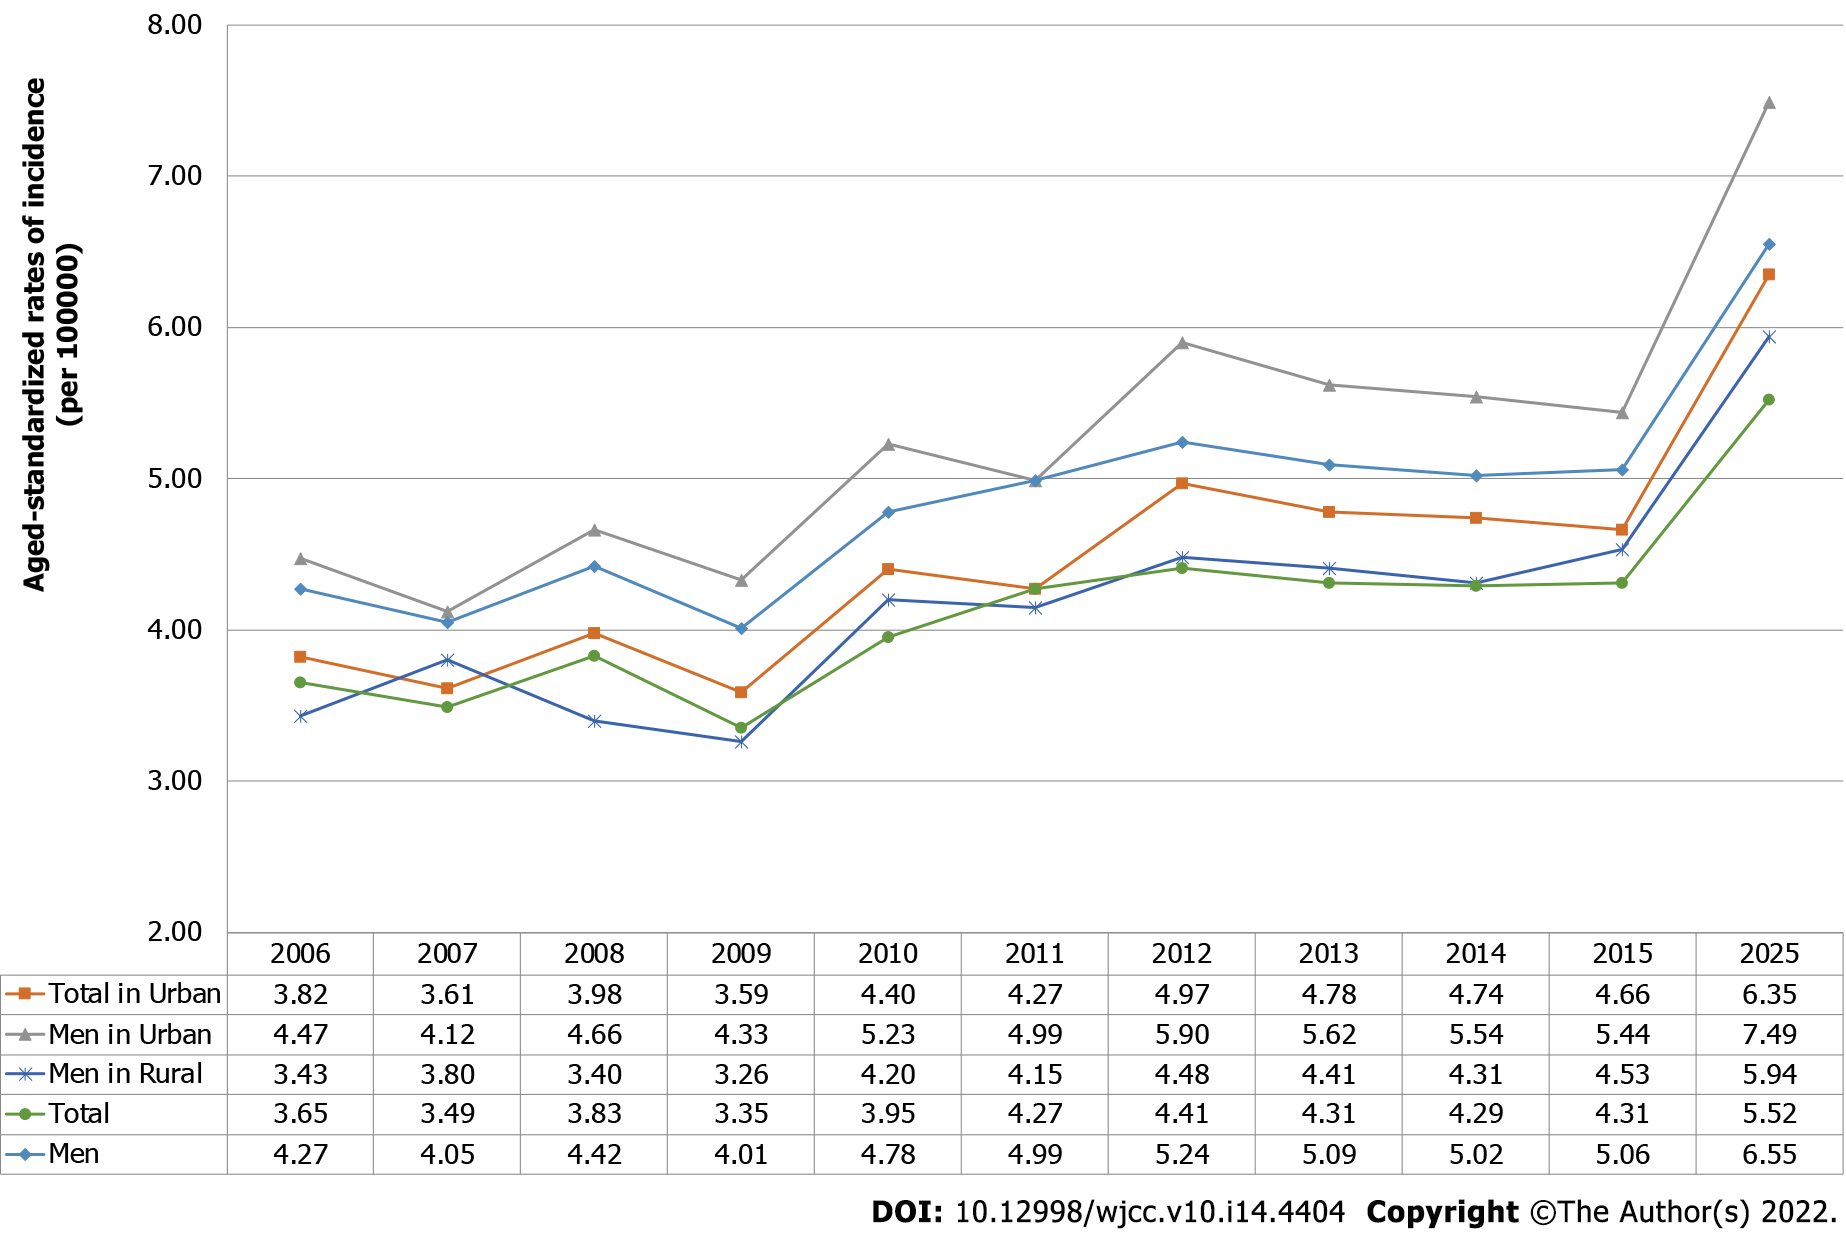
Figure 1 Trends in the age-standardized rate of pancreatic cancer incidence (per 100000) in China from 2006-2015 years, stratified by gender and urban-rural areas.
The incidence rates for the year 2025 were projected by fitting linear regression models.
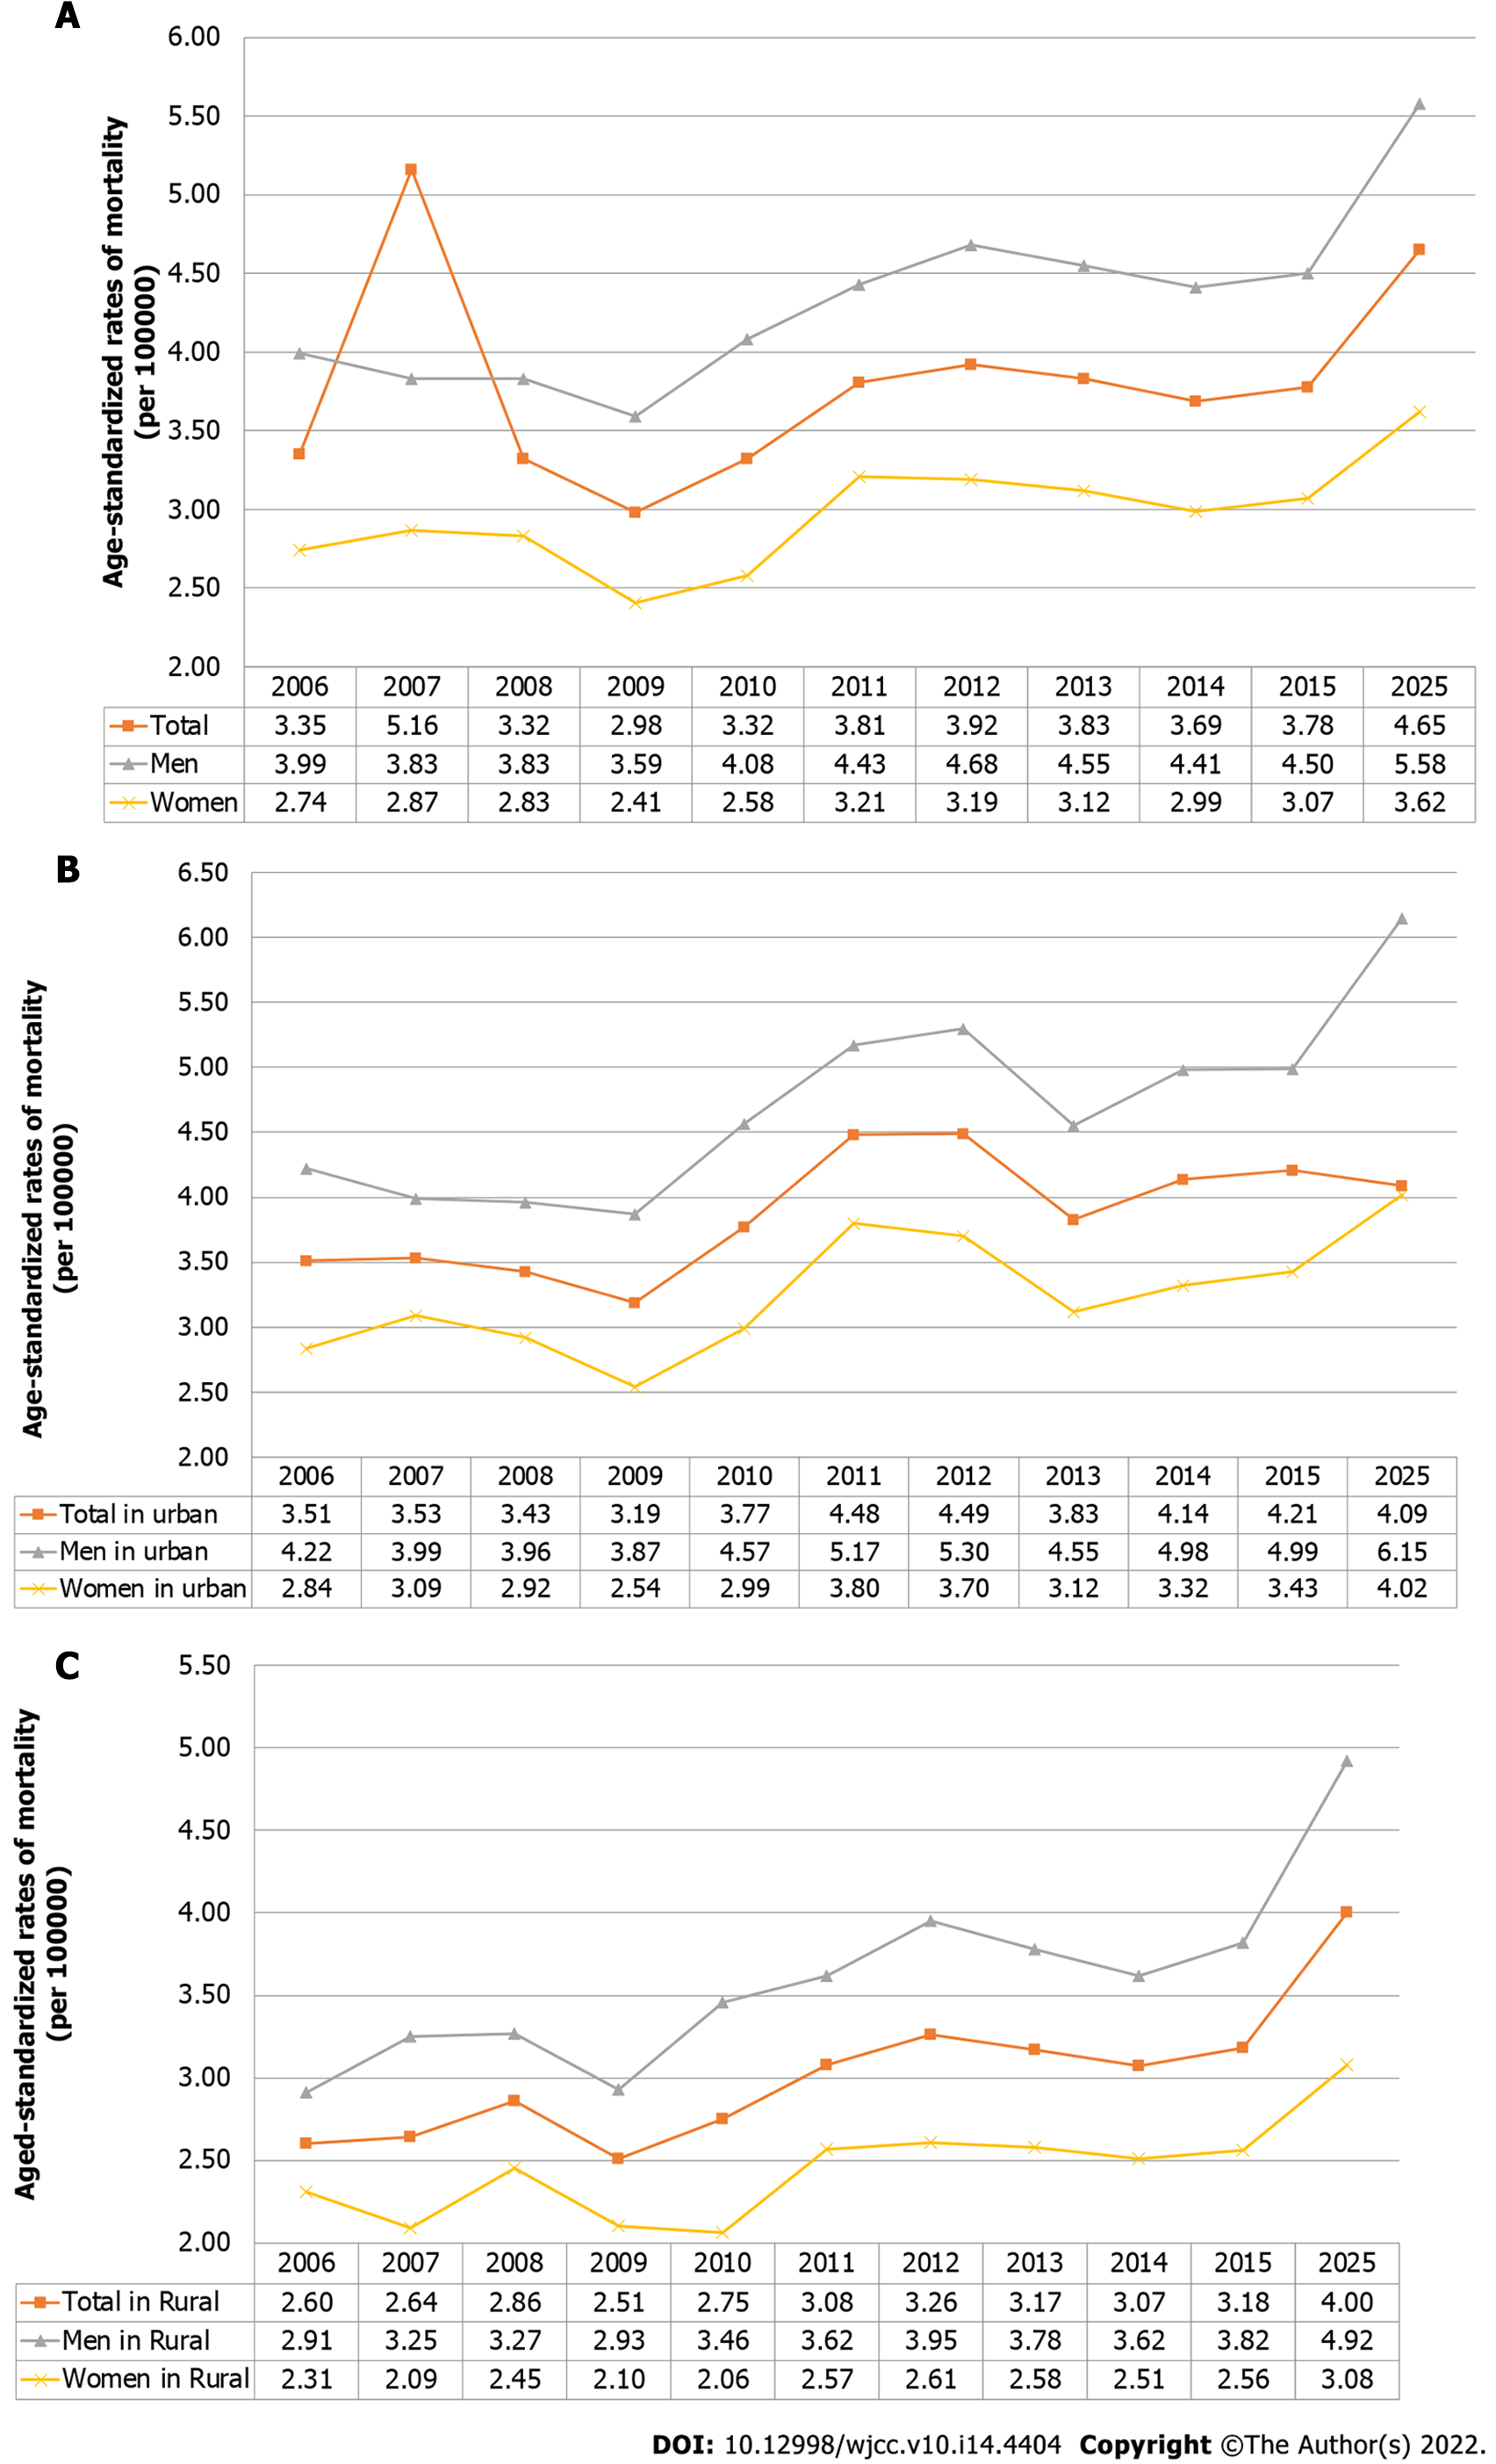
Figure 2 Trends in the age-standardized rate of pancreatic cancer mortality (per 100000) in China from 2006-2015 years in national (A), urban (B) and rural (C) regions, stratified by gender.
The incidence rates for the year 2025 were projected by fitting linear regression models.
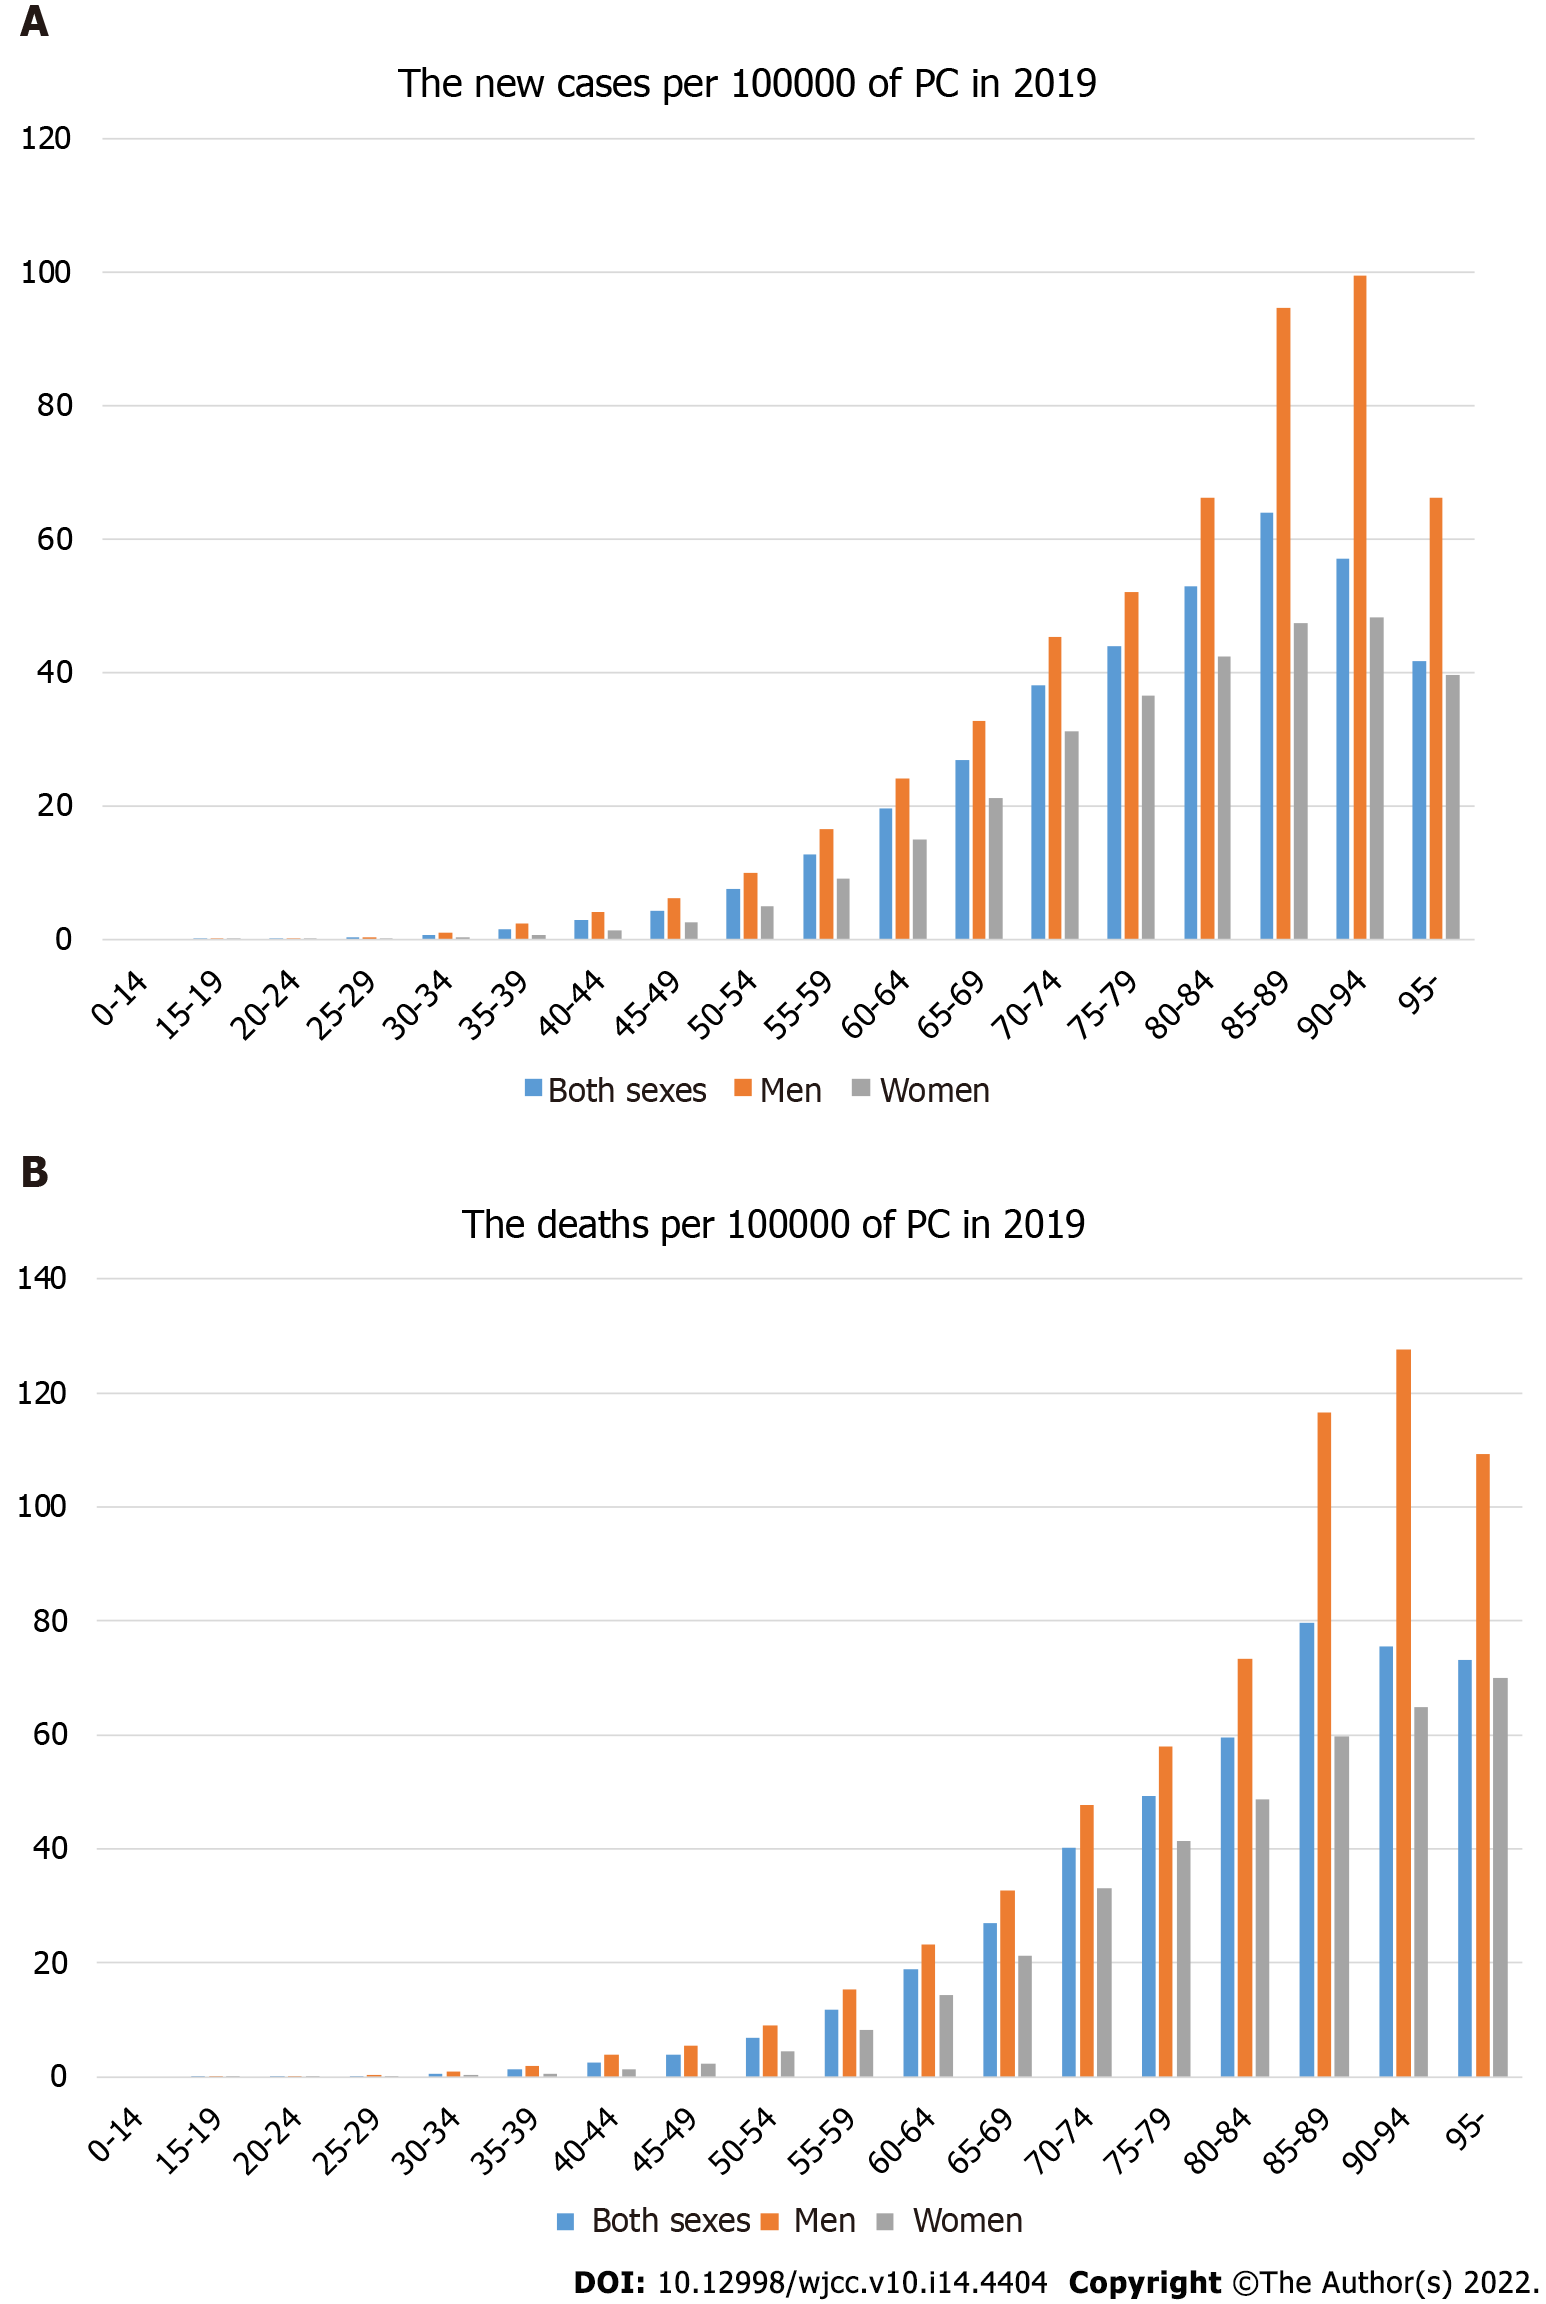
Figure 3 Distribution of age groups in the age-standardized rate incidence (A) and mortality (B) (per 100000) of pancreatic cancer in China, 2019.
PC: Pancreatic cancer.
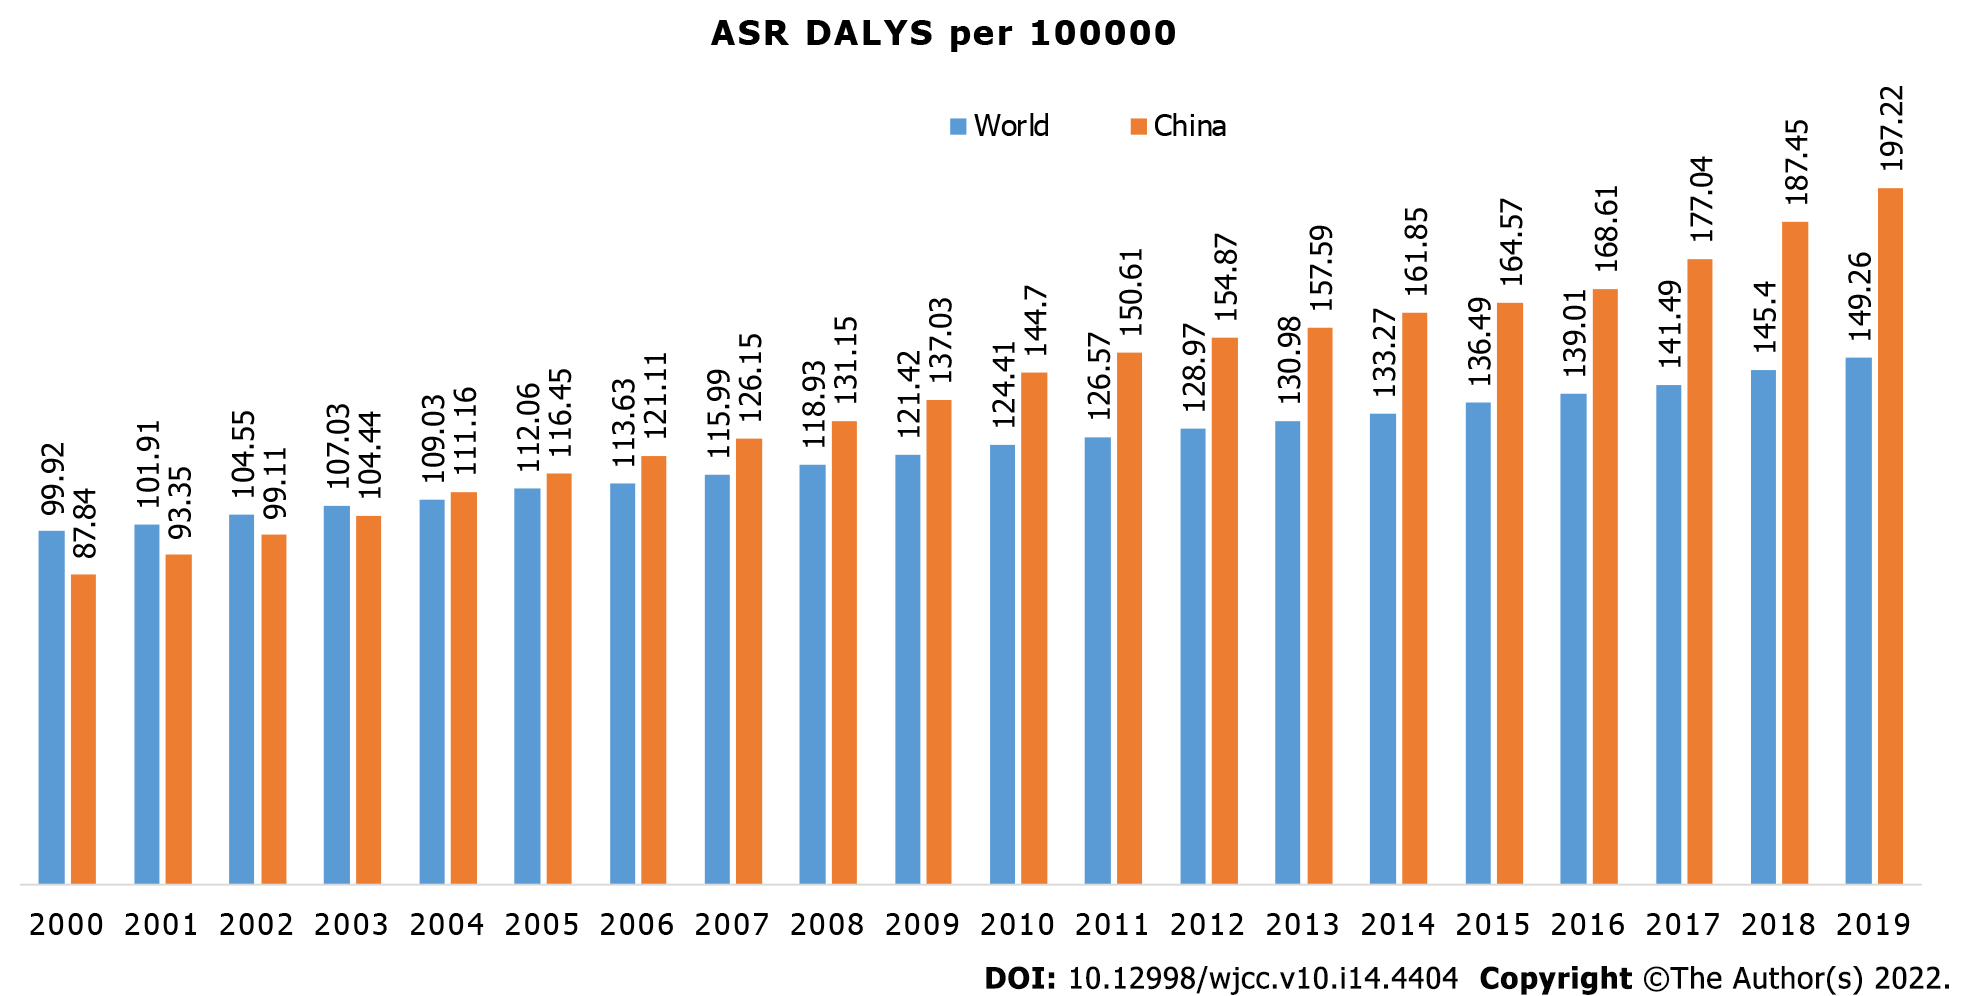
Figure 4 Comparisons of the disability-adjusted life years of pancreatic cancer between China and other countries from 2000 to 2019.
DALYs: Disability-adjusted life years.
- Citation: Yin MY, Xi LT, Liu L, Zhu JZ, Qian LJ, Xu CF. Pancreatic cancer incidence and mortality patterns in 2006-2015 and prediction of the epidemiological trend to 2025 in China. World J Clin Cases 2022; 10(14): 4404-4413
- URL: https://www.wjgnet.com/2307-8960/full/v10/i14/4404.htm
- DOI: https://dx.doi.org/10.12998/wjcc.v10.i14.4404


