Copyright
©The Author(s) 2022.
World J Clin Cases. Apr 16, 2022; 10(11): 3352-3368
Published online Apr 16, 2022. doi: 10.12998/wjcc.v10.i11.3352
Published online Apr 16, 2022. doi: 10.12998/wjcc.v10.i11.3352
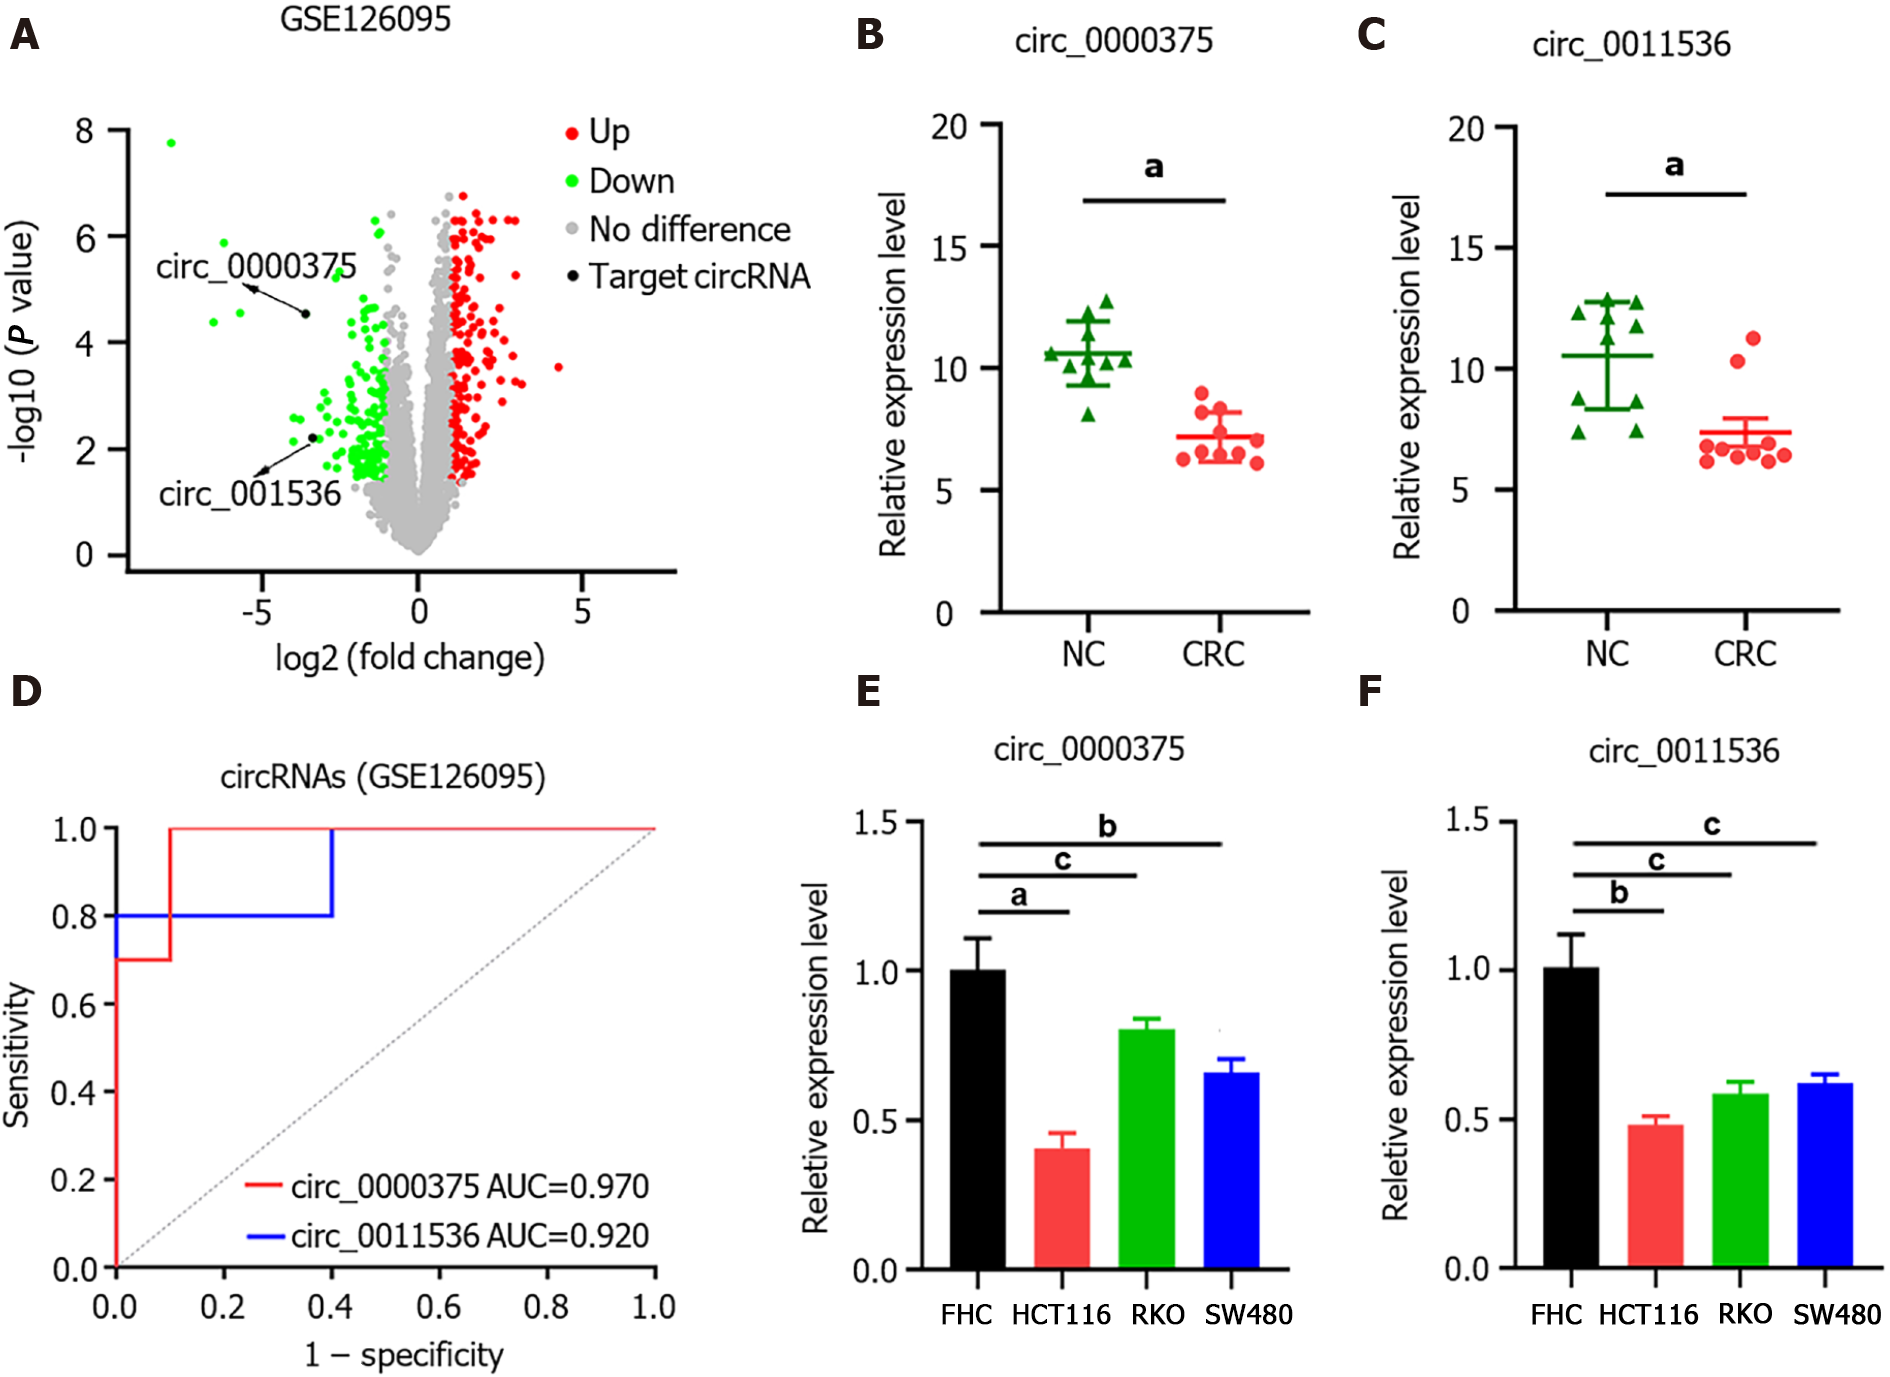
Figure 1 Expression profiles of circular ribonucleic acids in colorectal cancer tissues from GSE126095 datasets and in cell lines.
A: Volcano plot of circular ribonucleic acids expression levels; B: The expression of circ_0000375 in colorectal cancer (CRC) tissues and negative control tissues; C: The expression of circ_0011536 in CRC tissues and negative control tissues; D: Receiver operating characteristic curves to evaluate the diagnostic value of circ_0000375 and circ_0011536 by assessing the area under the curve; E: The relative expression levels of circ_0000375 in a normal colon cell line (FHC) and CRC cell lines (HCT116, RKO and SW480); F: The relative expression levels of circ_0011536 in a normal colon cell line (FHC) and CRC cell lines (HCT116, RKO and SW480). aP < 0.001; bP < 0.01; cP < 0.05. NC: Negative control; AUC: Area under the curve; CRC: Colorectal cancer.
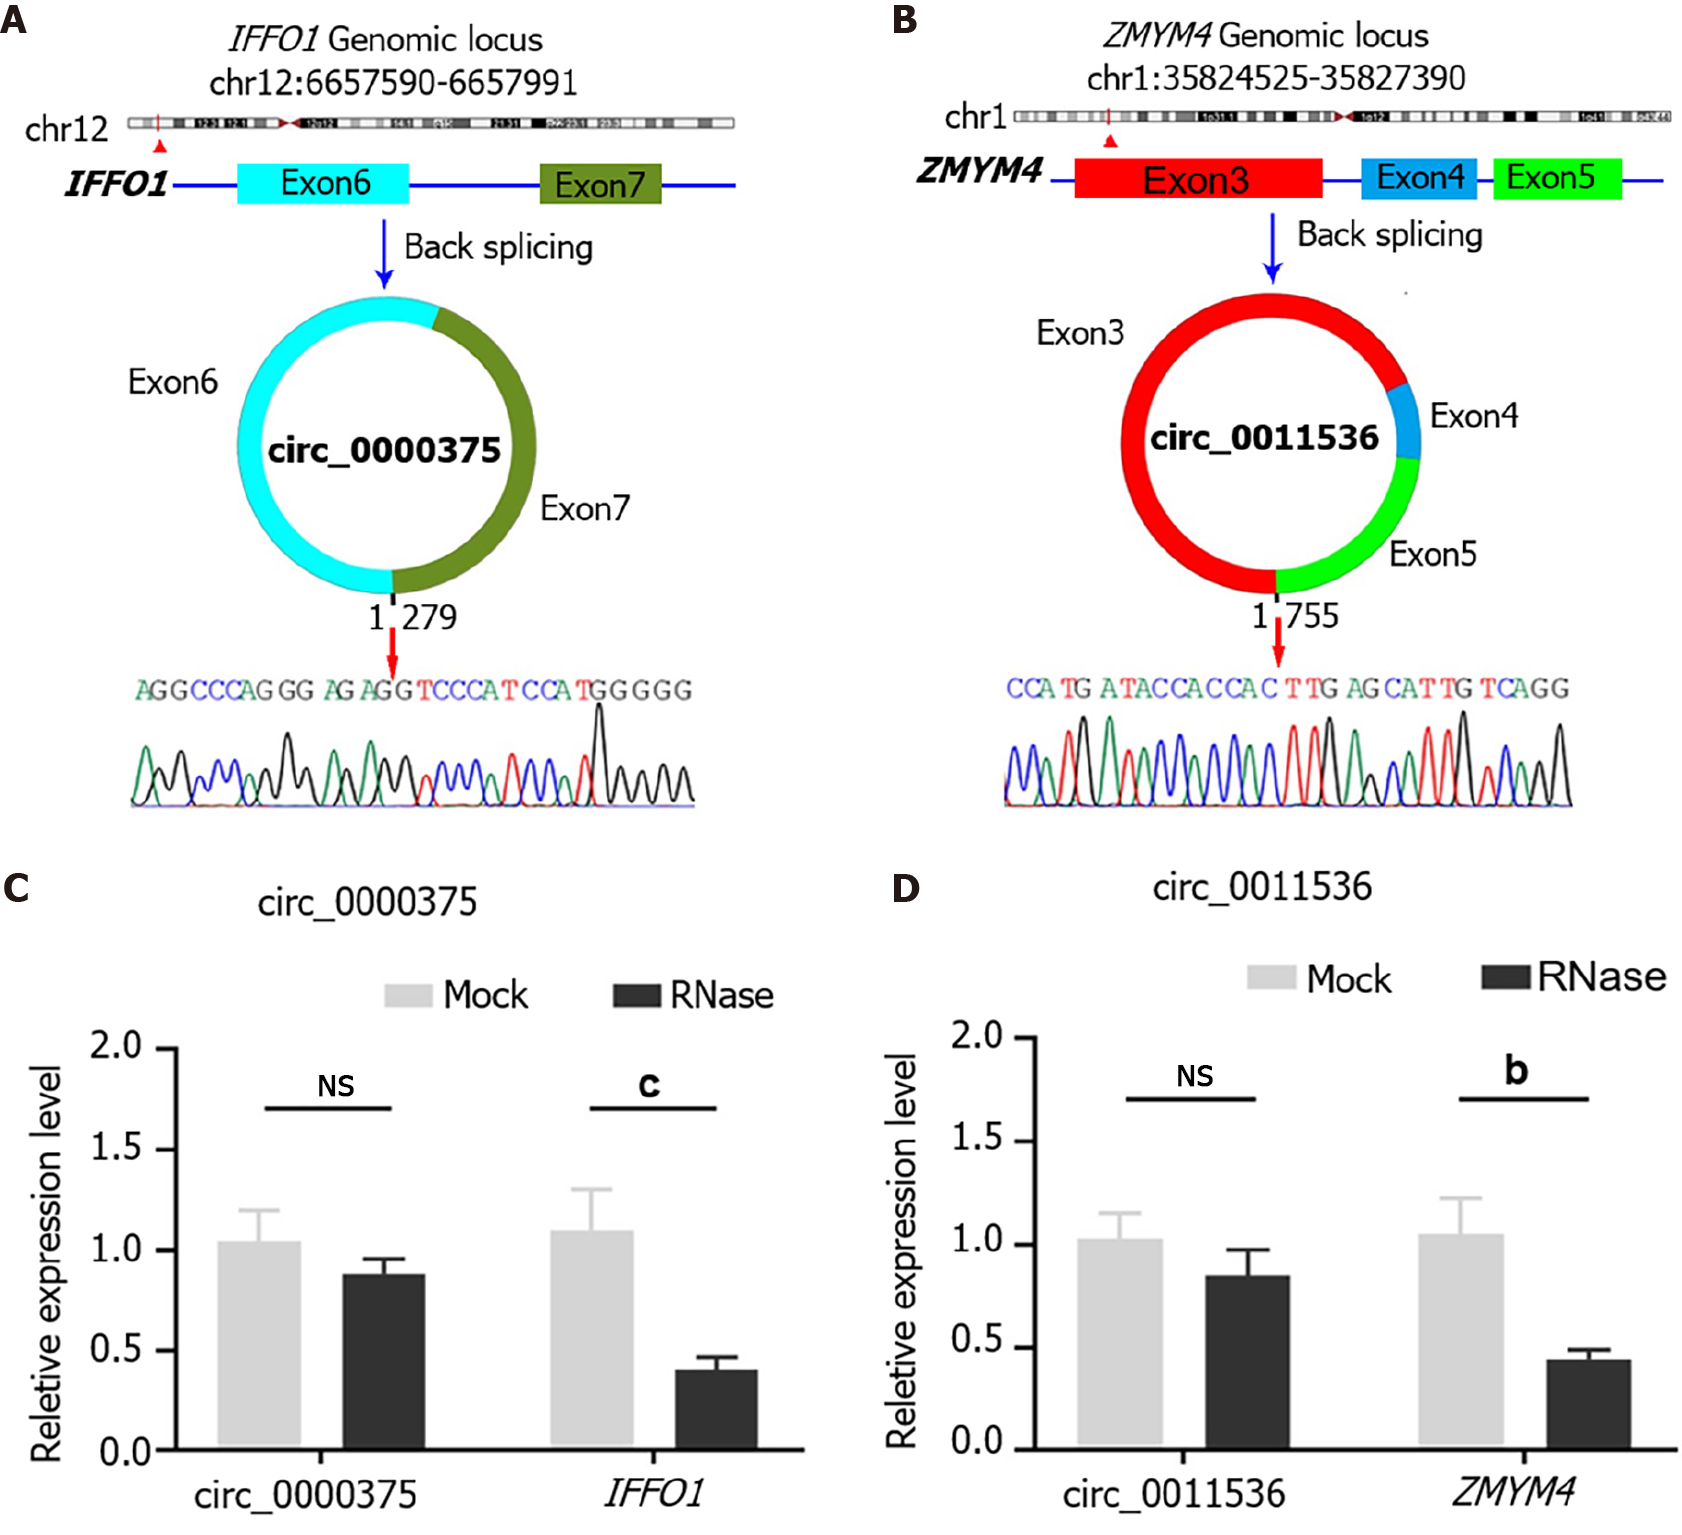
Figure 2 Characteristics of circ_0000375 and circ_0011536 in colorectal cancer tissues.
A: Structures and back-splicing sequences of circ_0000375; B: Structures and back-splicing sequences of circ_0011536; C: The relative expression levels of circ_0000375 and the corresponding linear mRNA IFFO1 in colorectal cancer tissues treated with RNase R; D: The relative expression levels of circ_0011536 and ZMYM4 treated with RNase R. bP < 0.01; cP < 0.05. NS: Not significant.
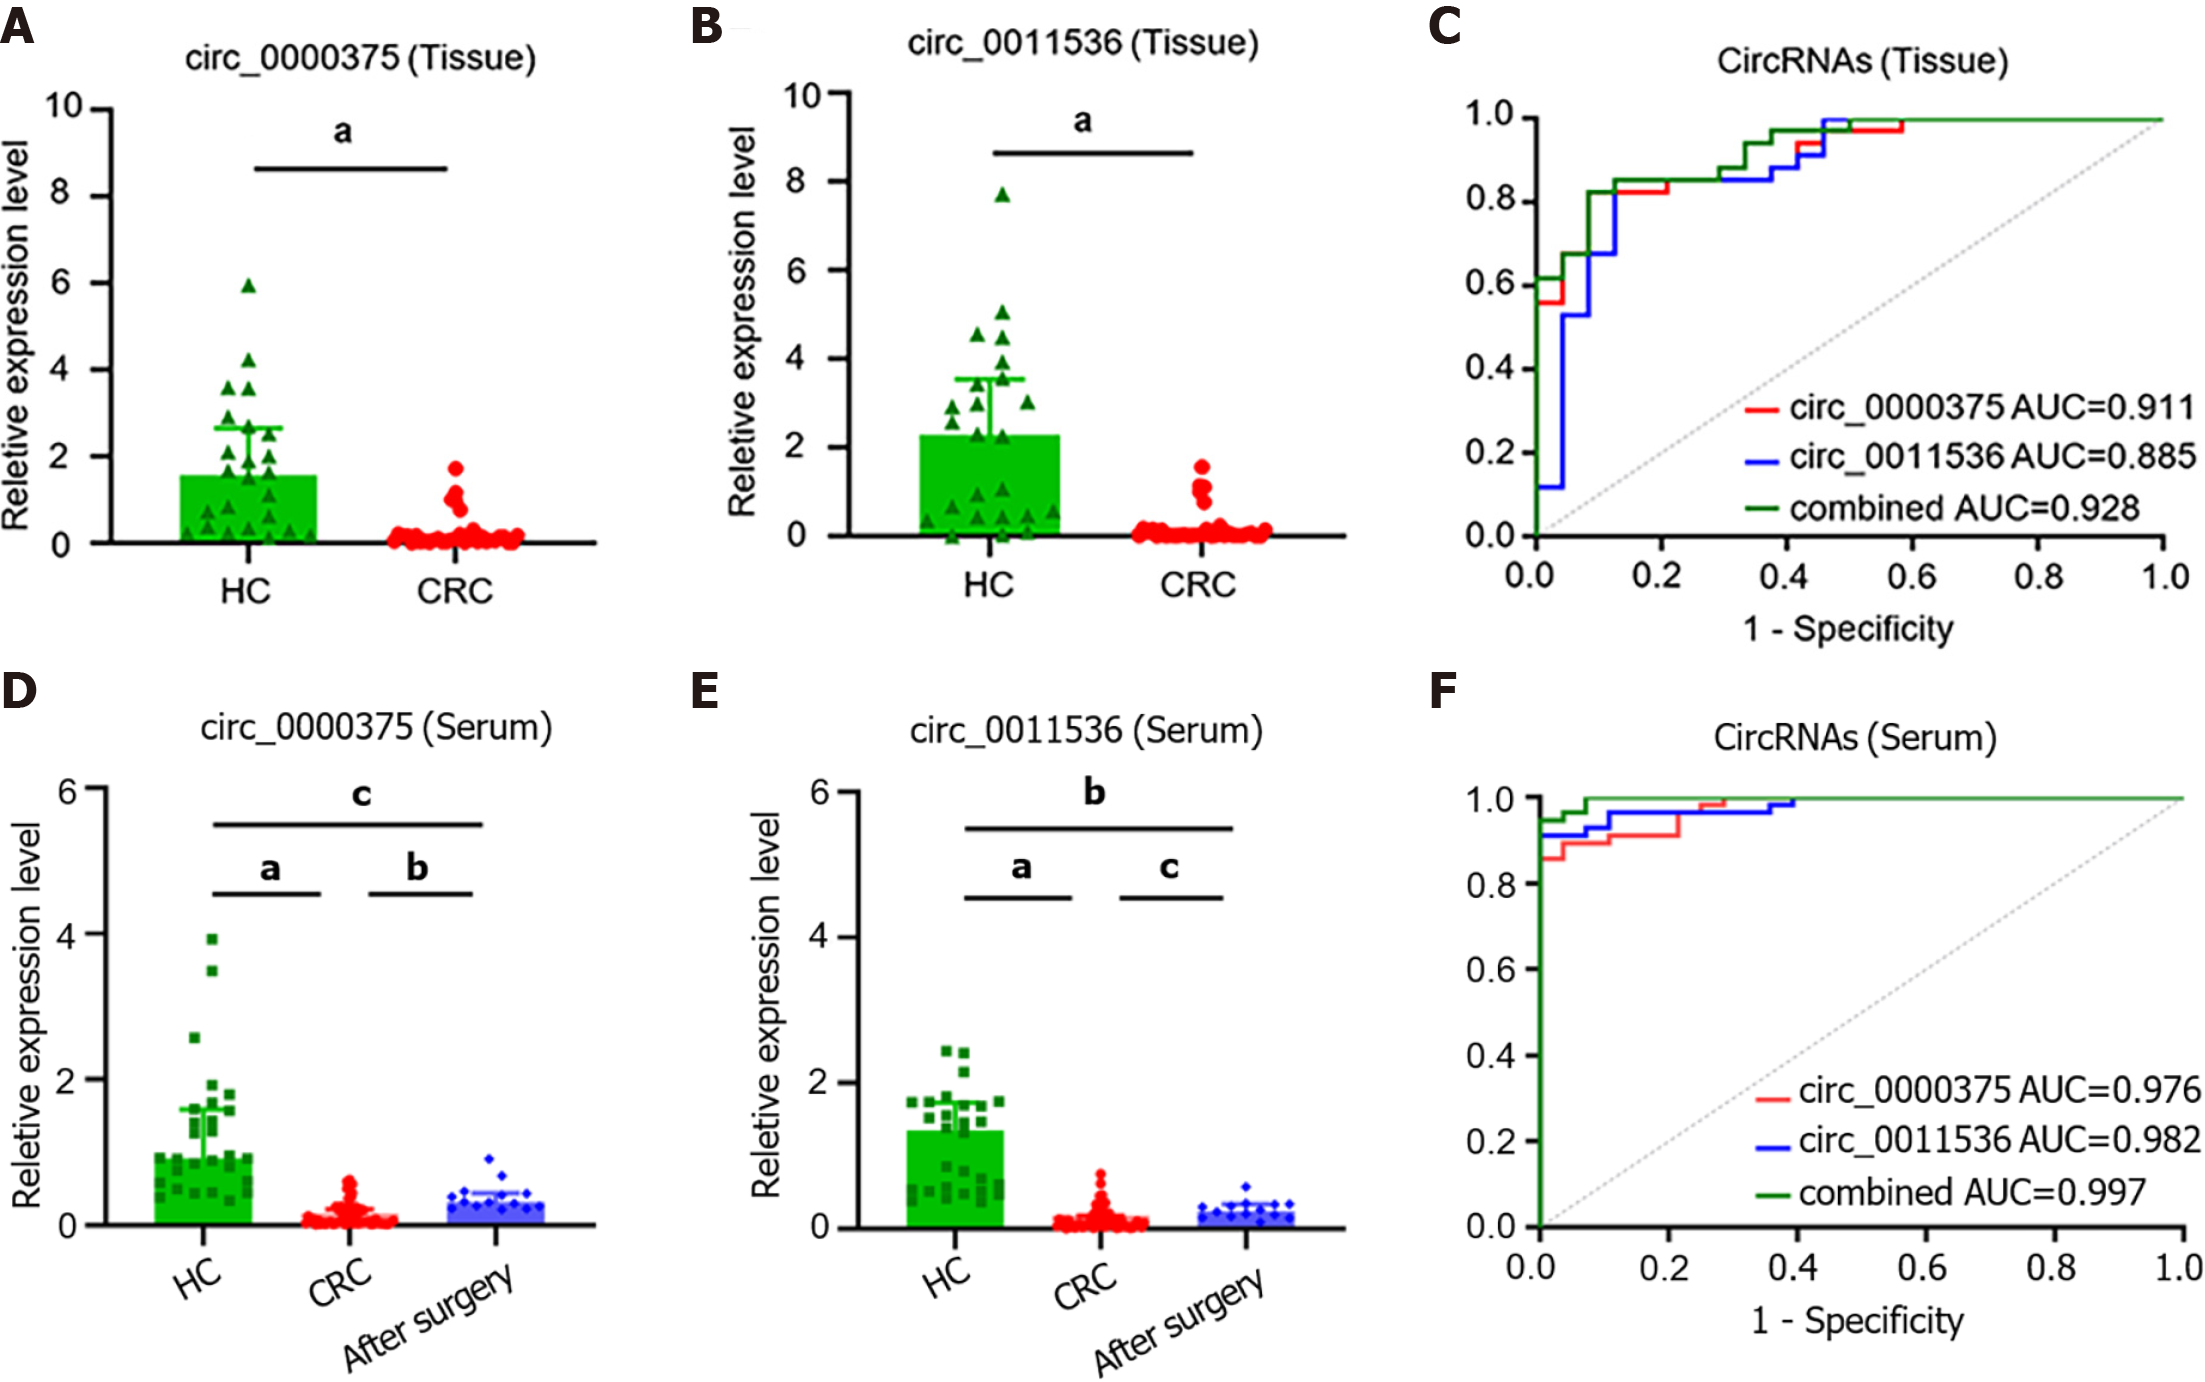
Figure 3 Circ_0000375 and circ_0011536 were downregulated in colorectal cancer tissue and serum samples.
A: The expression levels of circ_0000375 in healthy control (HC) and colorectal cancer (CRC) tissue samples; B: The expression levels of circ_0011536 in HC and CRC tissue samples; C: Receiver operating characteristic curves for circ_0000375, circ_0011536 and combined circular ribonucleic acids in CRC tissues with the area under the curve calculated; D: The expression levels of circ_0000375 in serum samples of HC, preoperative CRC and CRC after surgery; E: The expression levels of circ_0011536 in serum samples of HC, preoperative CRC and CRC after surgery; F: Receiver operating characteristic curves for Circular ribonucleic acids in CRC serum samples. aP < 0.001; bP < 0.01; cP < 0.05. CRC: Colorectal cancer; HC: Healthy control; AUC: Area under the curve; ROC: Receiver operating characteristic.
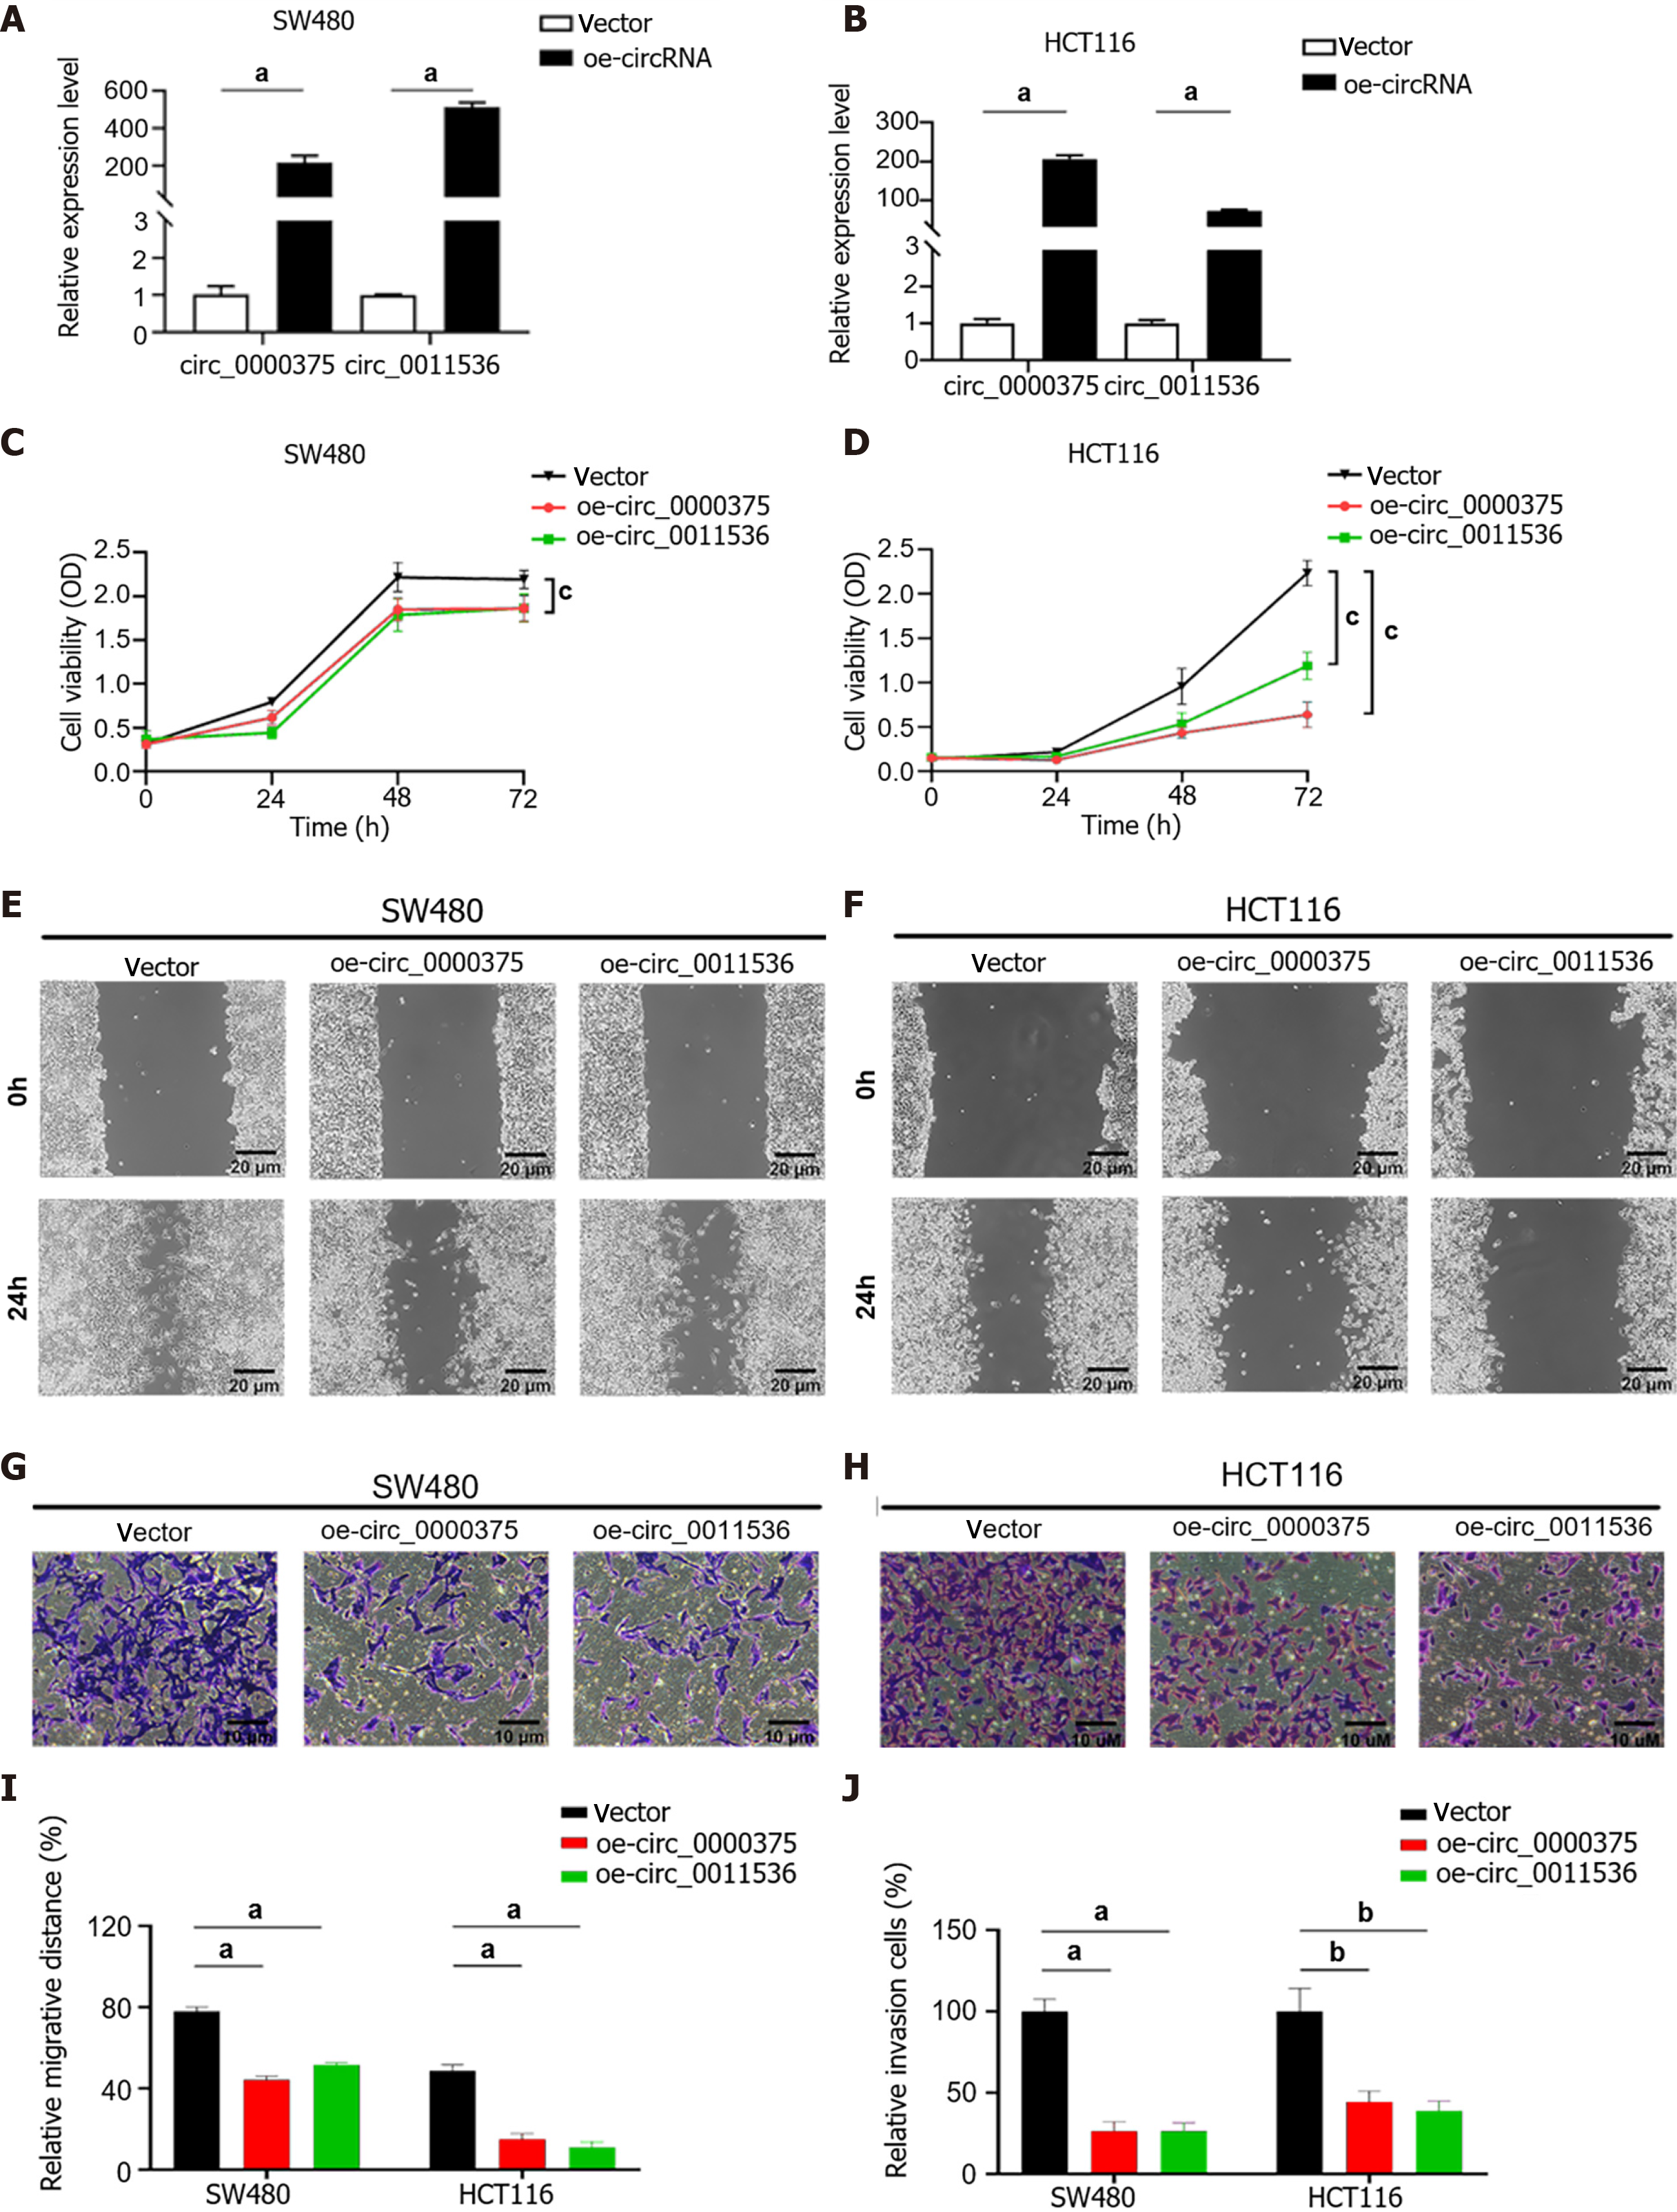
Figure 4 Overexpression of circ_0000375 and circ_0011536 suppresses proliferation, migration and invasion in colorectal cancer.
A: The relative expression levels of circ_0000375 and circ_0011536 in SW480 cells transfected with overexpression plasmids; B: The relative expression levels of circ_0000375 and circ_0011536 in HCT116 cells transfected with overexpression plasmids; C: Cell counting kit-8 (CCK-8) assays were performed to determine the ability of proliferation in SW480 cells transfected with oe-circ_0000375 or oe-circ_0011536; D: CCK-8 assays were performed to determine the ability of proliferation in HCT116 cells transfected with oe-circ_0000375 or oe-circ_0011536; E: Wound healing assays were conducted to assess the cell migrative capability of SW480; F: Wound healing assays were conducted to assess the cell migrative capability of HCT116 cells; G: Transwell invasion assays were utilized to reveal the invasive ability of SW480; H: Transwell invasion assays were utilized to reveal the invasive ability of HCT116 cells; I: Results of wound healing assays of SW480 and HCT116 cell lines; J: Results of Transwell invasion assays of SW480 and HCT116 cell lines. aP < 0.001; bP < 0.01; cP < 0.05.
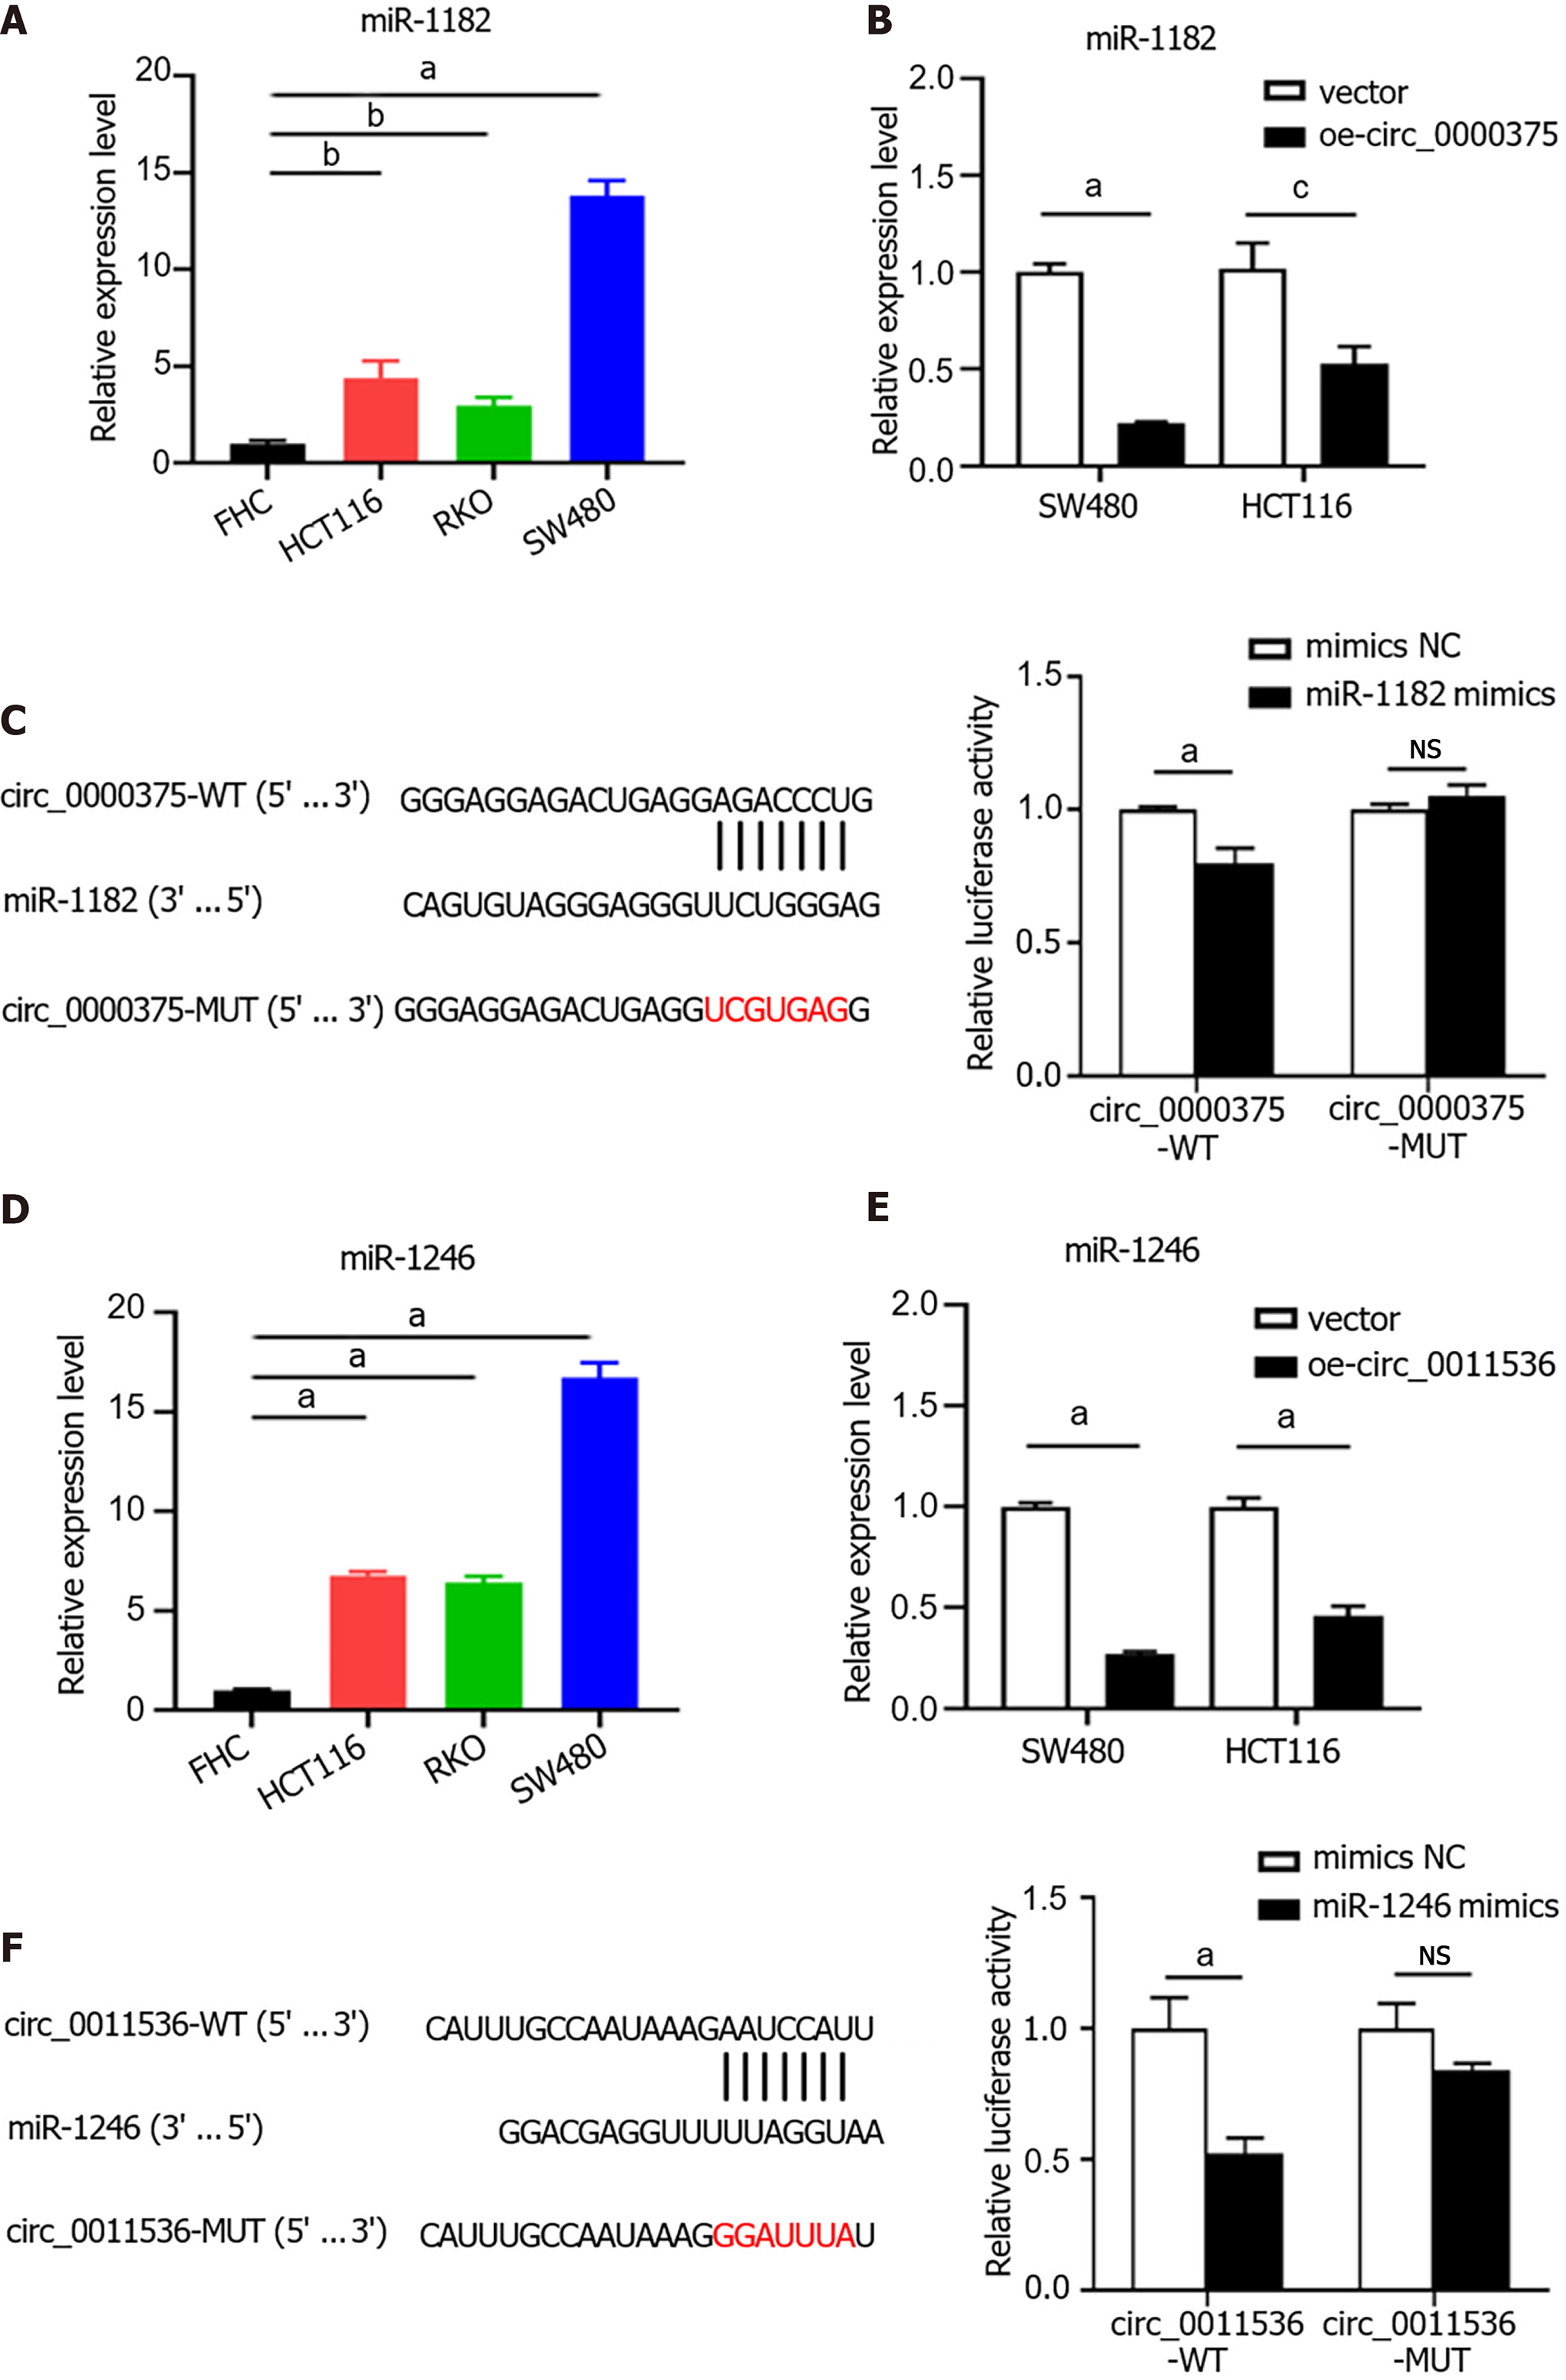
Figure 5 Circ_0000375 and circ_0011536 serve as sponges of miR-1182 and miR-1246 in colorectal cancer.
A: The expression level of miR-1182 in a normal colon cell line (FHC) and colorectal cancer cell lines (HCT116, RKO and SW480); B: The relative expression level of miR-1182 in SW480 and HCT116 cells transfected with a circ_0000375 overexpression vector; C: Relative luciferase activities were detected in HEK293T cells after cotransfection with circ_0000375-WT, circ_0000375-MUT, miR-1182 mimics and negative control mimics; D: The expression level of miR-1246 in colorectal cancer cell lines; E: The relative expression level of miR-1246 in SW480 and HCT116 cells transfected with oe-circ_0011536; F: Luciferase reporter assays were performed after cotransfection with circ_0011536-WT, circ_0011536-MUT, miR-1246 mimics and negative control mimics. aP < 0.001; bP < 0.01; cP < 0.05. NC: Negative control; NS: Not significant.
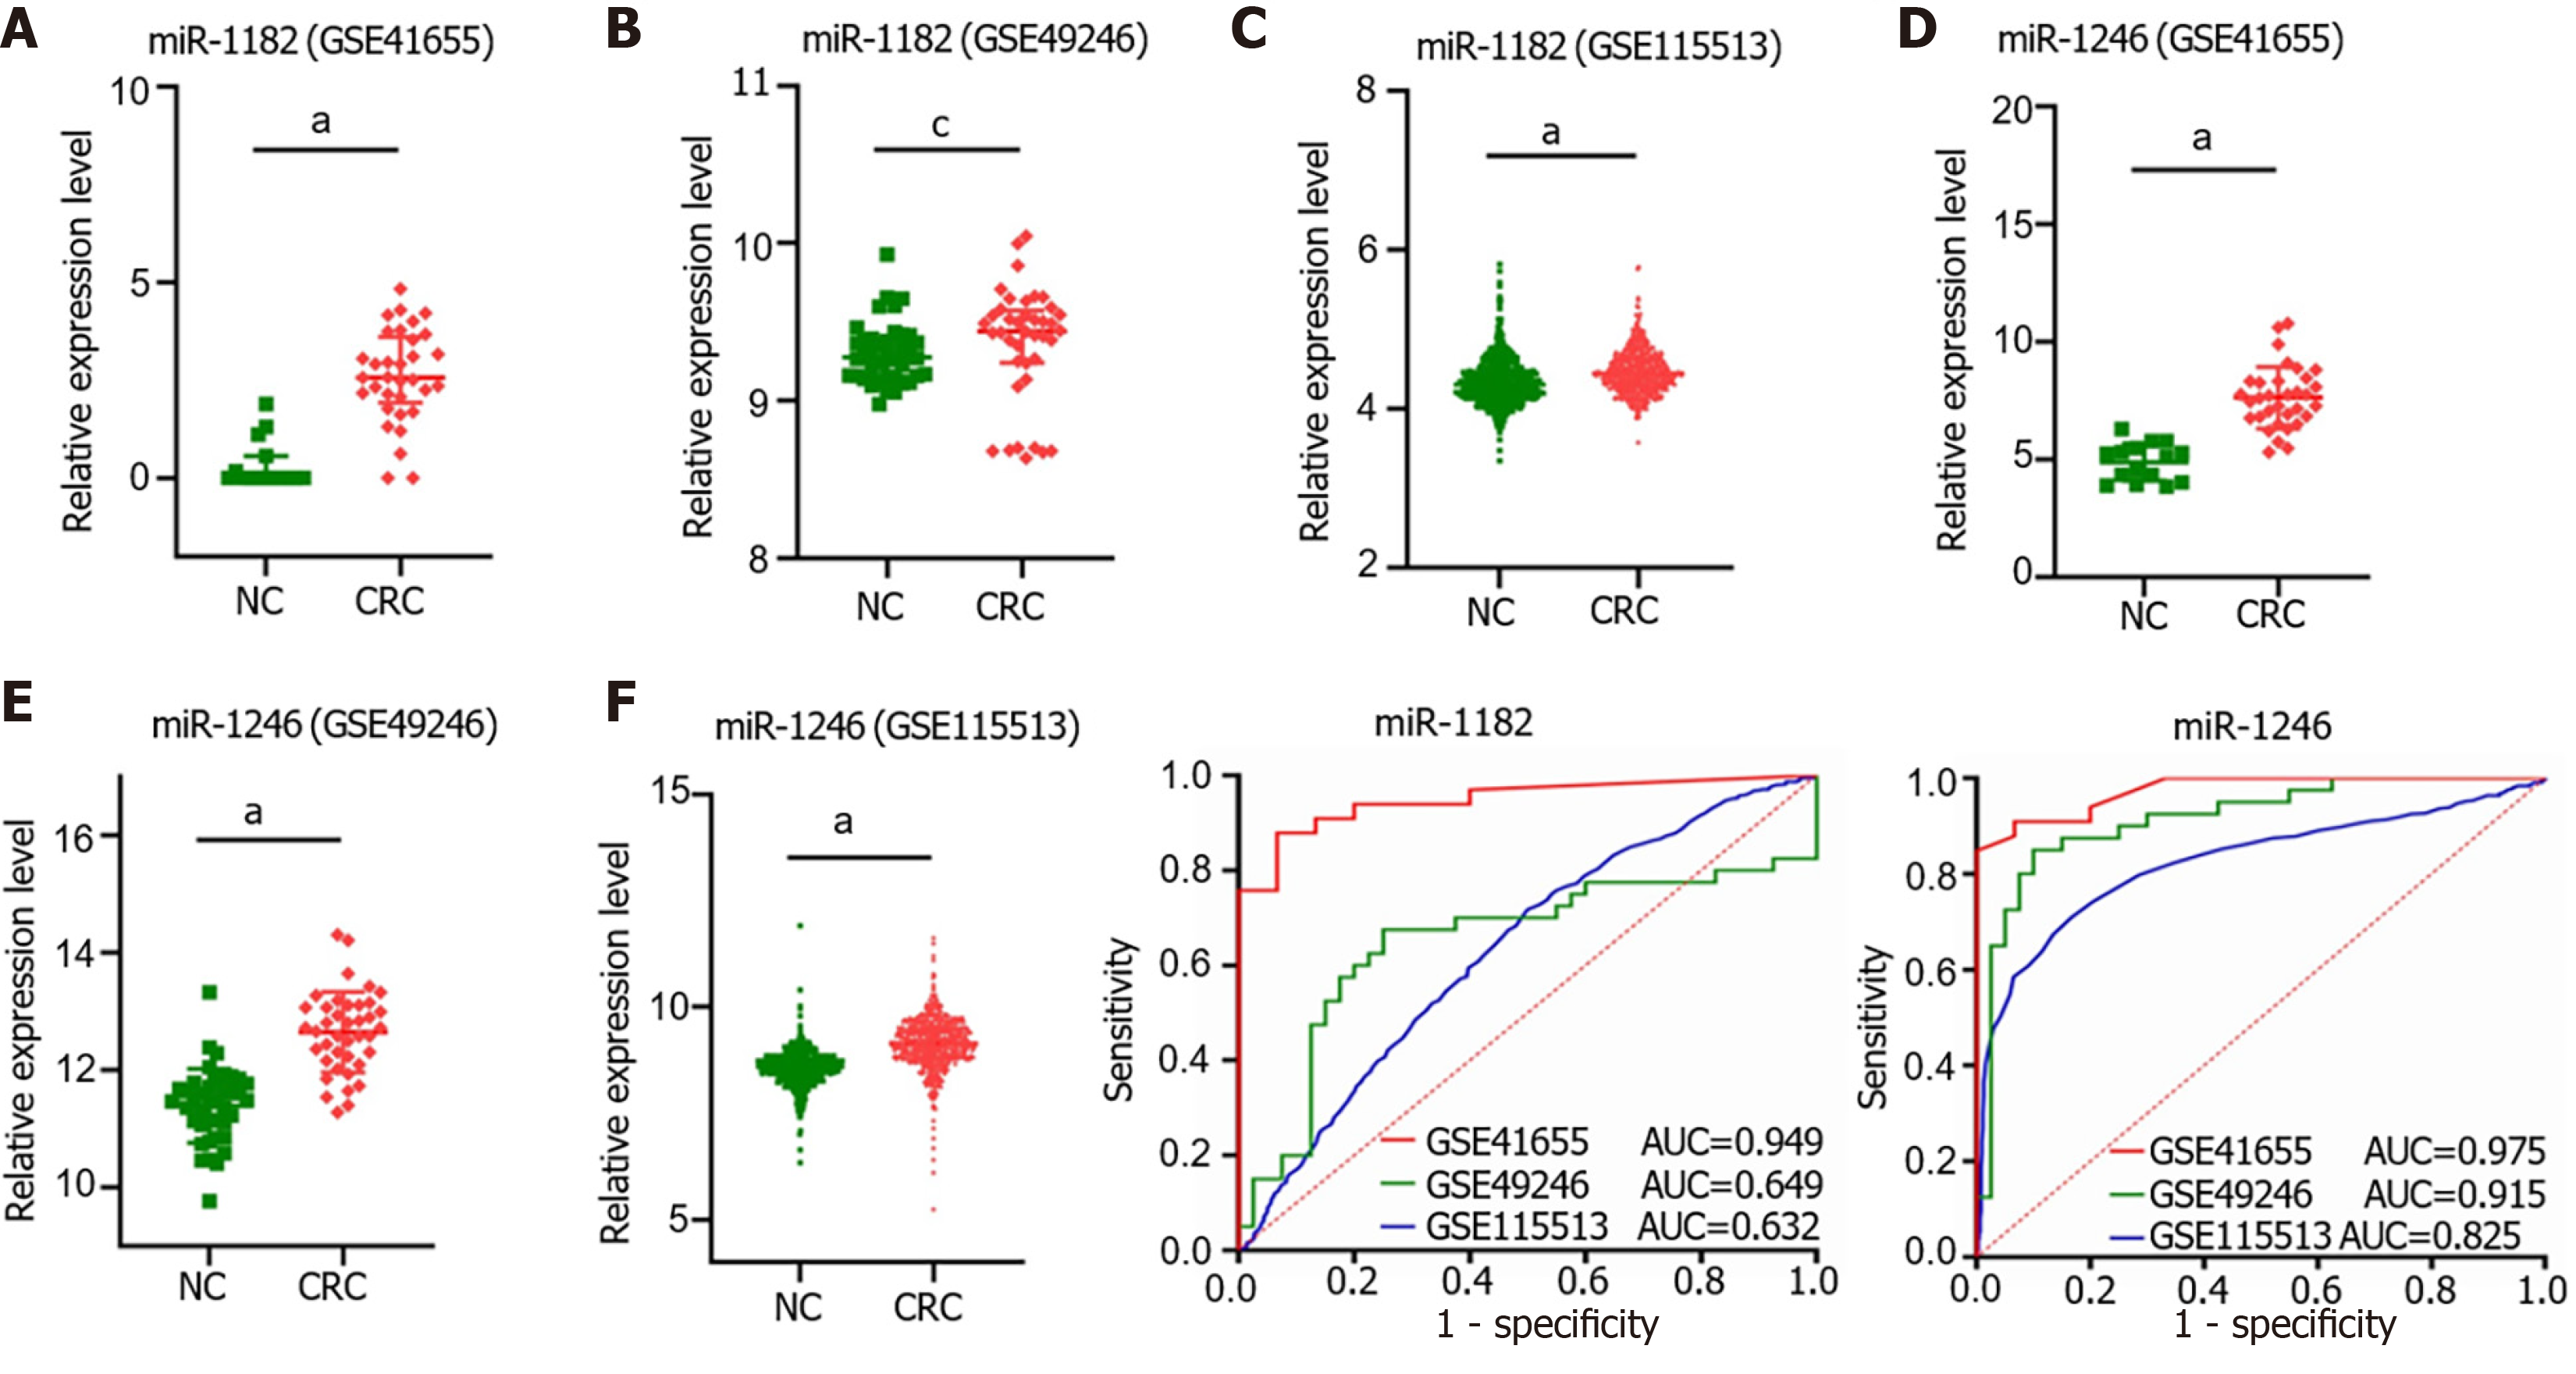
Figure 6 MiR-1182 and miR-1246 were upregulated in colorectal cancer tissues in Gene Expression Omnibus datasets.
A: The expression level of miR-1182 in GSE41655; B: The expression level of miR-1182 in GSE49246; C: The expression level of miR-1182 in GSE115513; D: The expression level of miR-1246 in GSE41655; E: The expression level of miR-1246 in GSE49246; F: The expression level of miR-1246 in GSE115513; G: The diagnostic value of miR-1182 in Gene Expression Omnibus (GEO) datasets was evaluated by the area under the curve; H: The diagnostic value of miR-1246 in GEO datasets was evaluated by the area under the curve. aP < 0.001; bP < 0.01; cP < 0.05. CRC: Colorectal cancer; NC: Negative control; AUC: Area under the curve.
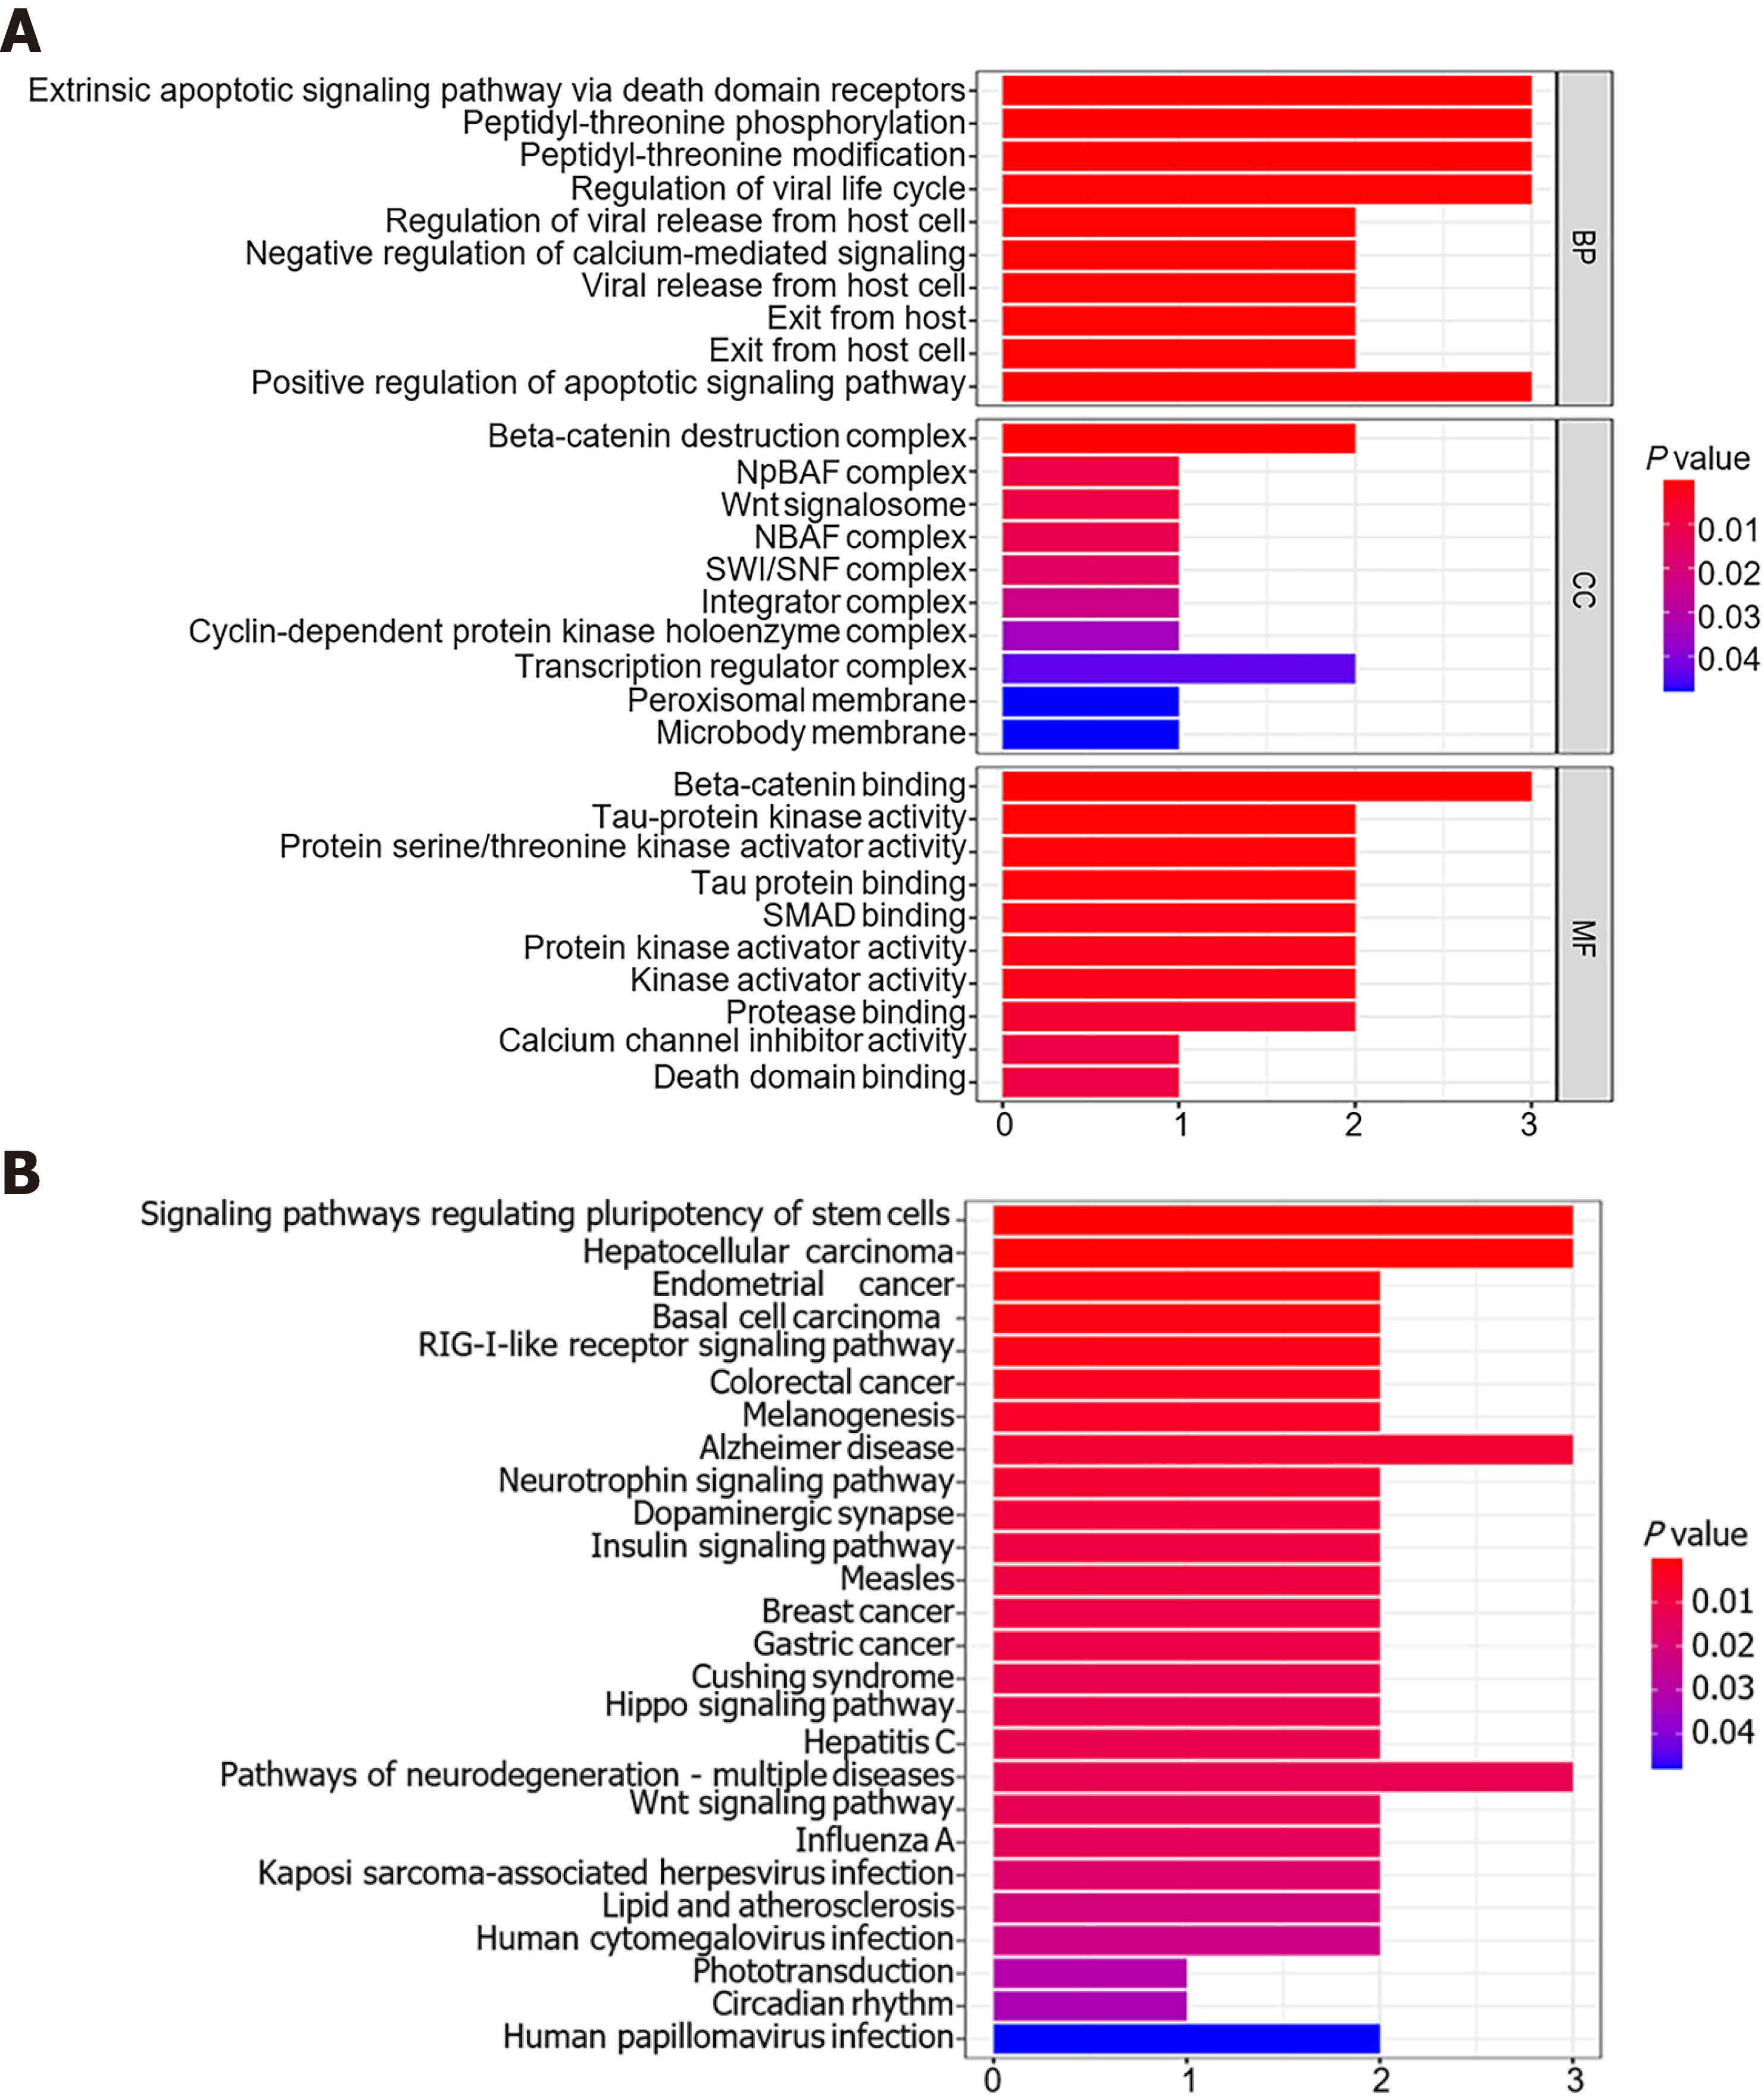
Figure 7 Enrichment analyses based on downstream genes of miR-1182 and miR-1246.
A: Gene Ontology analysis of biological processes, cellular components, and molecular functions; B: Kyoto Encyclopedia of Genes and Genomes pathway analysis.
- Citation: Yin TF, Du SY, Zhao DY, Sun XZ, Zhou YC, Wang QQ, Zhou GYJ, Yao SK. Identification of circ_0000375 and circ_0011536 as novel diagnostic biomarkers of colorectal cancer. World J Clin Cases 2022; 10(11): 3352-3368
- URL: https://www.wjgnet.com/2307-8960/full/v10/i11/3352.htm
- DOI: https://dx.doi.org/10.12998/wjcc.v10.i11.3352


