©The Author(s) 2025.
World J Virol. Jun 25, 2025; 14(2): 95826
Published online Jun 25, 2025. doi: 10.5501/wjv.v14.i2.95826
Published online Jun 25, 2025. doi: 10.5501/wjv.v14.i2.95826
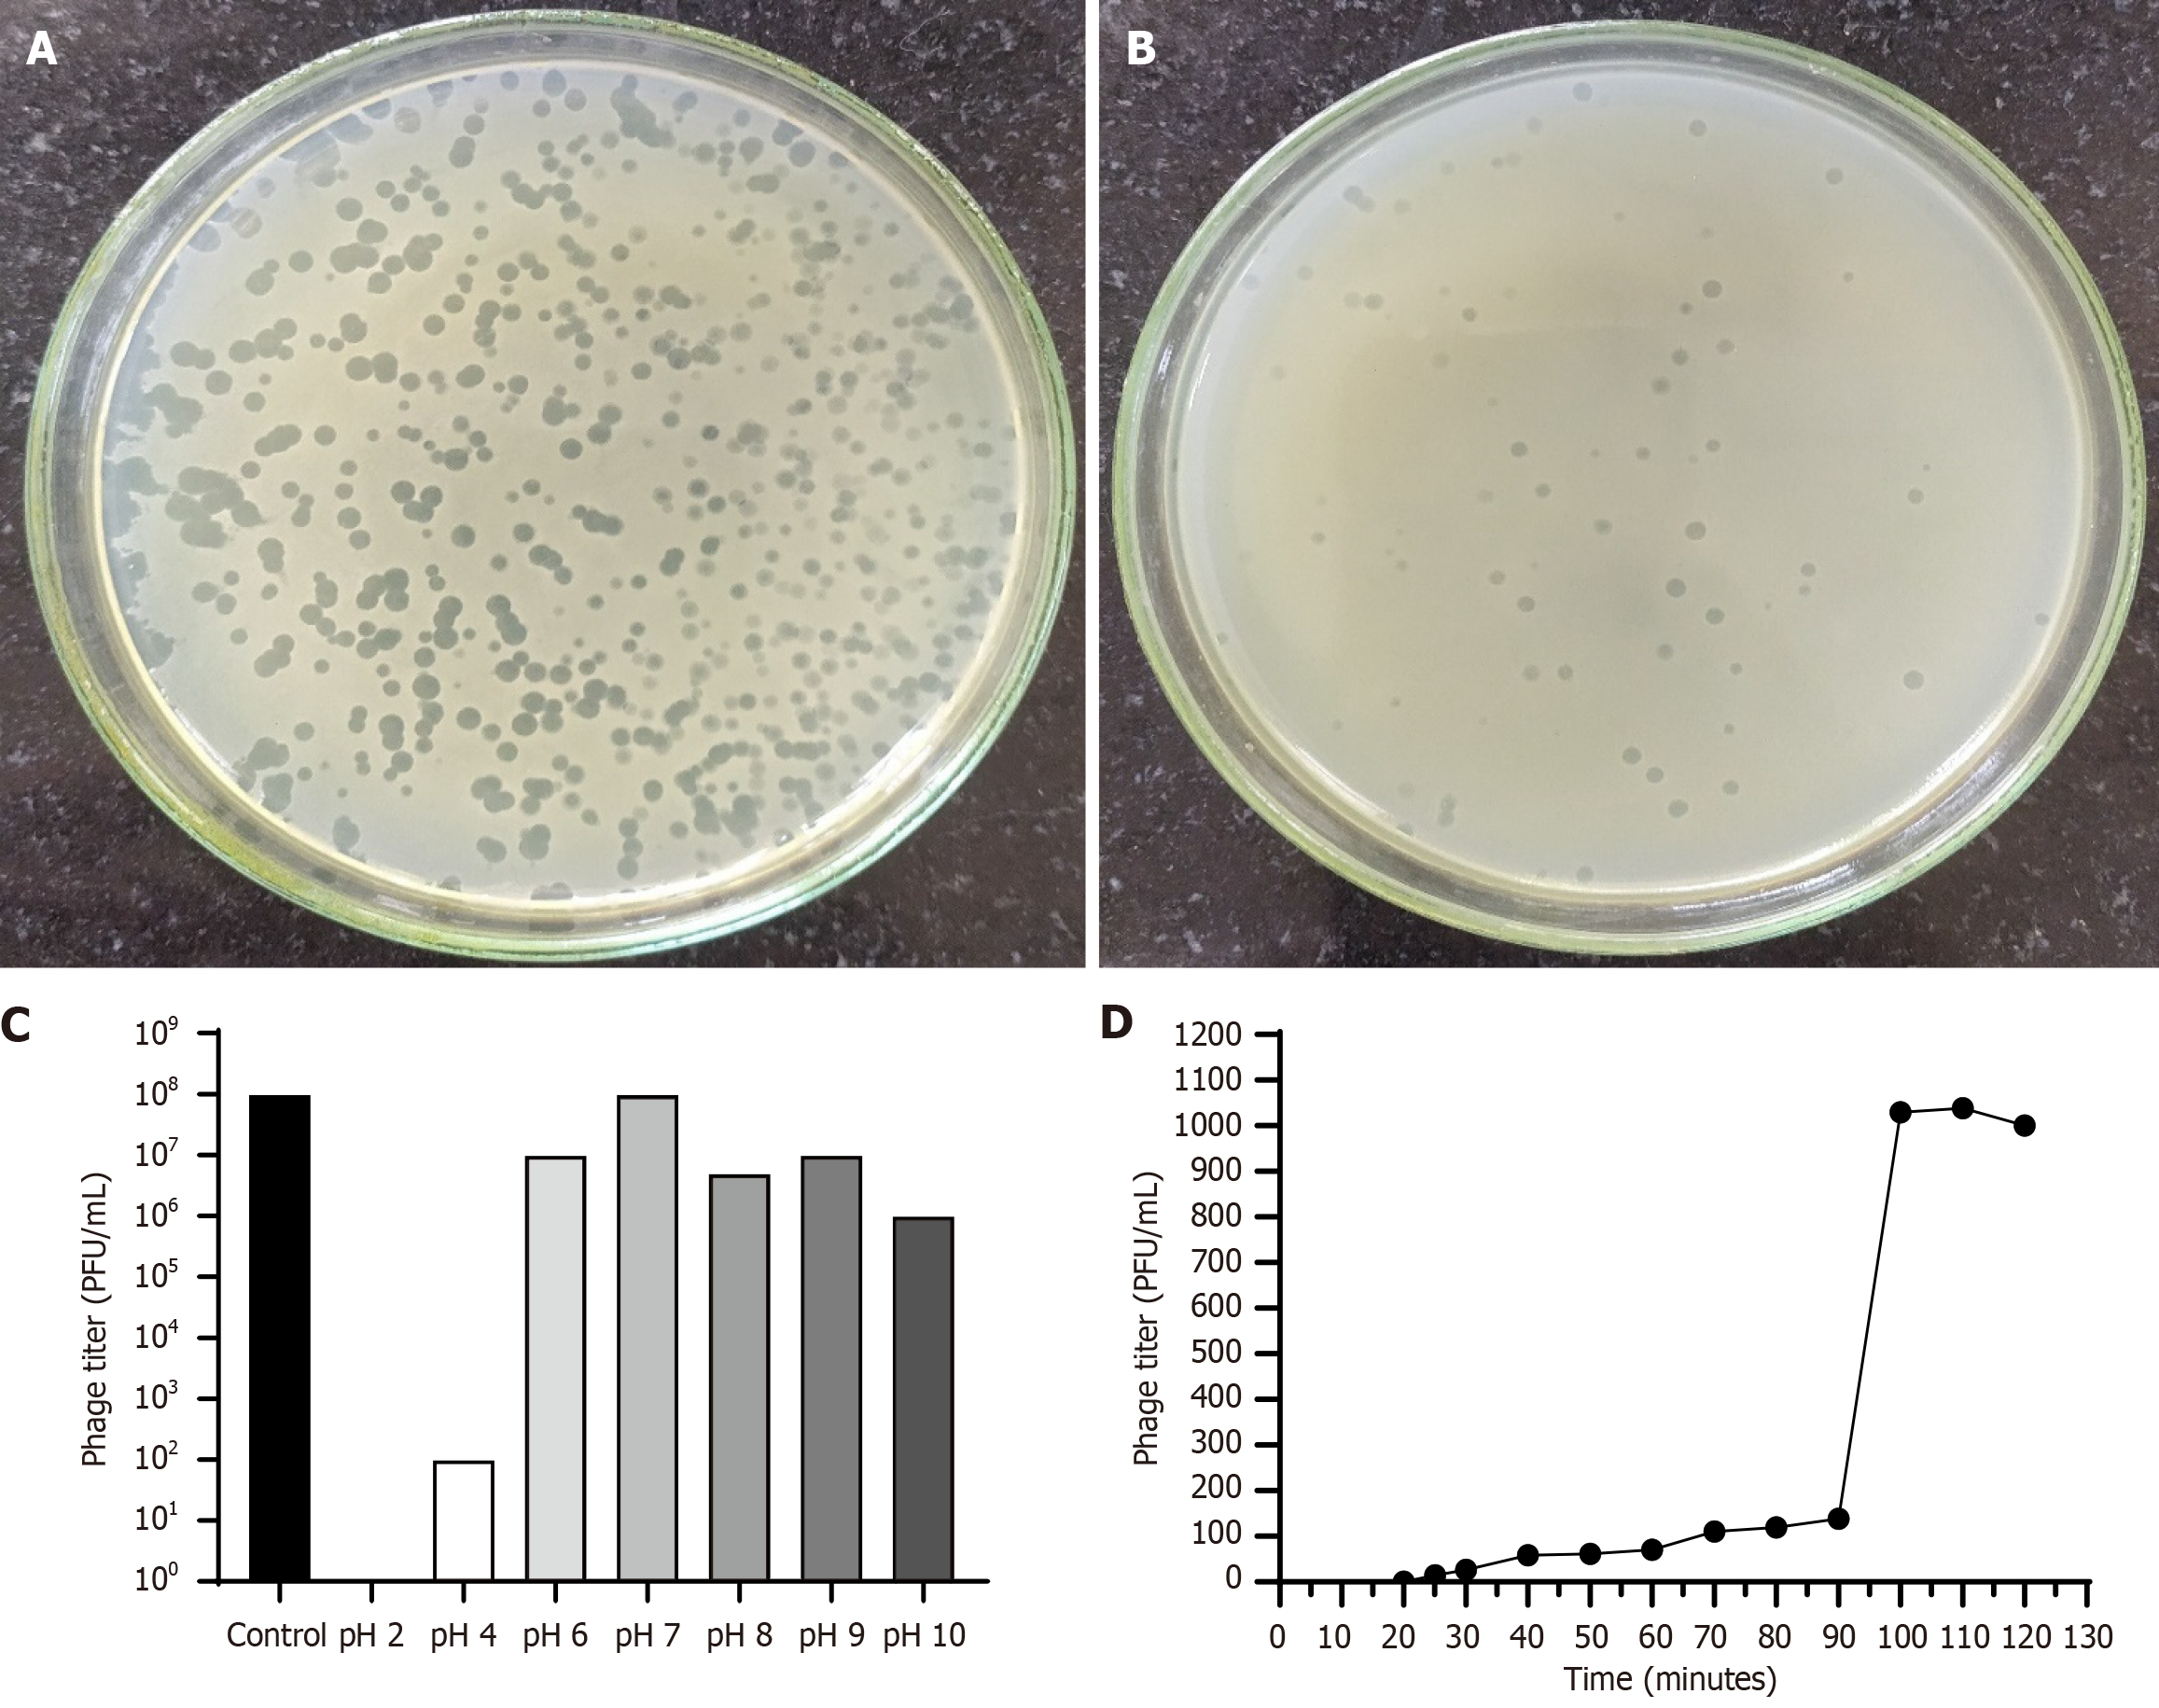
Figure 1 Phage isolation and characterization.
A and B: Double agar overlay plate showing plaques on Enterococcus faecalis; C: pH tolerance; D: One-step growth curve.
Figure 2 Time-kill assays of phage-antibiotic synergy on the planktonic form of Enterococcus faecalis.
A: Bacterial colony counts; B: Phage titre in time-kill assays.
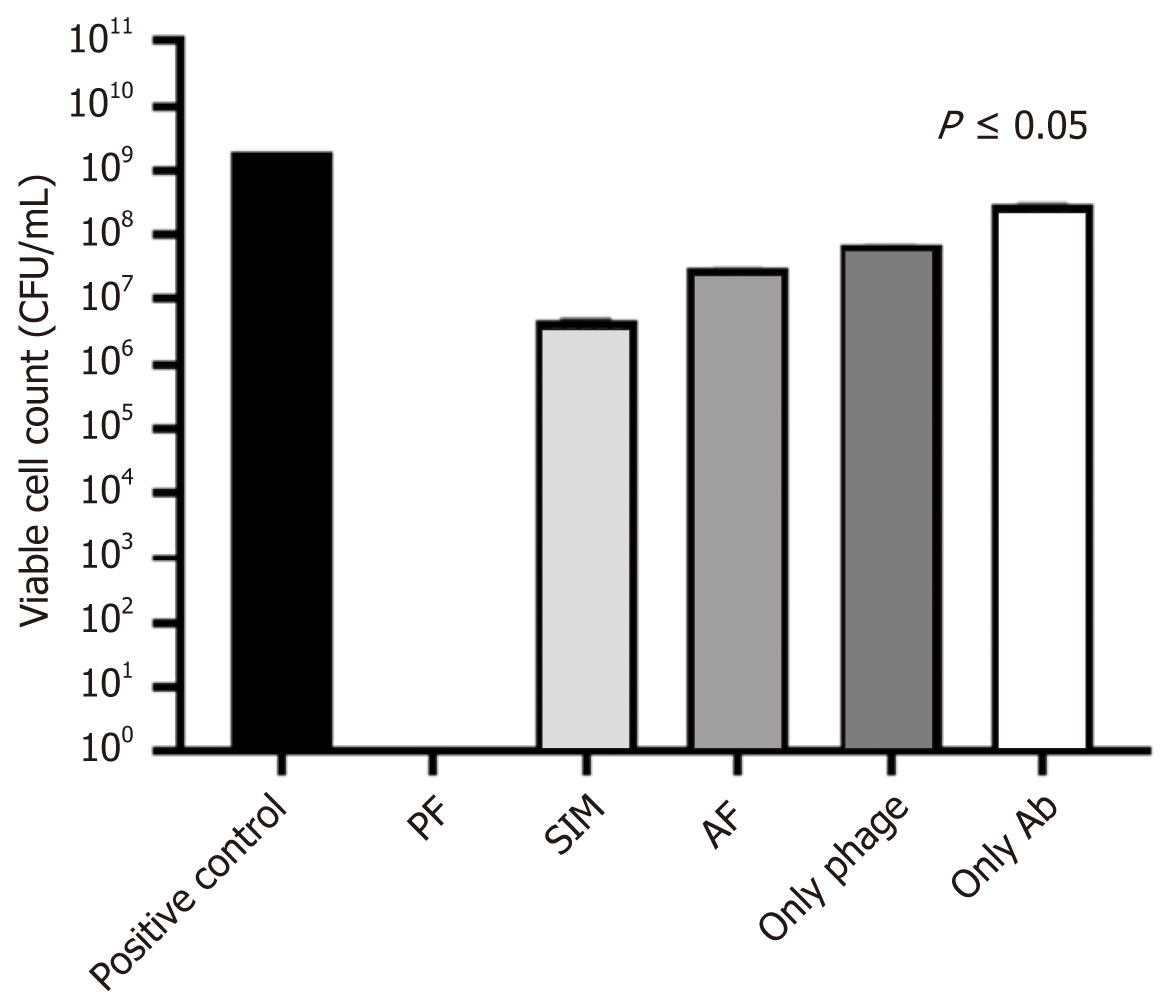
Figure 3 Viable counts of planktonic Enterococcus faecalis (108 CFUs/mL) following a sequential treatment of phage (1 × 10⁸ PFUs/mL) and vancomycin (16 µg/mL).
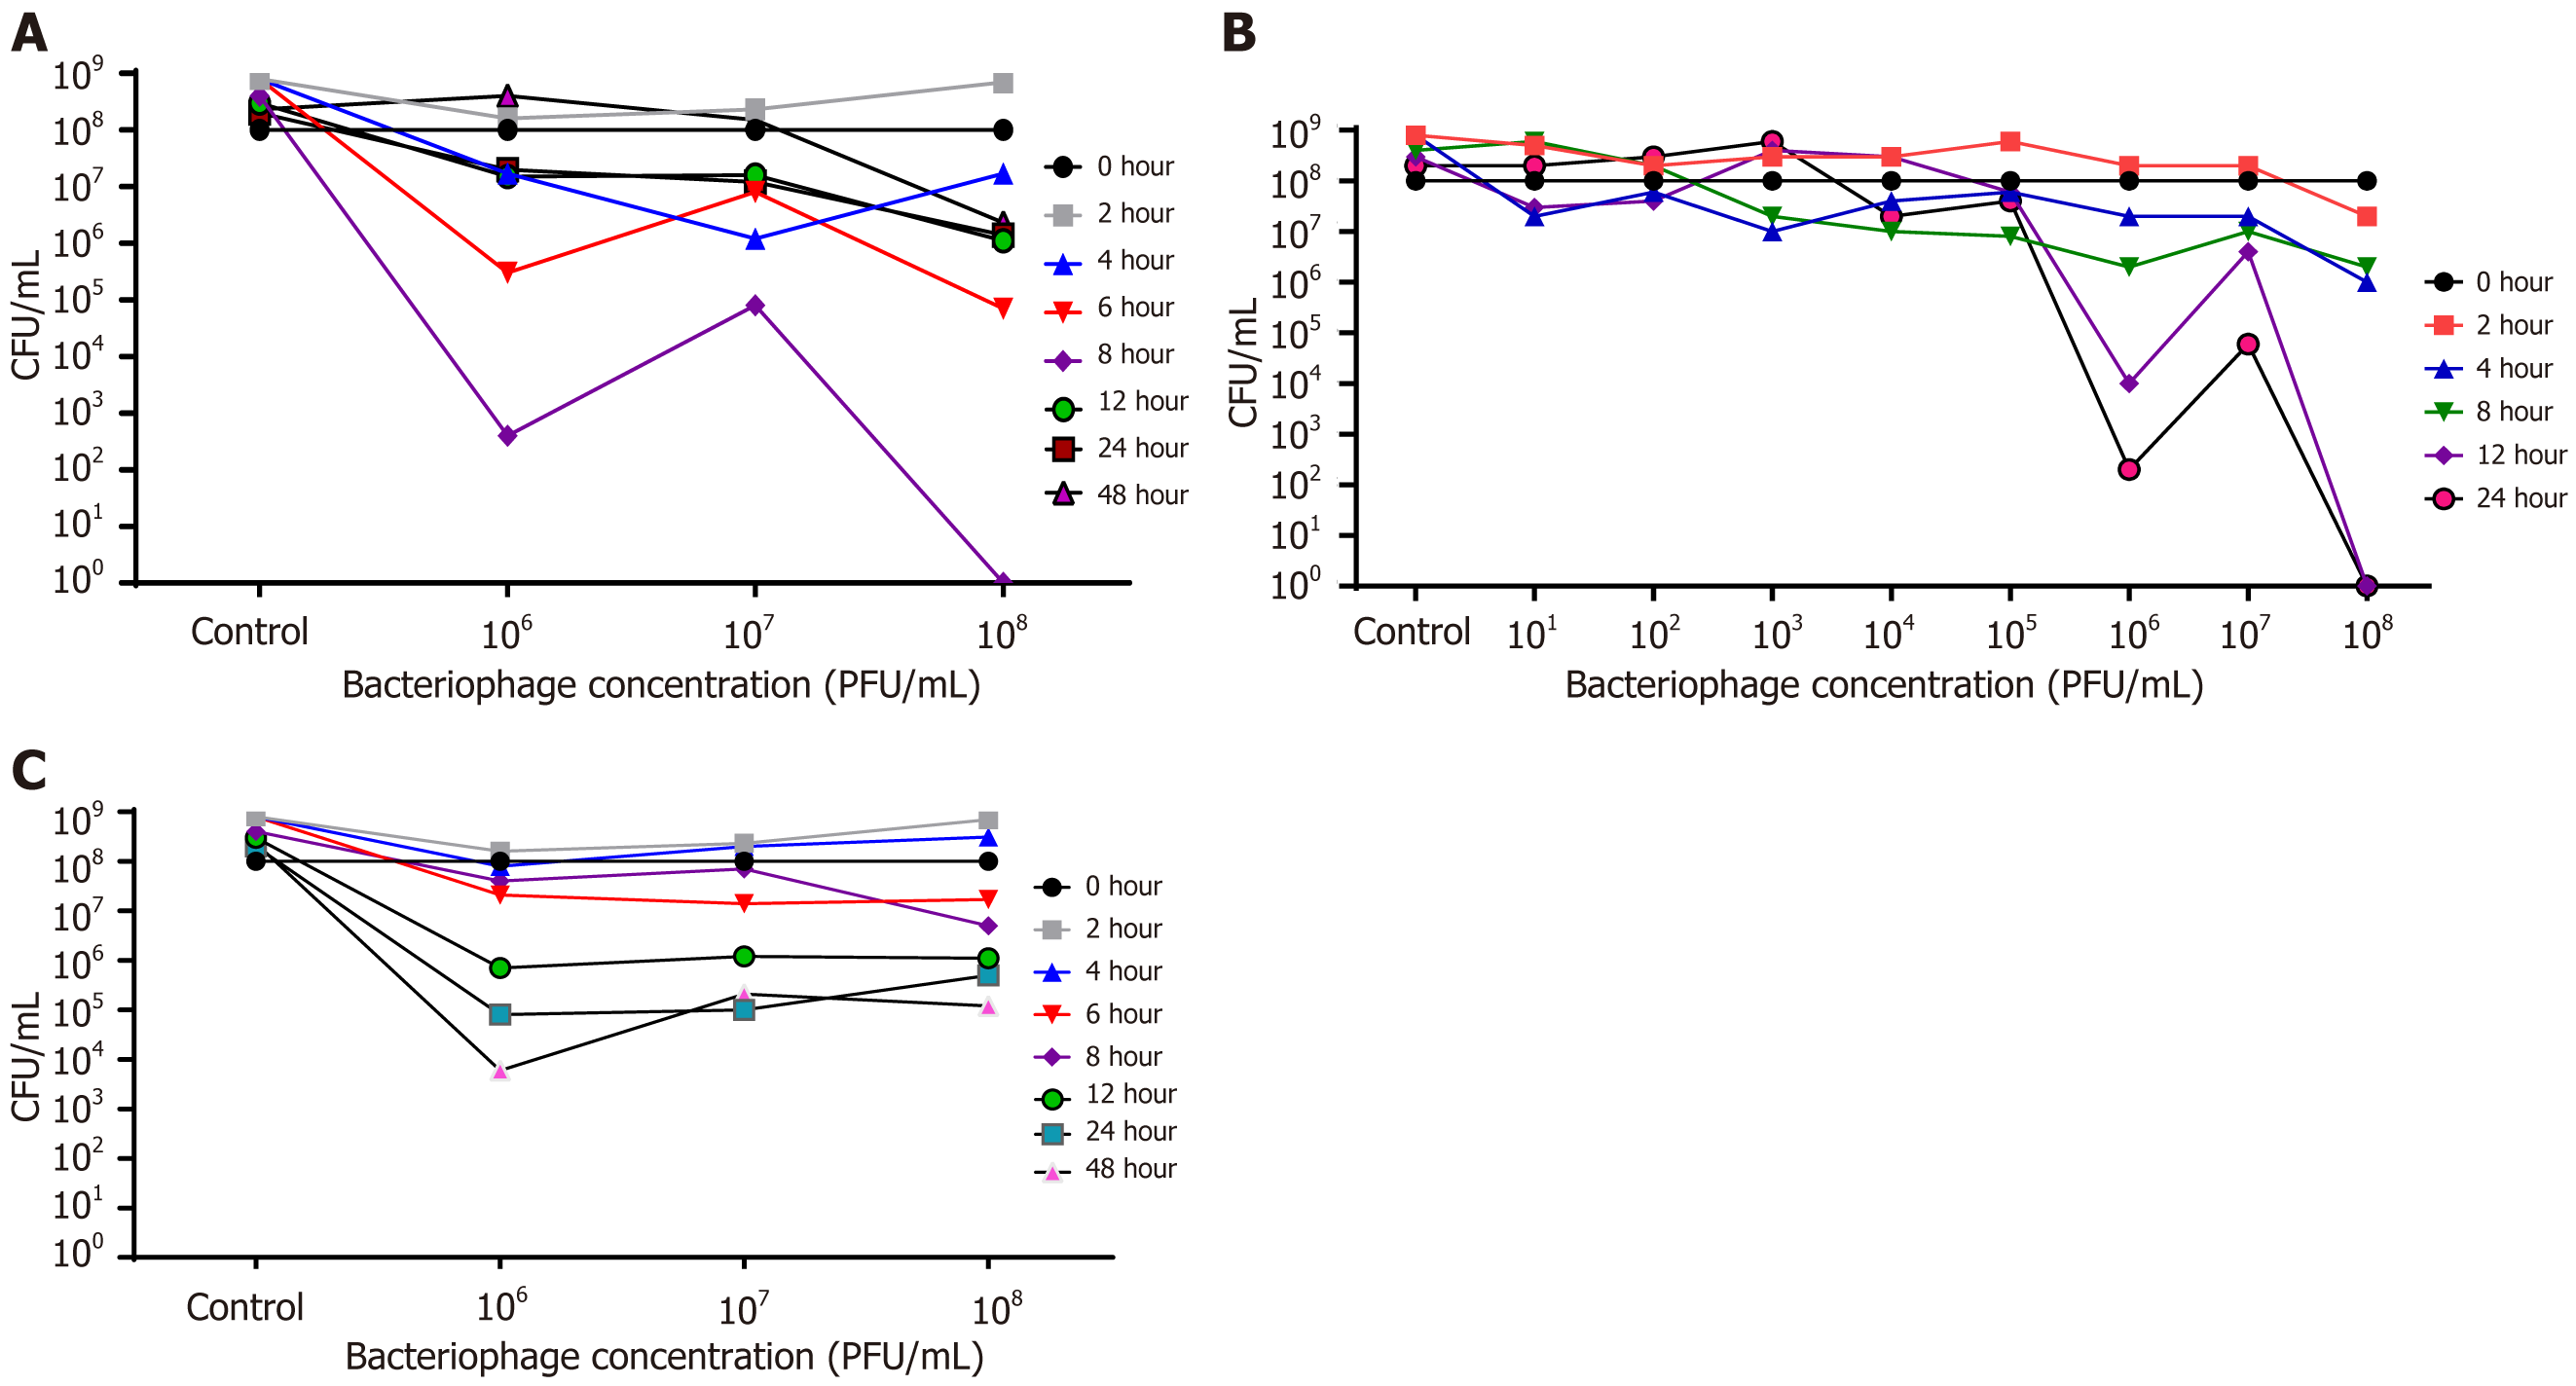
Figure 4 Optimization of concentration and timing of addition of phage.
A: Effect of timing of addition of phage on the lysis of planktonic form of Enterococcus faecalis; B: Effect of different concentrations of phage on lysis of the host bacteria when the antibiotic was added after 8 hours of phage administration; C: Effect of different concentrations of phage when added simultaneously with antibiotic.
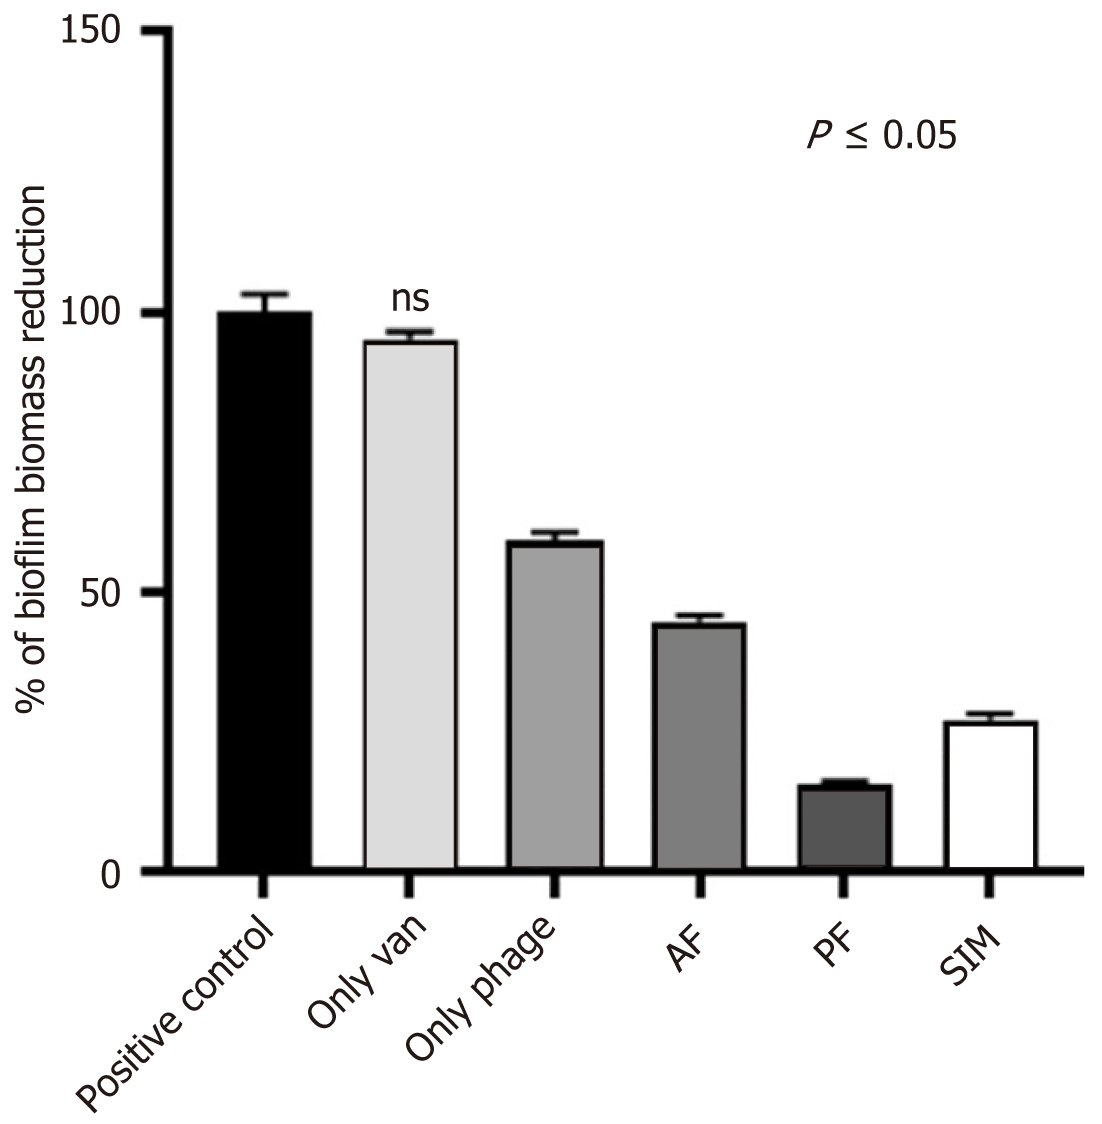
Figure 5 Percentage biomass reduction of biofilm at different settings.
AF: Antibiotic first; PF: Phage first; SIM: Simultaneously.
- Citation: Sahu M, Vishwakarma RK, Karn SL, Nath G. Synergistic efficacy of phages along with vancomycin for eradication of vancomycin-resistant Enterococcus faecalis biofilms. World J Virol 2025; 14(2): 95826
- URL: https://www.wjgnet.com/2220-3249/full/v14/i2/95826.htm
- DOI: https://dx.doi.org/10.5501/wjv.v14.i2.95826


