©The Author(s) 2025.
World J Virol. Jun 25, 2025; 14(2): 106108
Published online Jun 25, 2025. doi: 10.5501/wjv.v14.i2.106108
Published online Jun 25, 2025. doi: 10.5501/wjv.v14.i2.106108
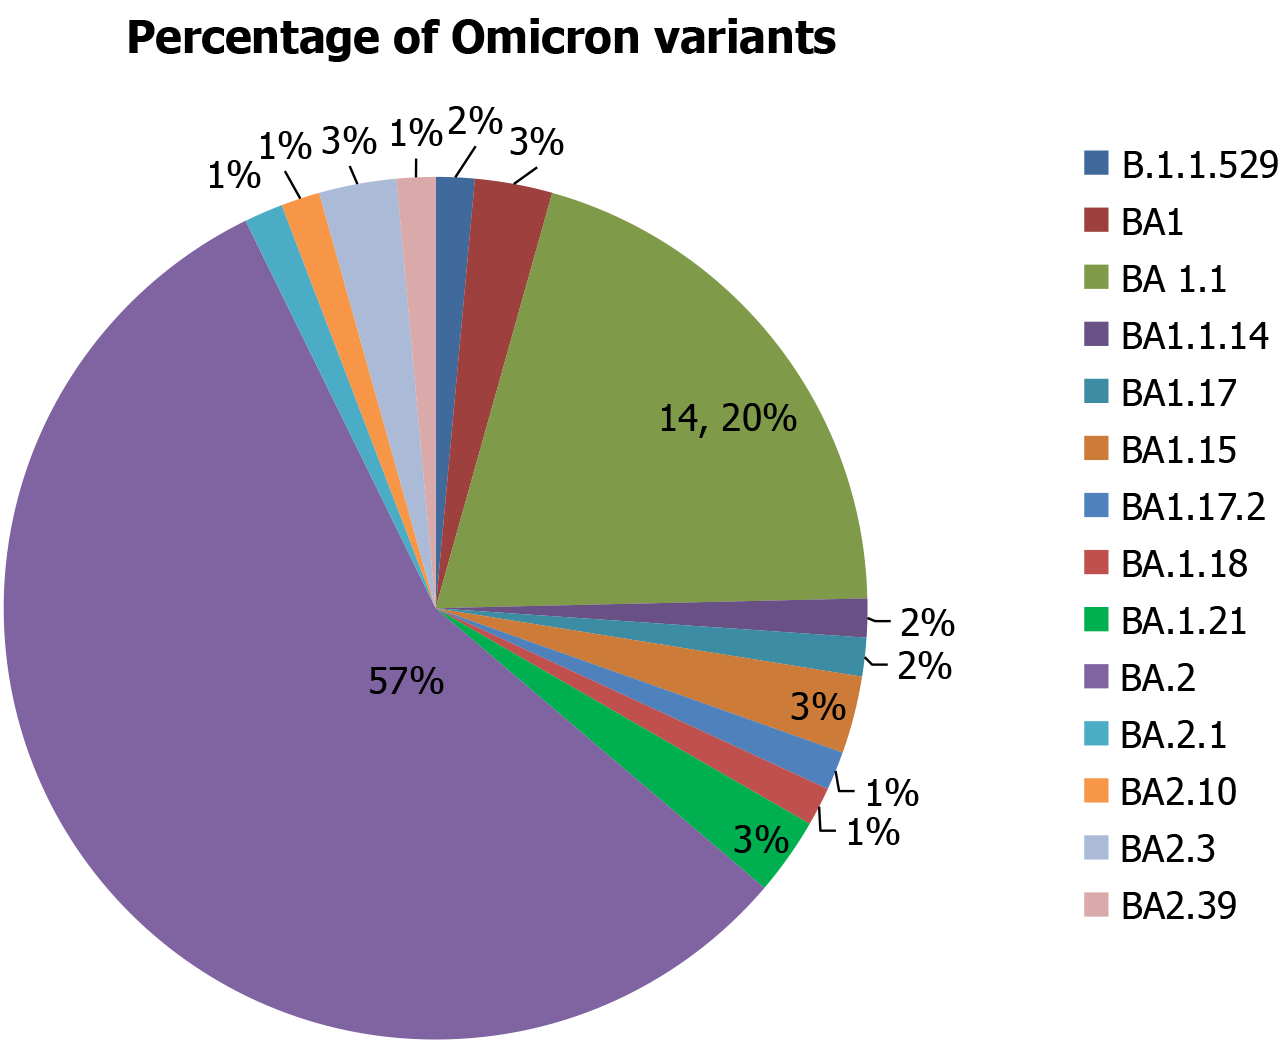
Figure 1 Distribution of the Omicron sub-lineages, majority was BA.
2.
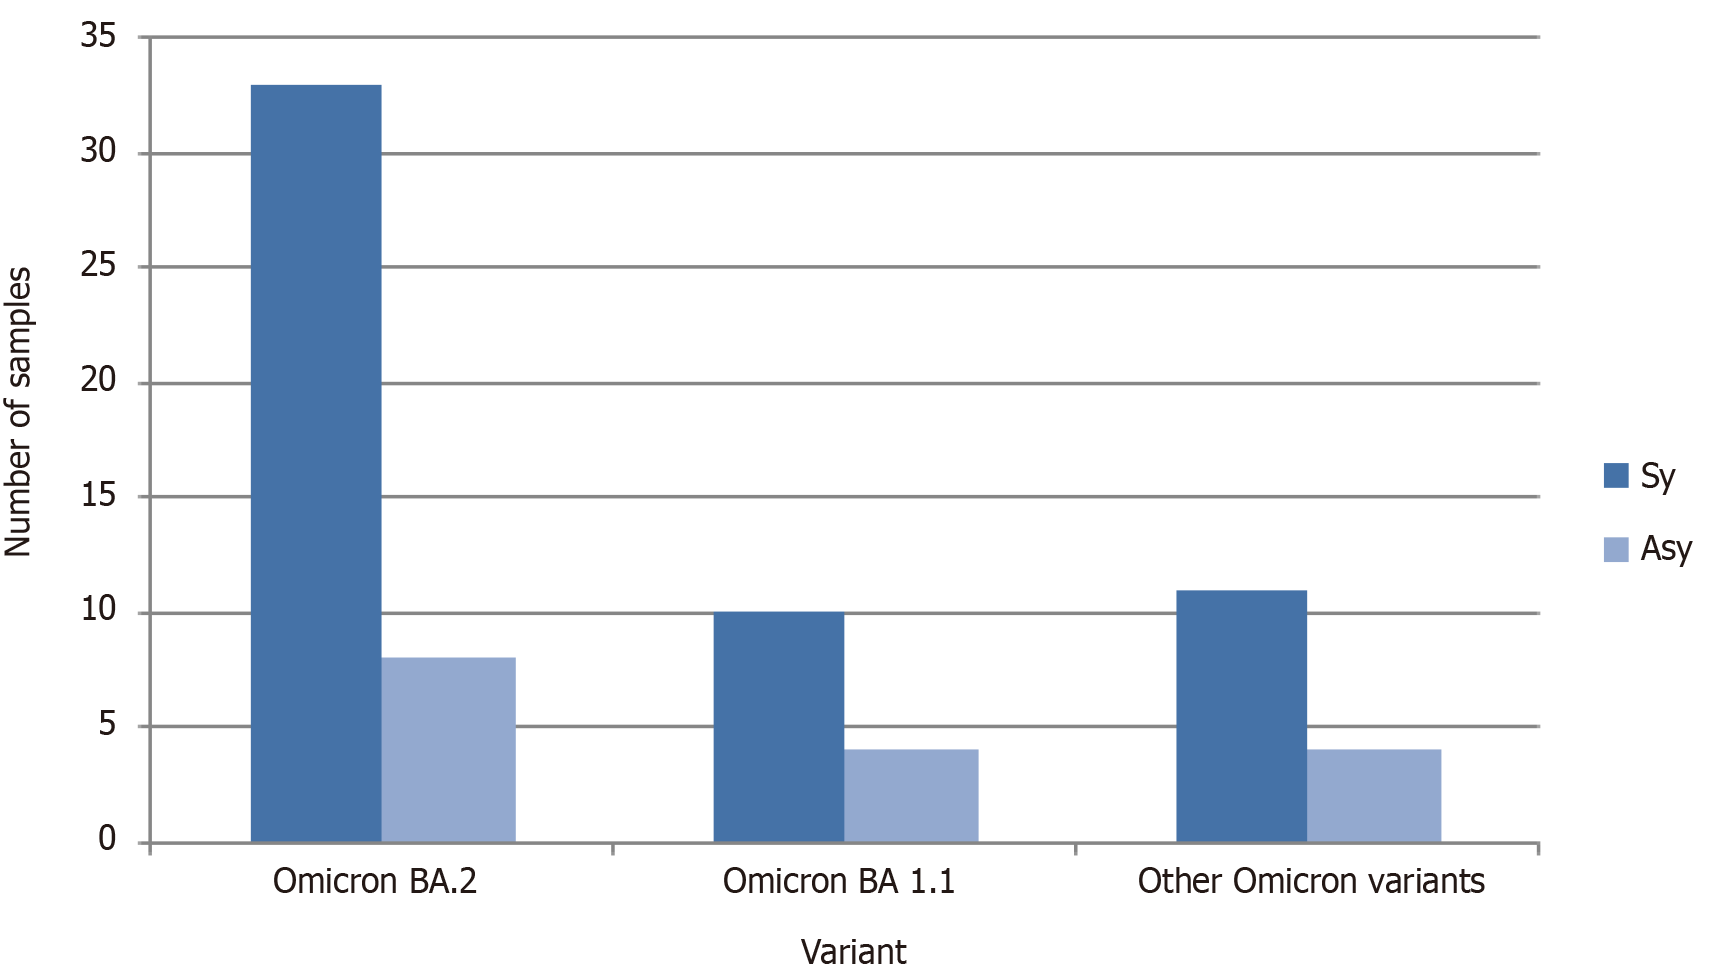
Figure 2
Distribution of samples by symptomatic status.
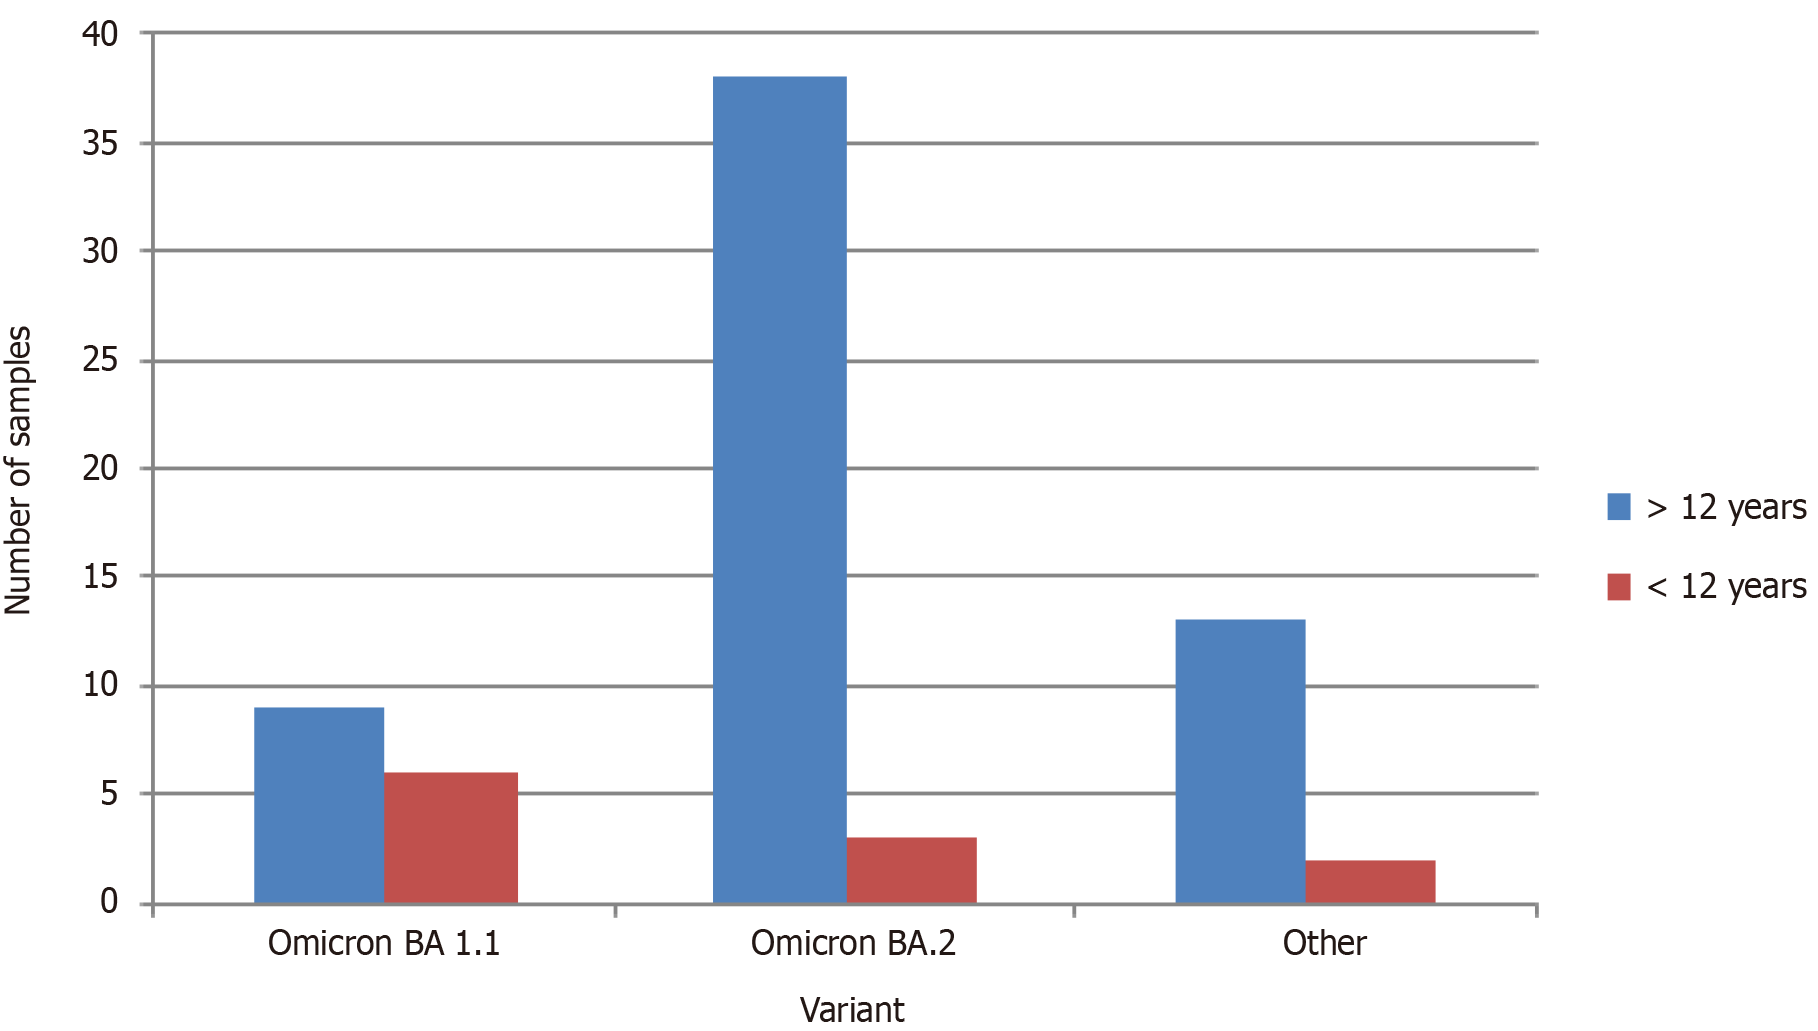
Figure 3
Age distribution of the patients infected with Omicron variant.
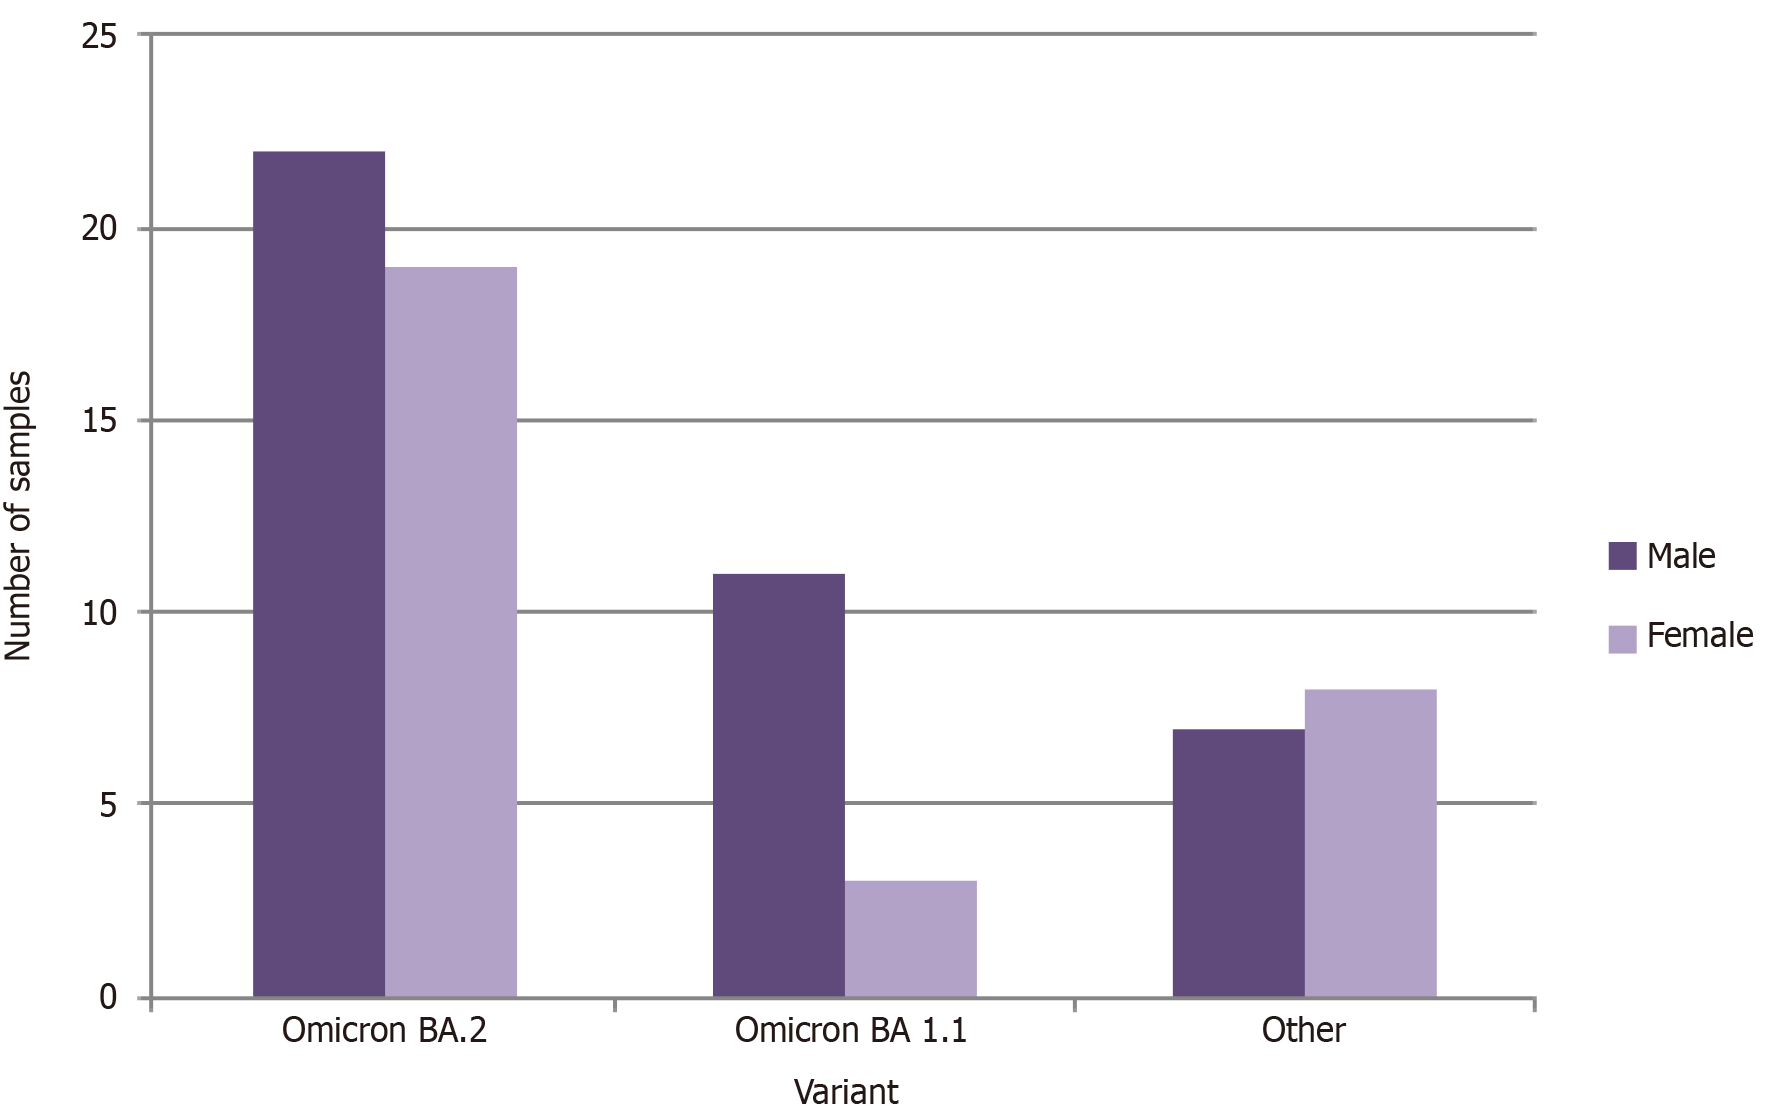
Figure 4
Sex distribution of Omicron infected patients.
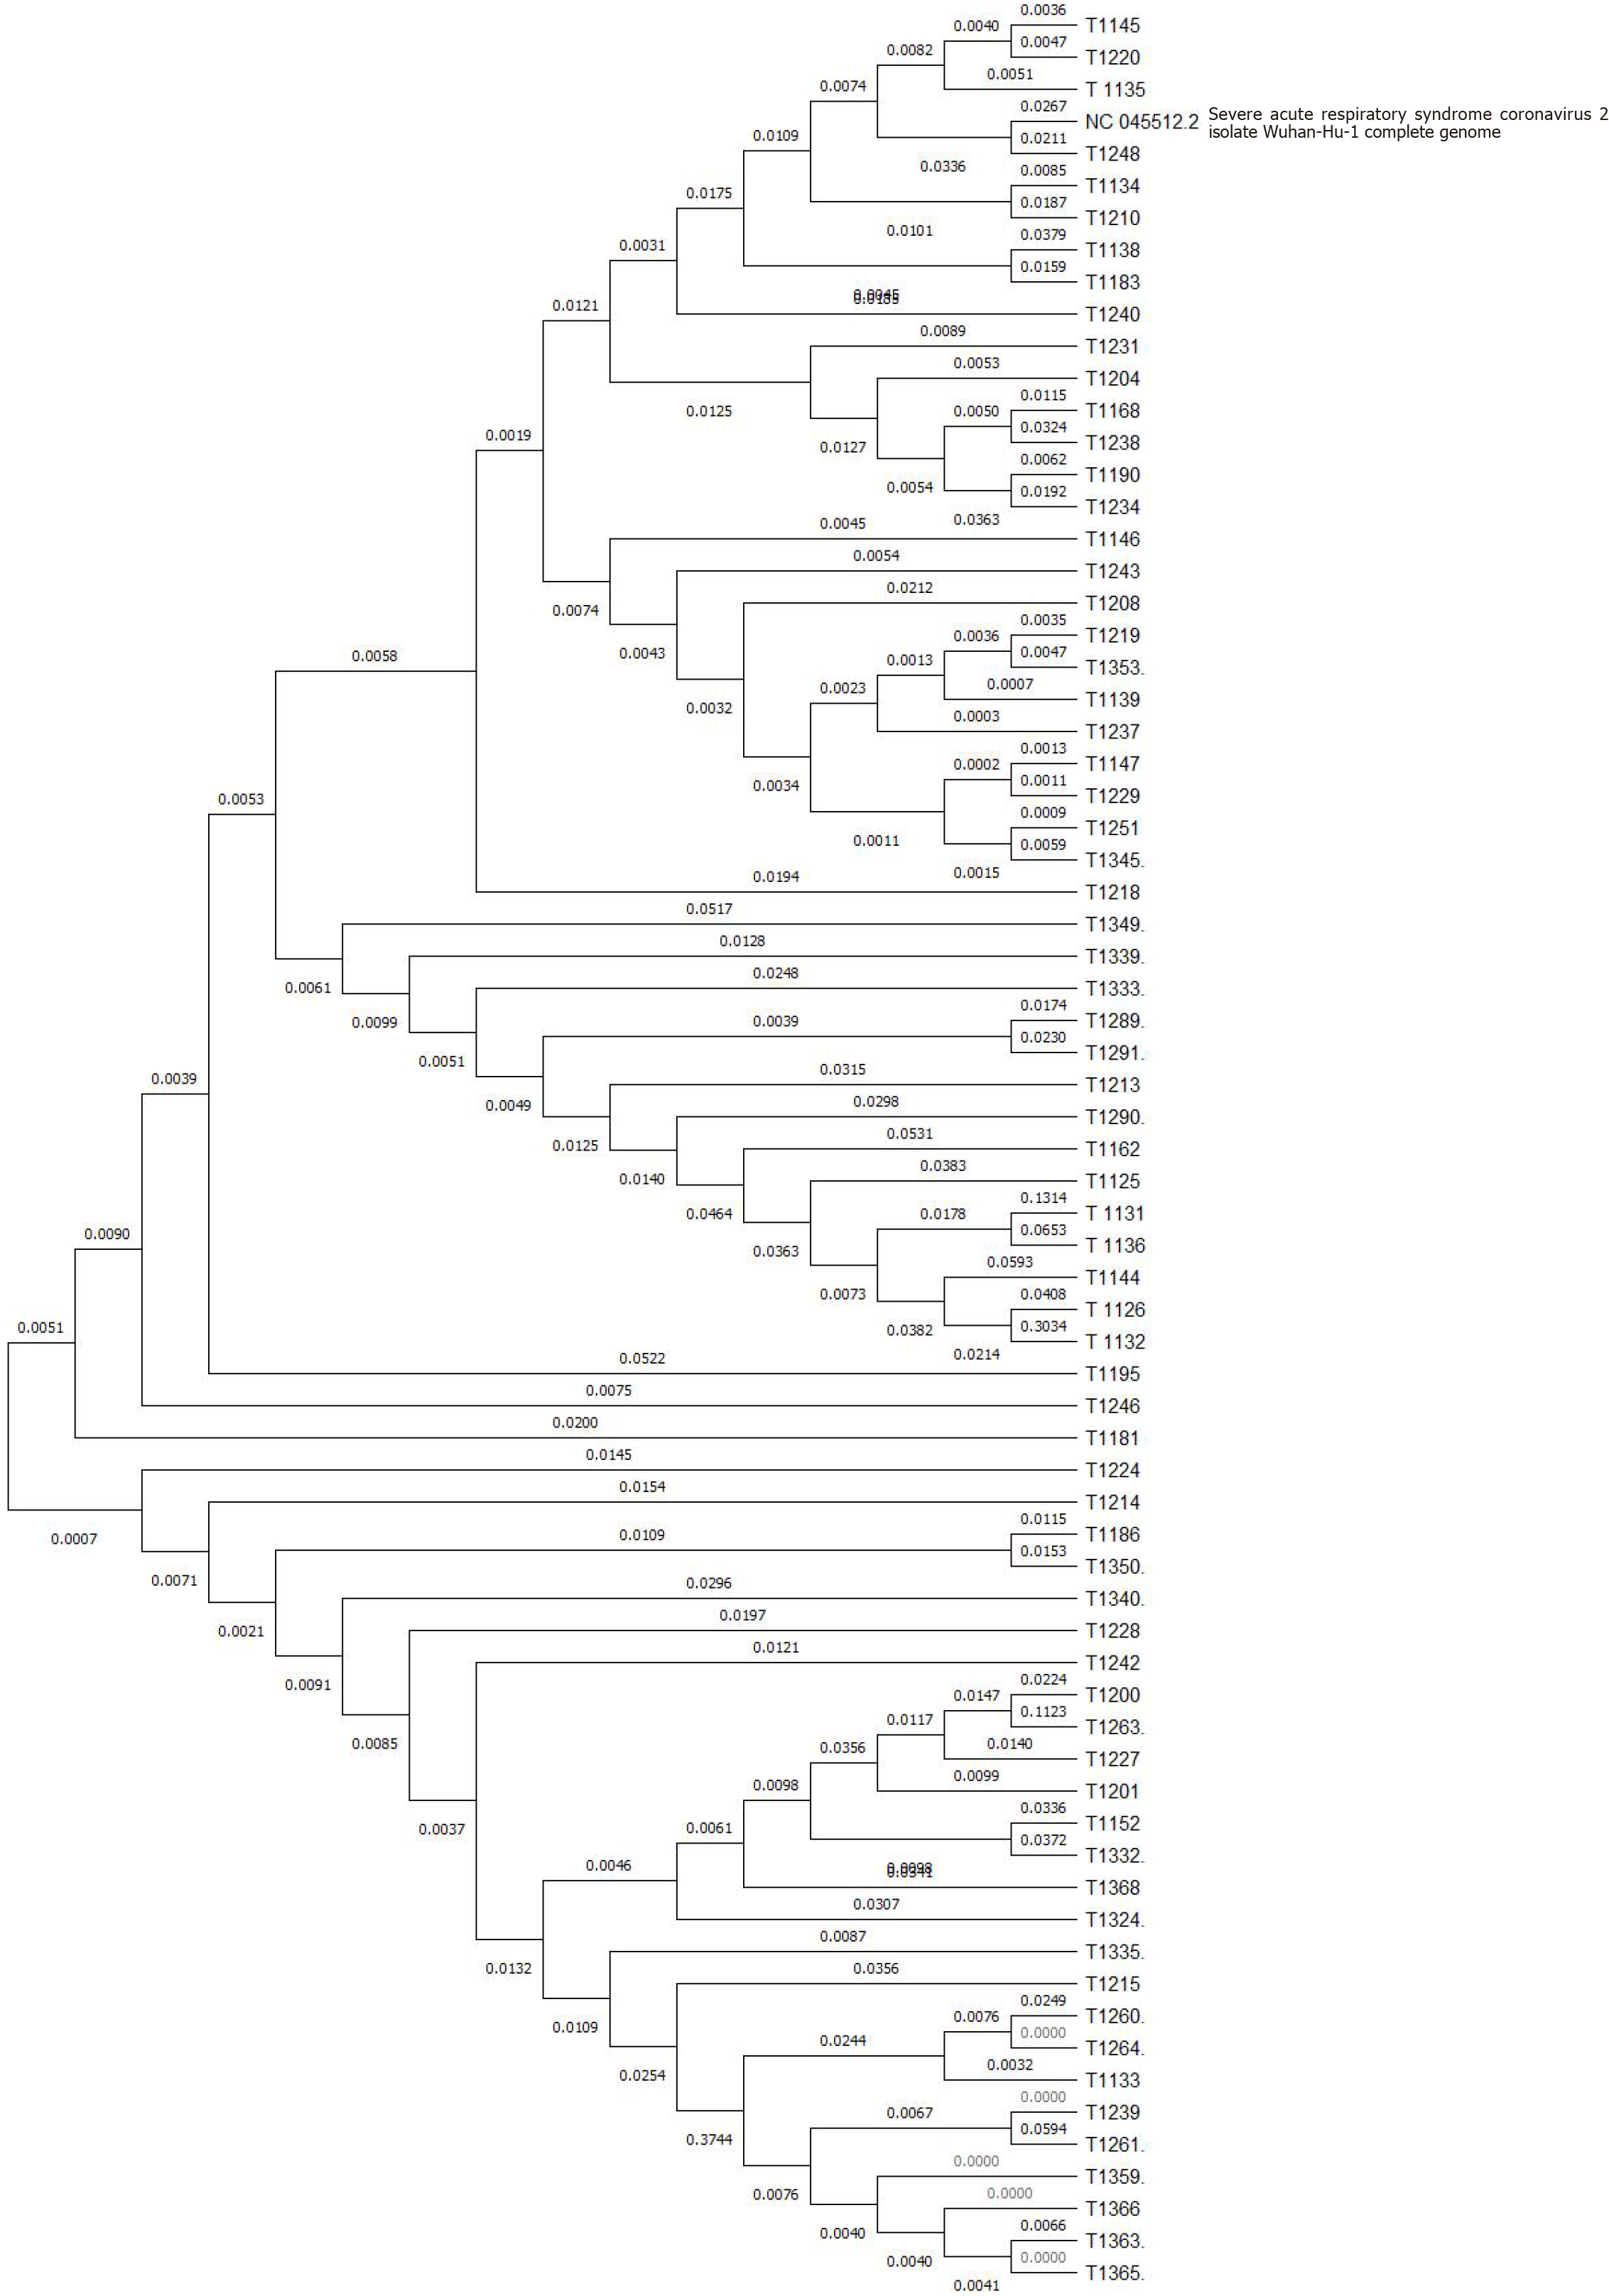
Figure 5
Phylogenetic tree of the selected samples.
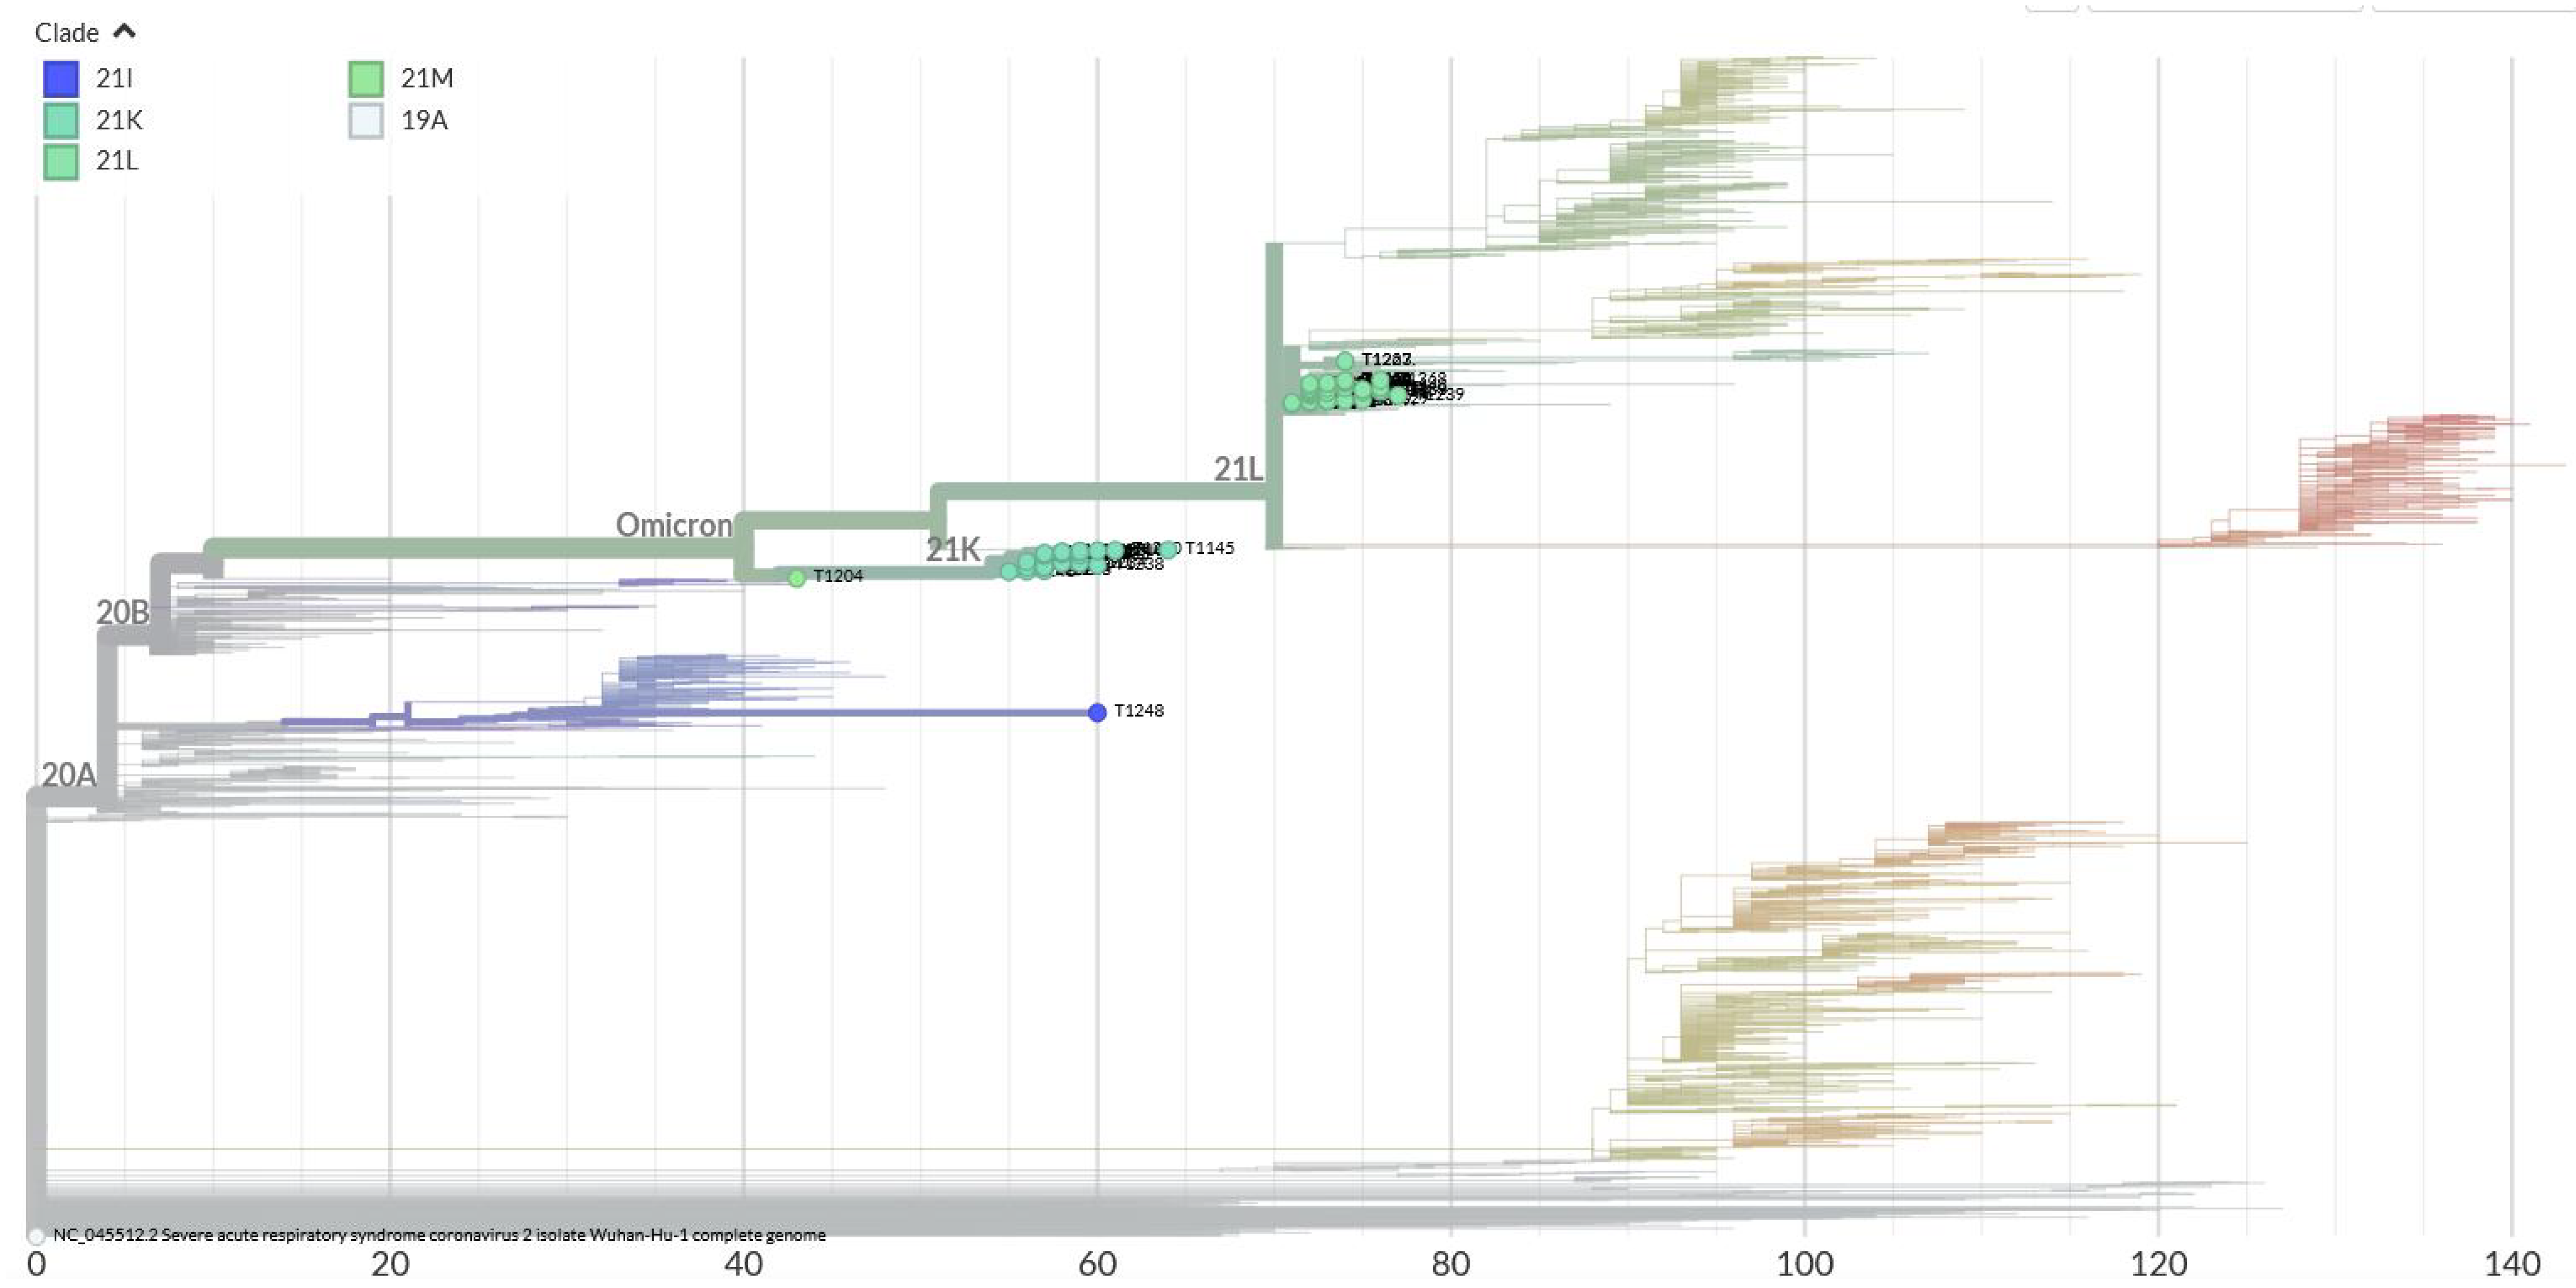
Figure 6
Phylogenetic analysis of the Omicron variants.
- Citation: Arachchige N, Dharmasiri R, Weerathunga A, Senanayake S, Janage N, Muthugala R. Genomic and demographic characterization of SARS-CoV-2 infections within early Omicron cluster, Western Sri Lanka. World J Virol 2025; 14(2): 106108
- URL: https://www.wjgnet.com/2220-3249/full/v14/i2/106108.htm
- DOI: https://dx.doi.org/10.5501/wjv.v14.i2.106108


