Copyright
©The Author(s) 2025.
World J Transplant. Dec 18, 2025; 15(4): 106444
Published online Dec 18, 2025. doi: 10.5500/wjt.v15.i4.106444
Published online Dec 18, 2025. doi: 10.5500/wjt.v15.i4.106444
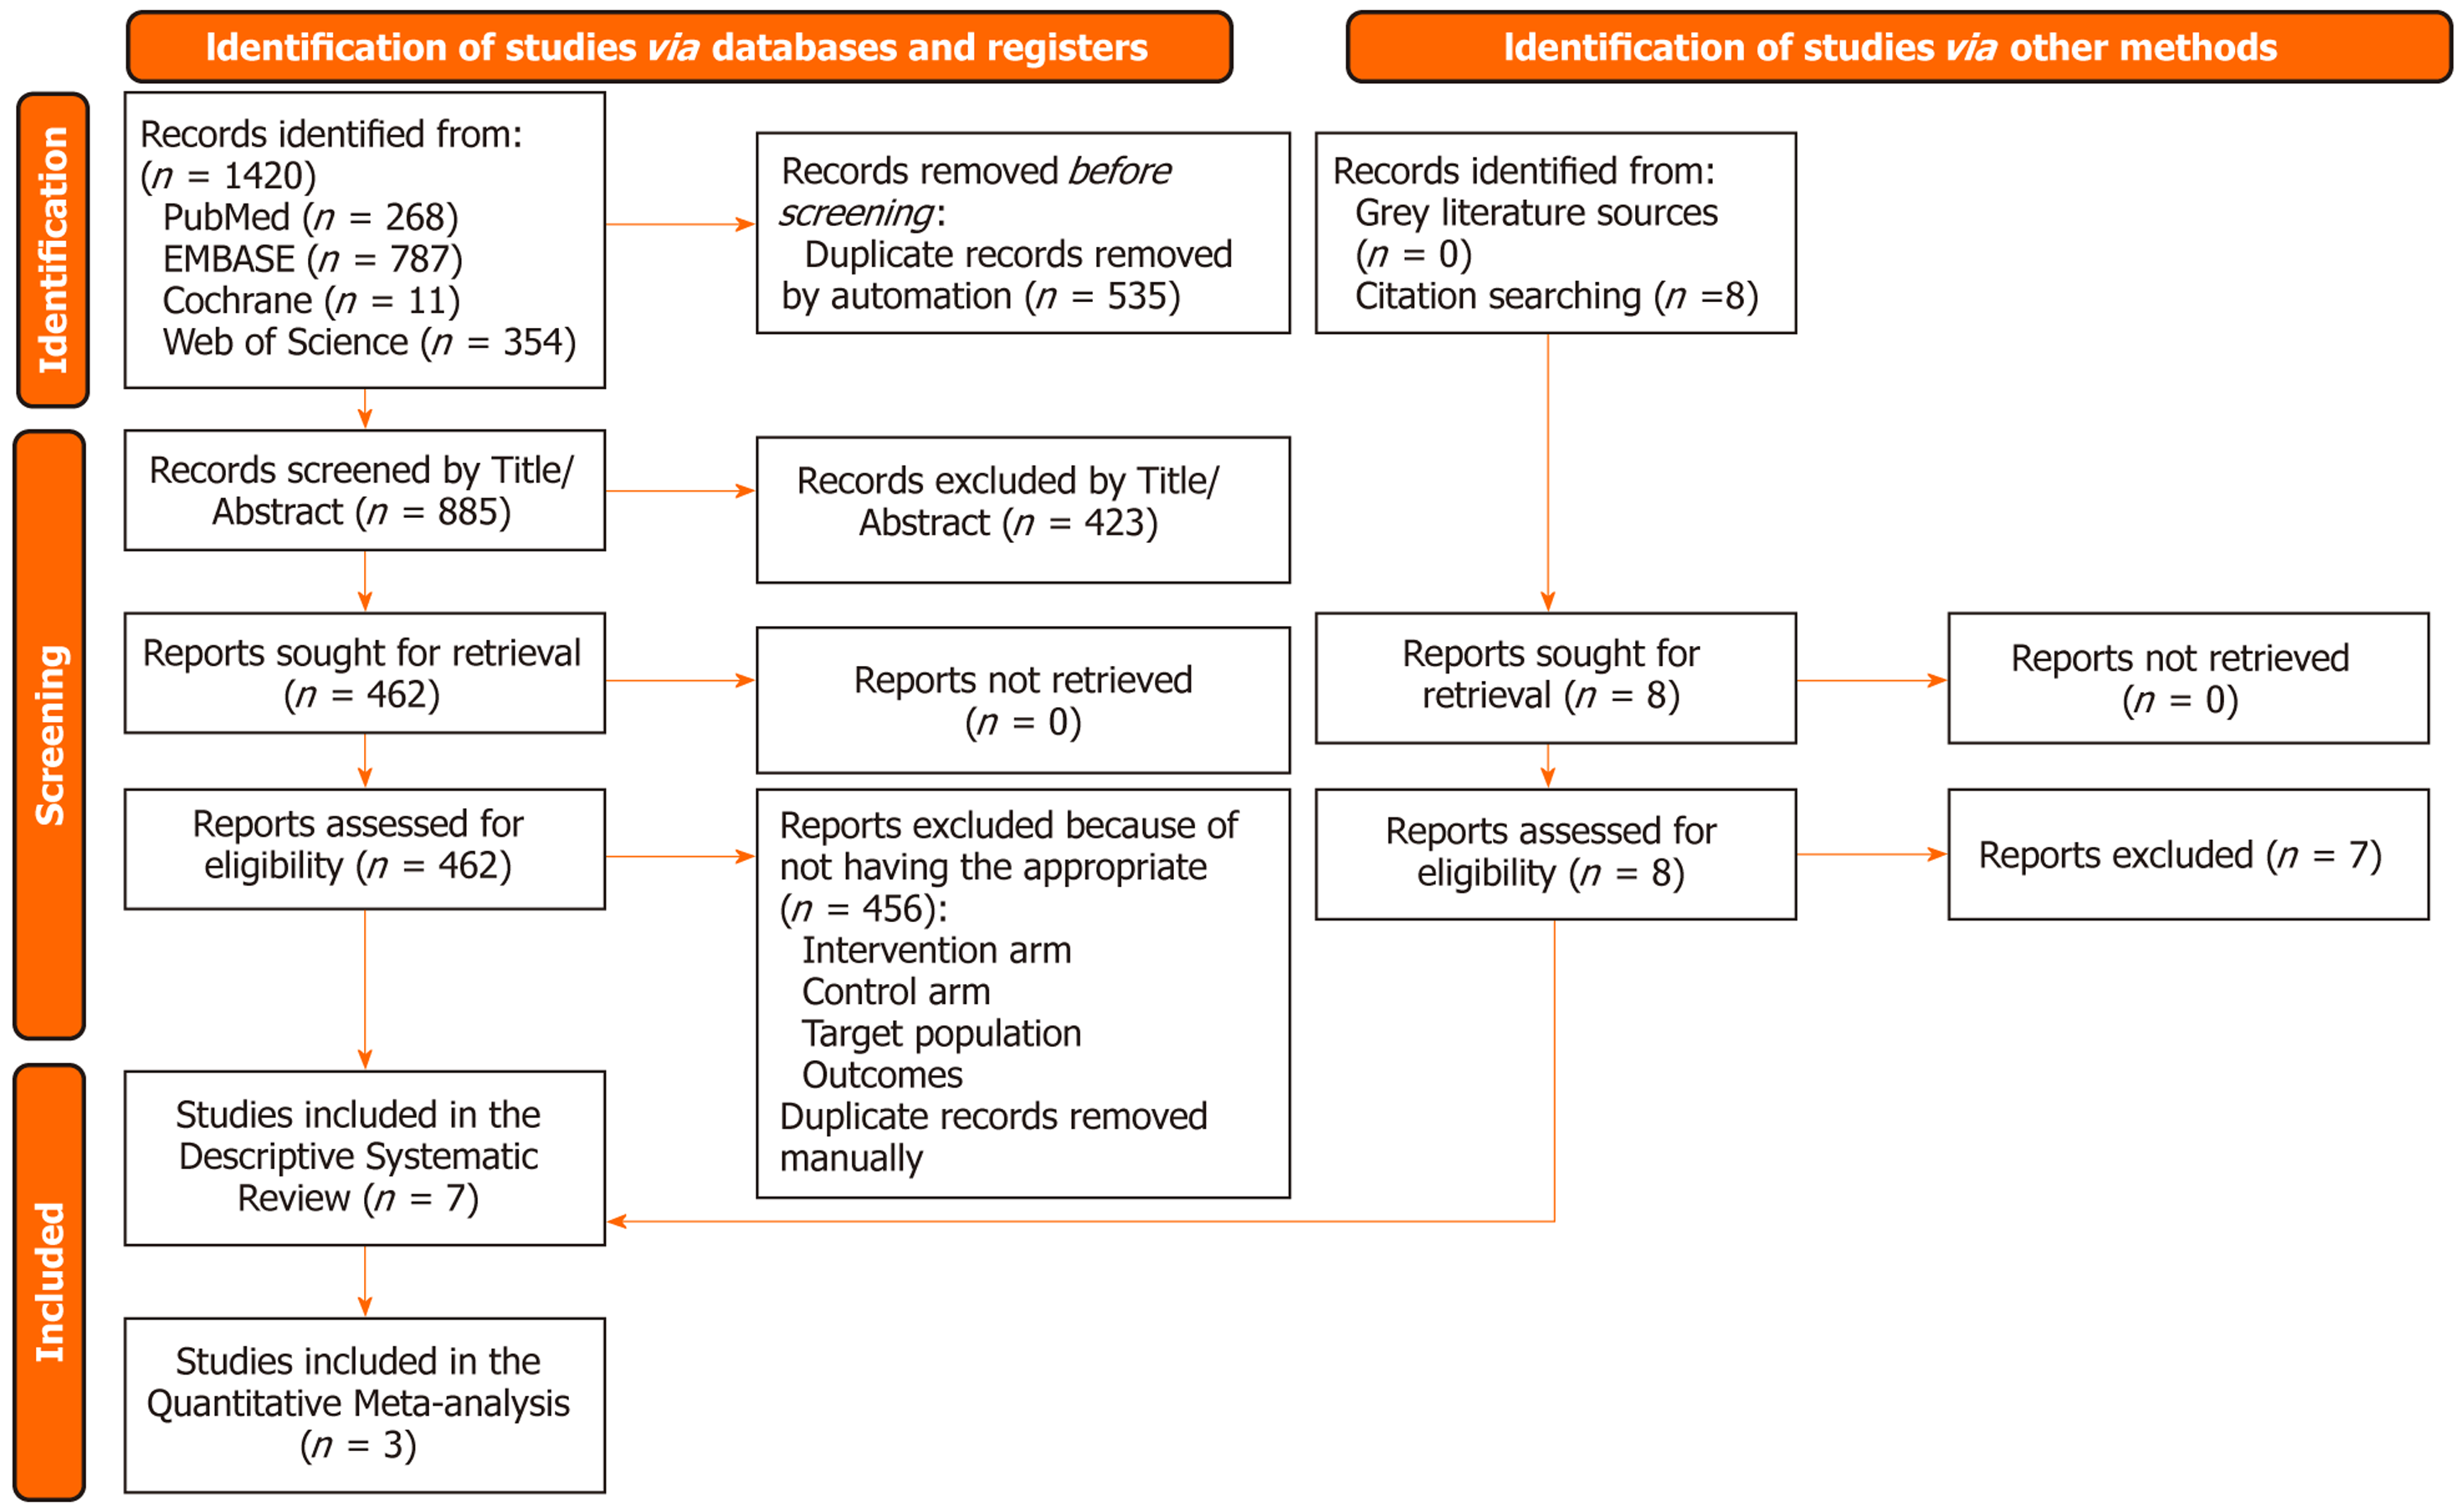
Figure 1
PRISMA flow diagram detailing the study identification, screening, eligibility, and inclusion process for the systematic review and meta-analysis.
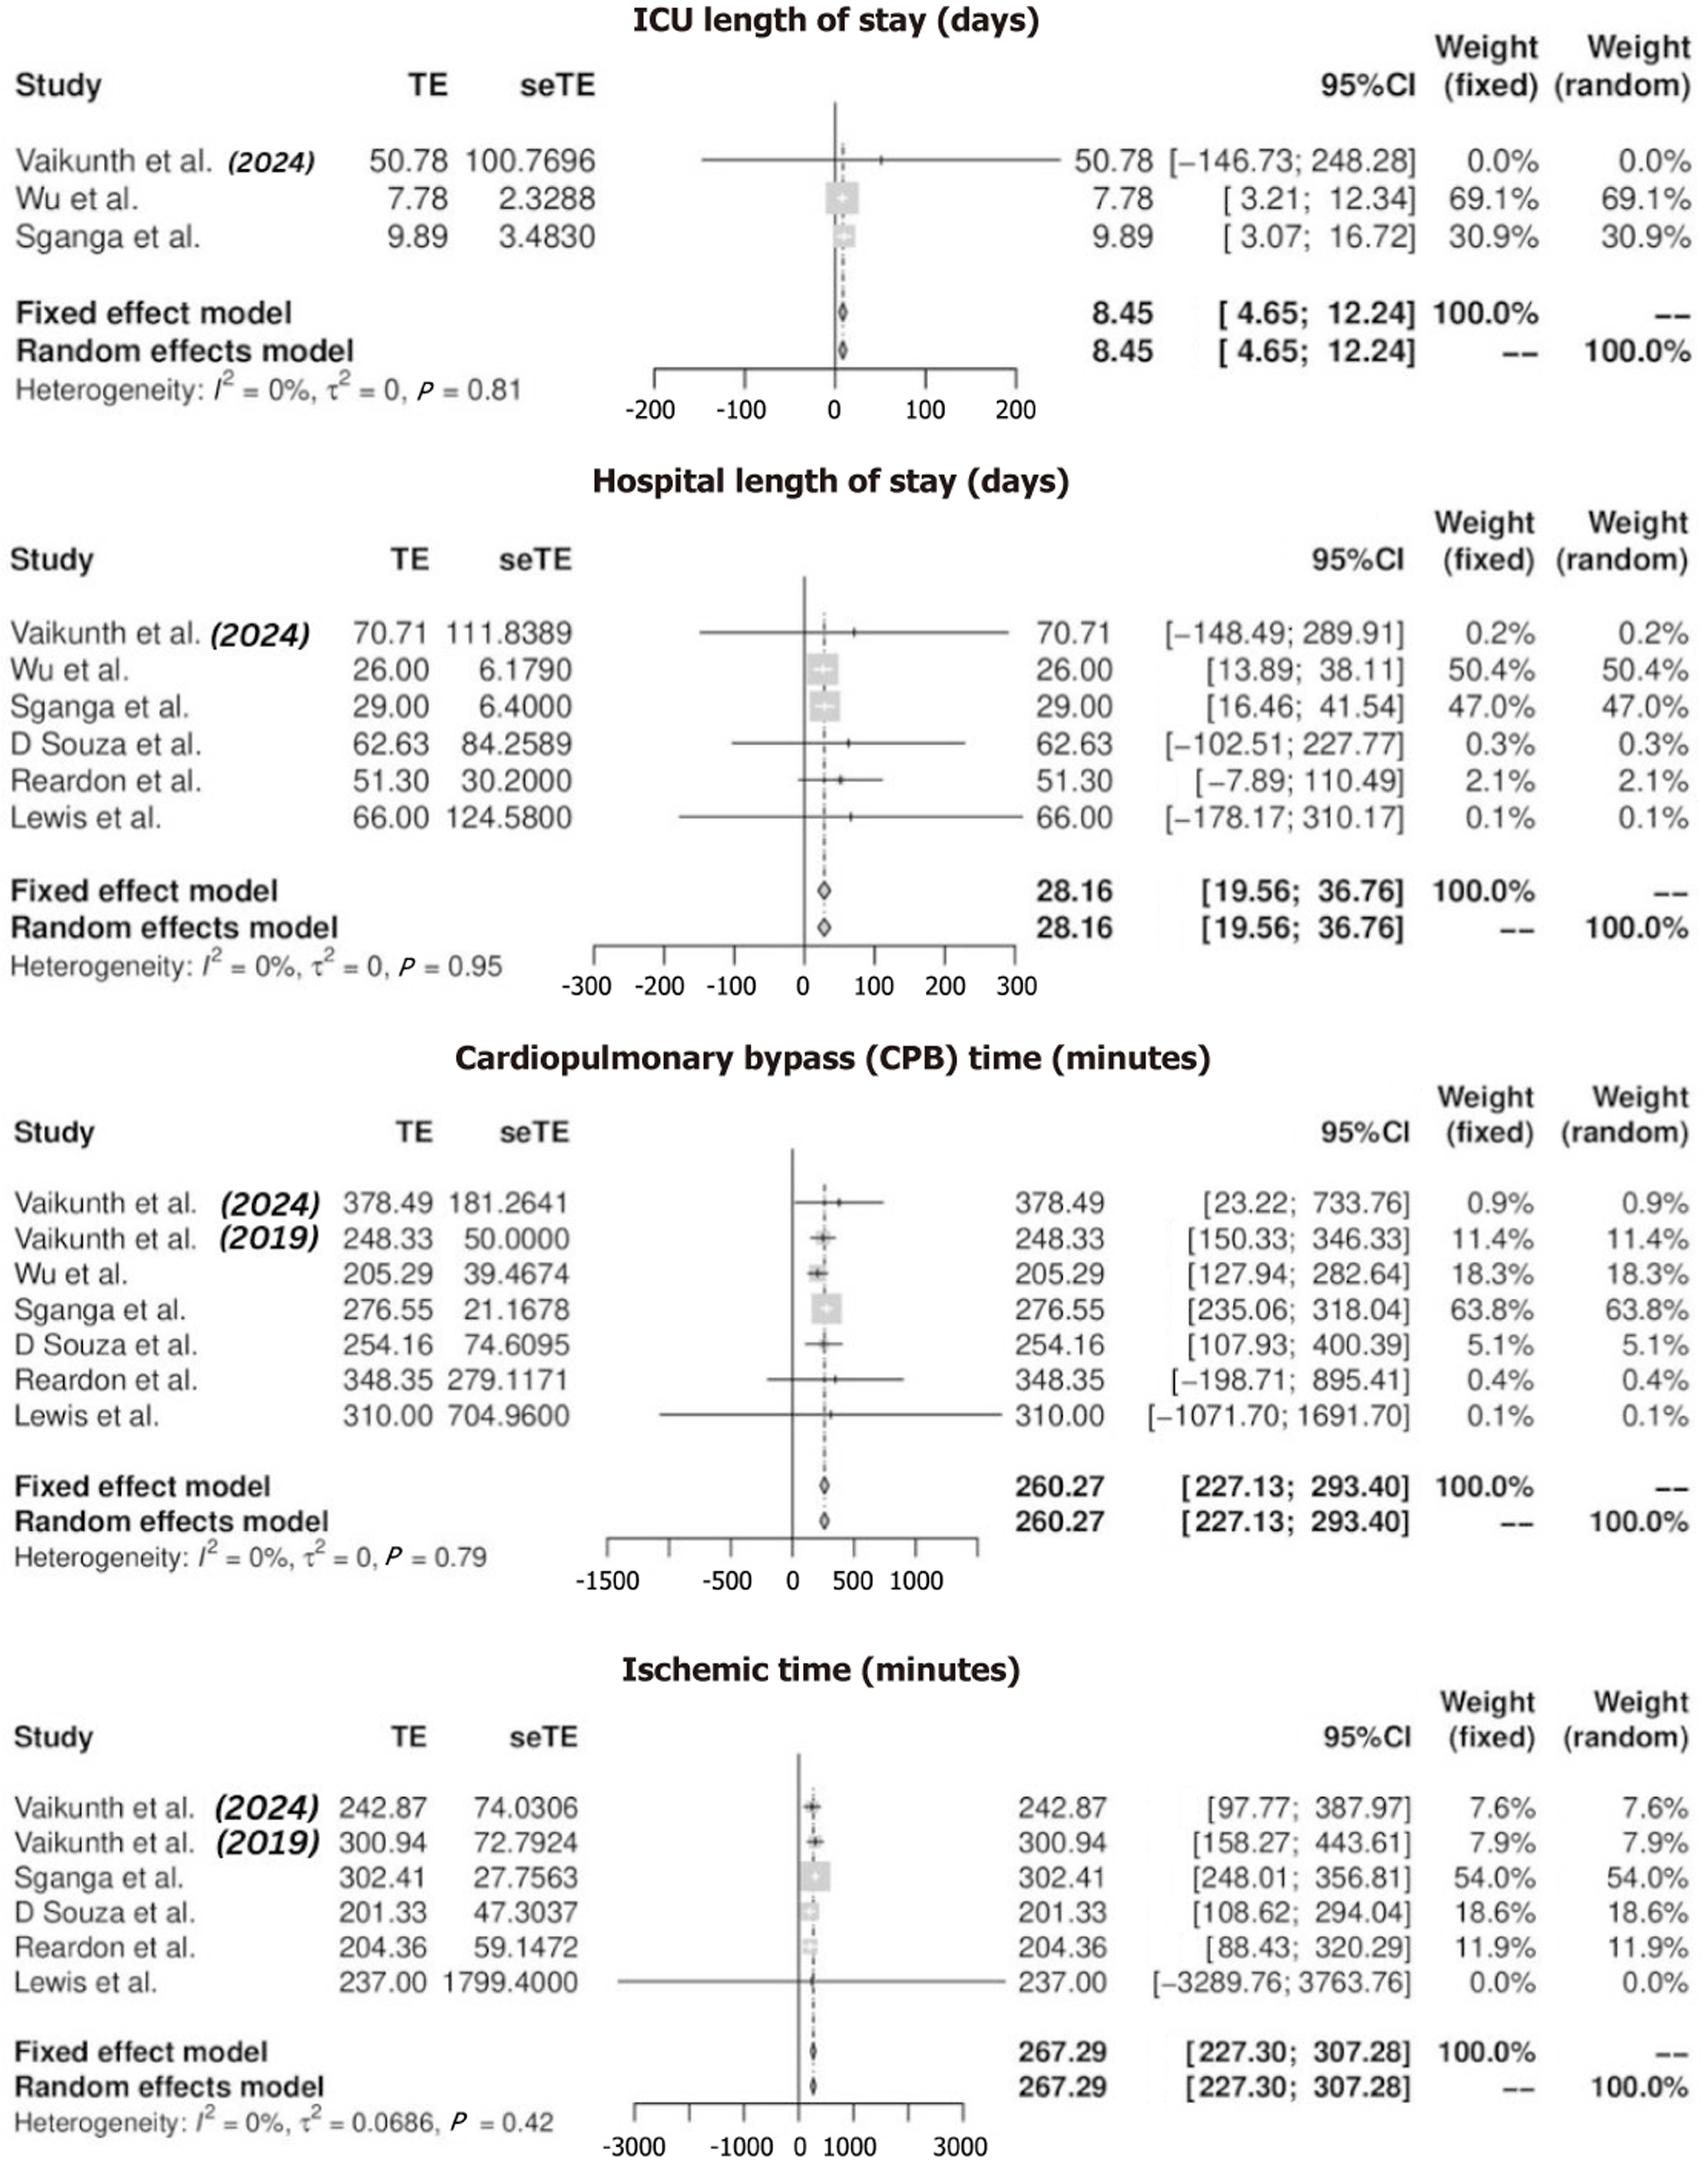
Figure 2
Forest plots for cumulative intensive care unit length of stay, hospital length of stay, cardiopulmonary bypass time, and ischemic time for combined heart-liver transplantation-only patients.
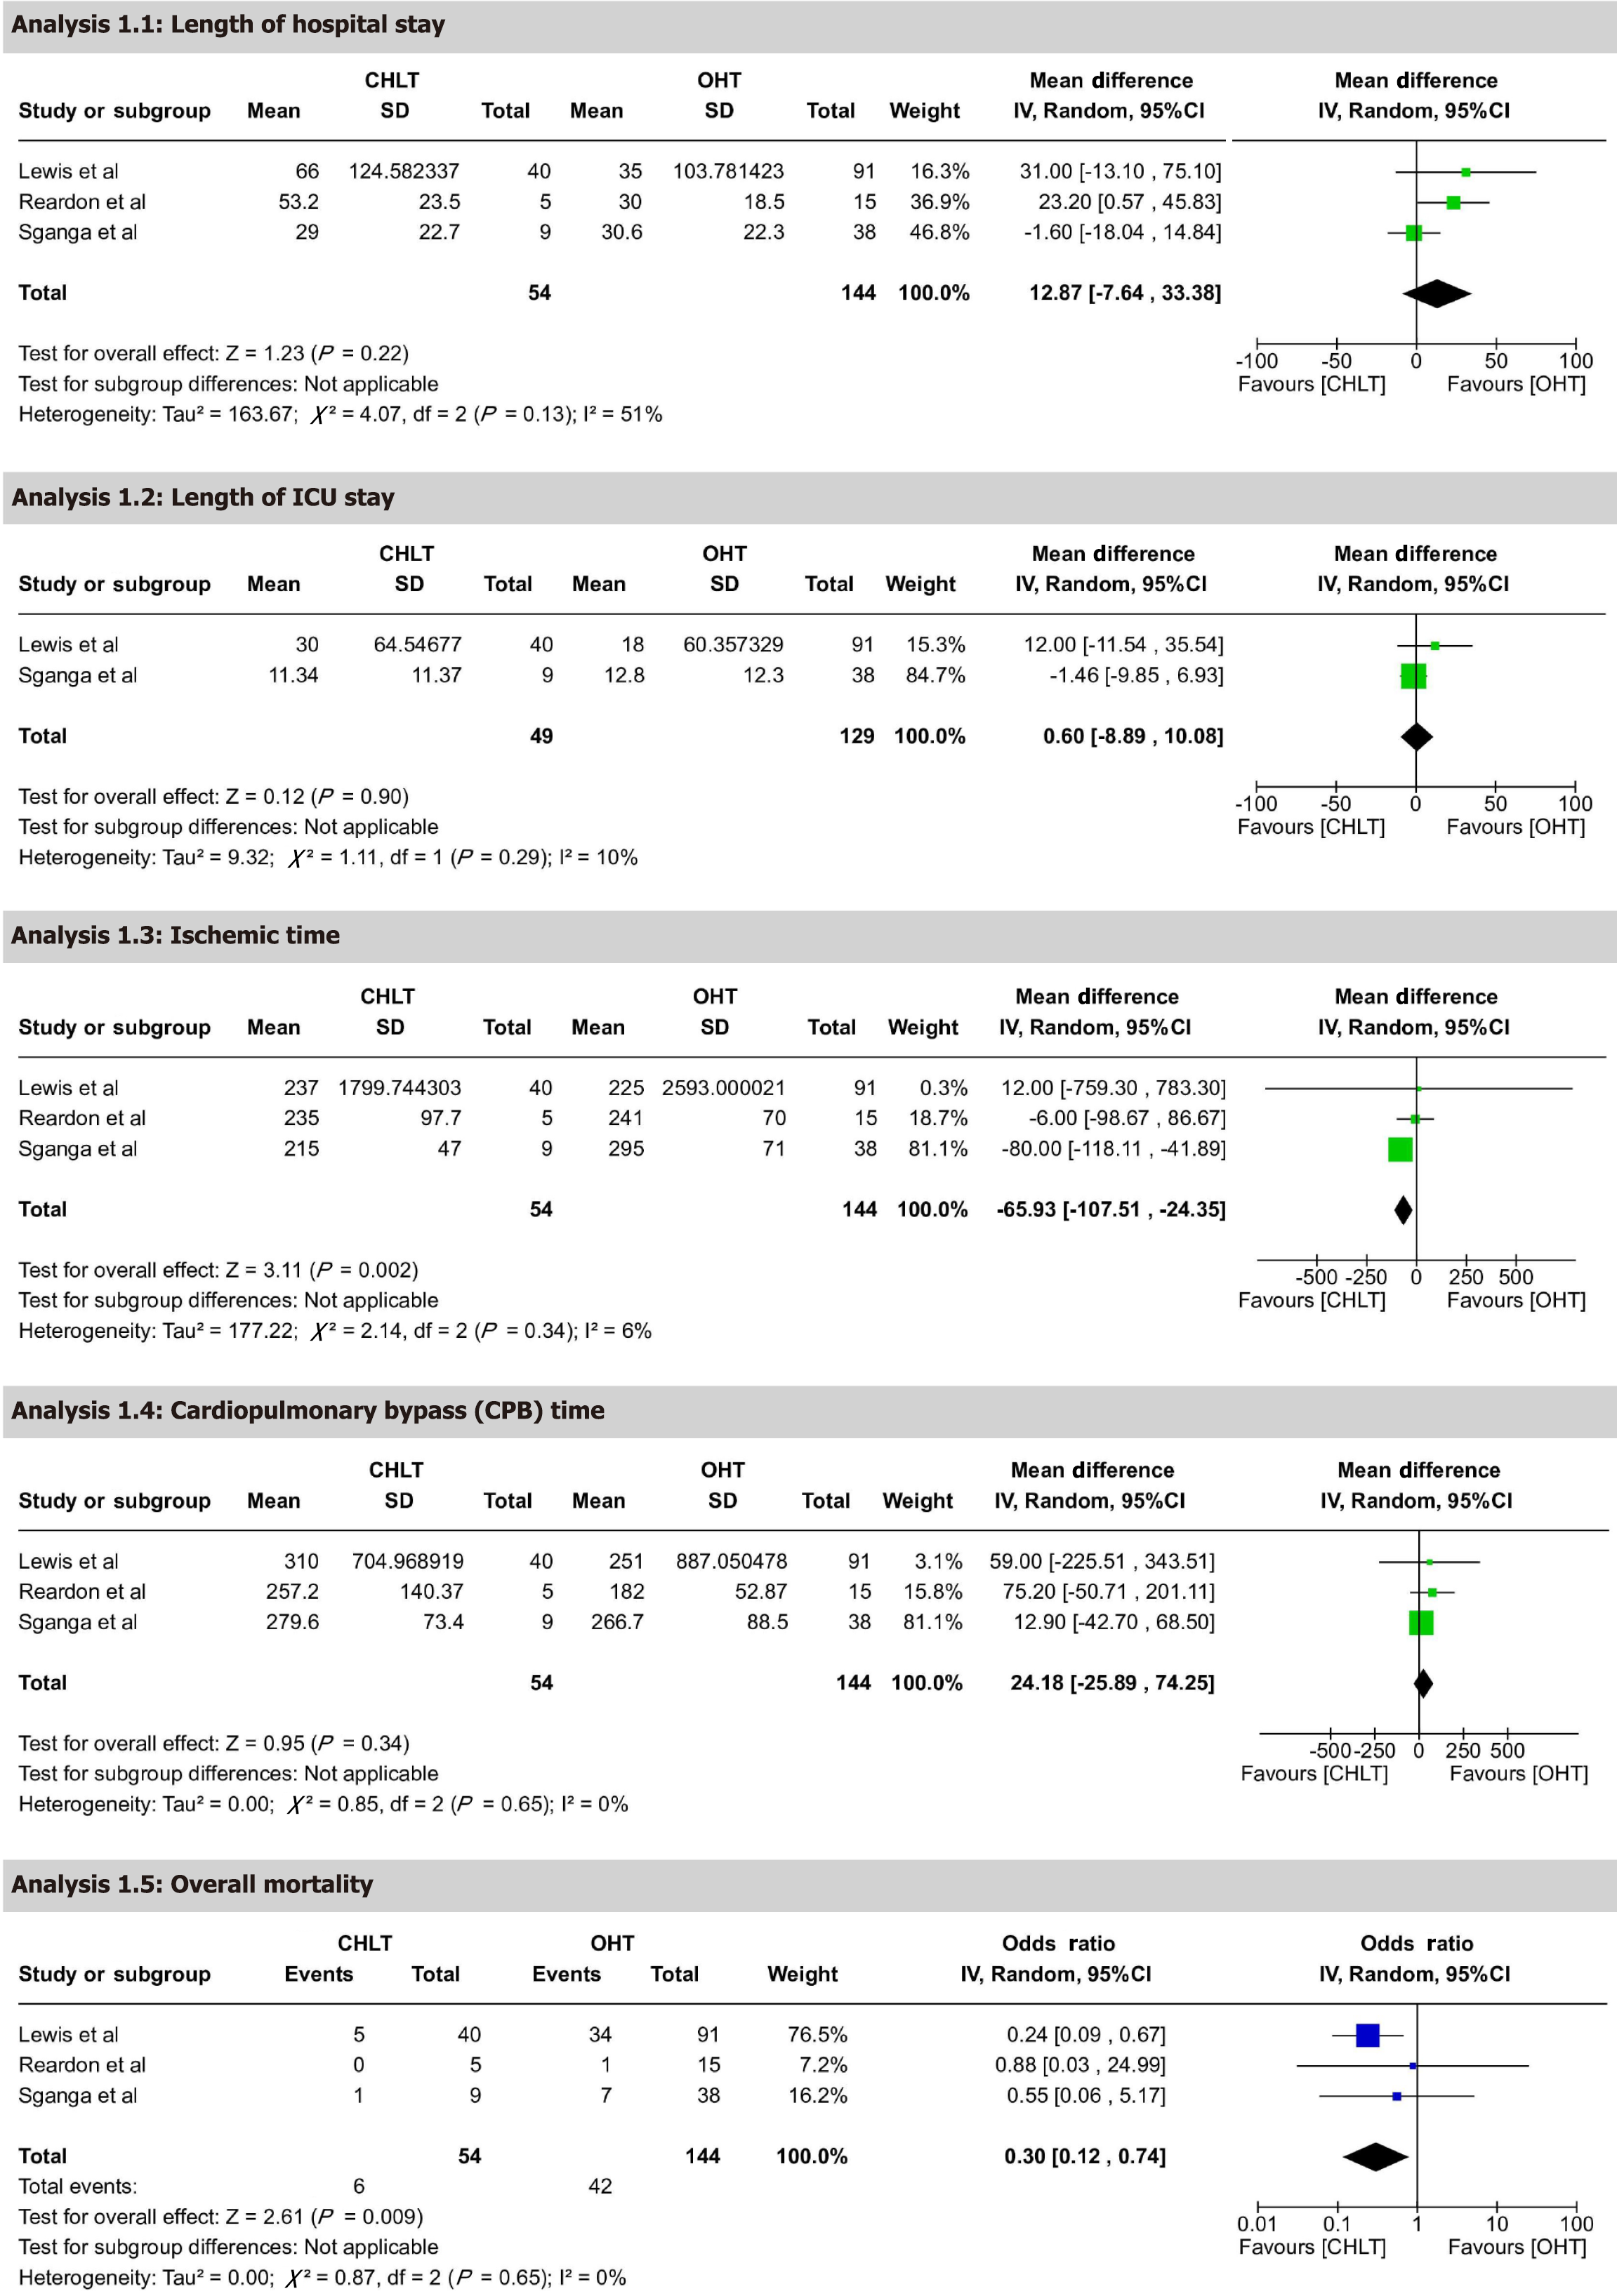
Figure 3 Forest plot comparing intensive care unit length of stay, hospital length of stay, cardiopulmonary bypass time, ischemic time, and overall mortality.
CHLT: Combined heart-liver transplantation.
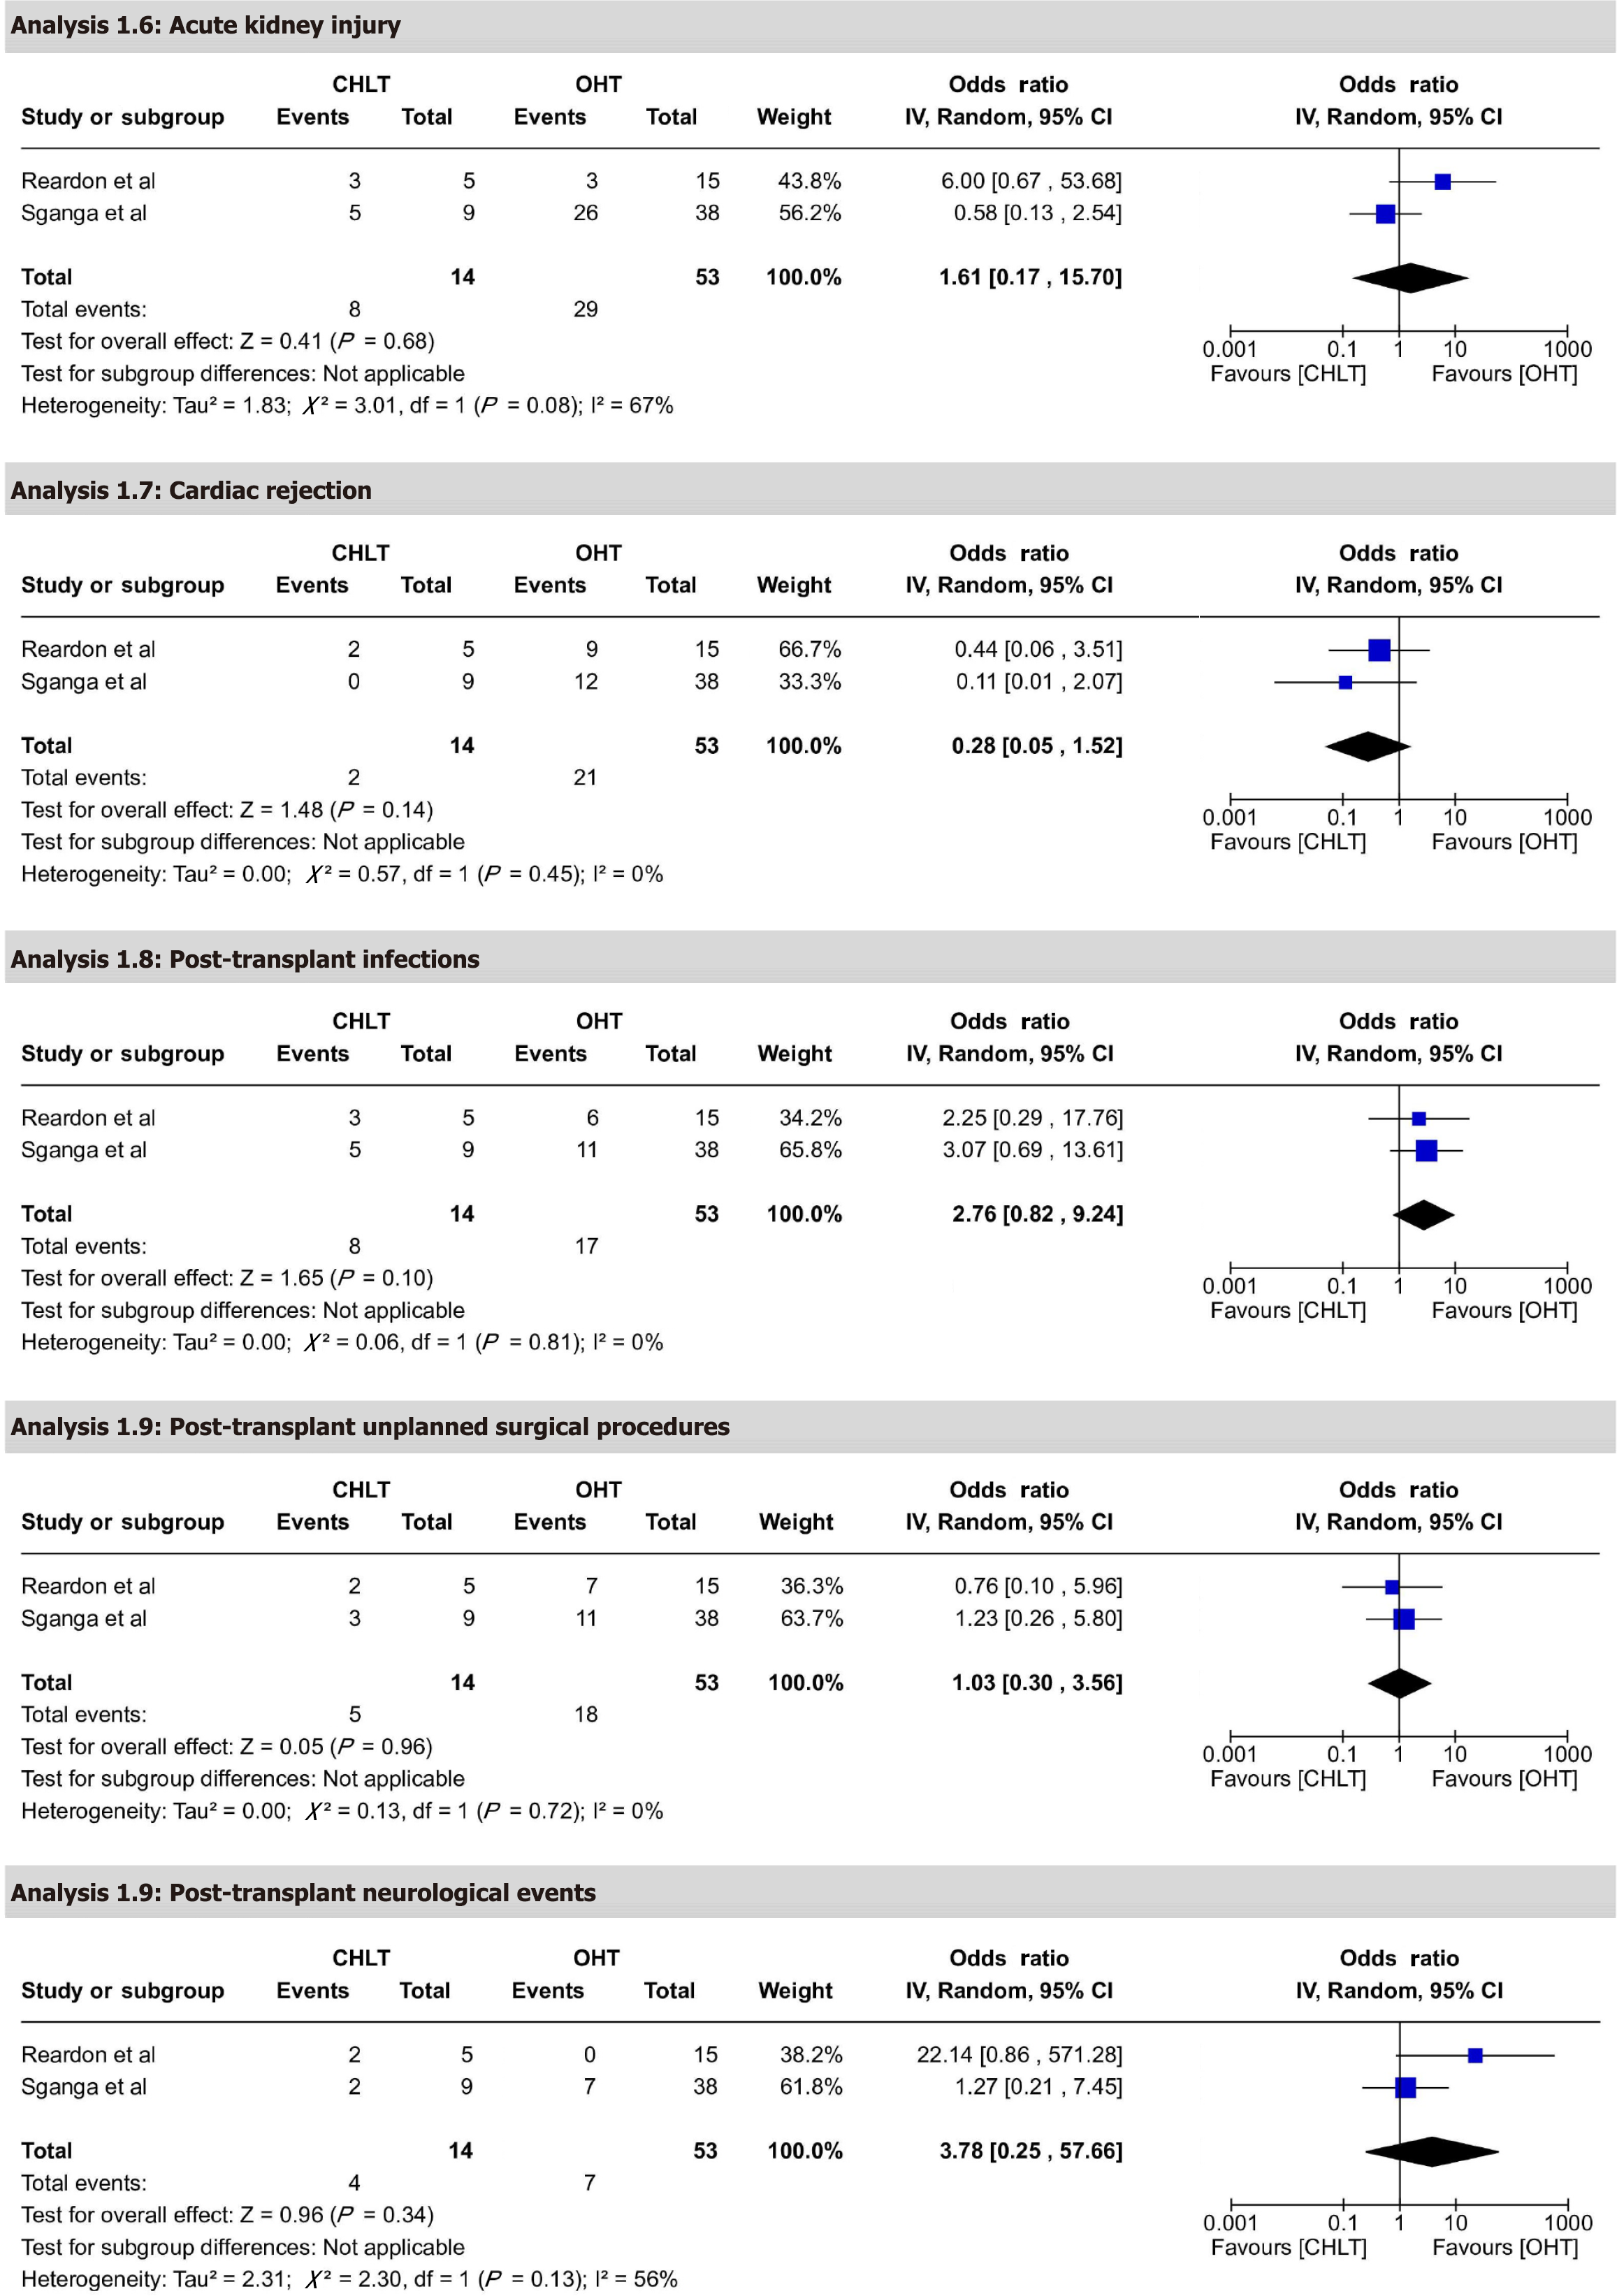
Figure 4 Forest plot comparing post-transplant complications, including infection rates, acute kidney injury, and cardiac rejection between combined heart-liver transplantation and orthotopic heart transplantation patients.
CHLT: Combined heart-liver transplantation.
- Citation: Shahzil M, Habiba U, Irfan MZ, Qureshi MA, Faisal MS, Kashif T, Qureshi AA, Ali H, Jahagirdar V, Vinayek R. Outcomes and complications of combined heart-liver transplantation in patients with failing Fontan physiology: A systematic review. World J Transplant 2025; 15(4): 106444
- URL: https://www.wjgnet.com/2220-3230/full/v15/i4/106444.htm
- DOI: https://dx.doi.org/10.5500/wjt.v15.i4.106444


