


Published online Mar 19, 2026. doi: 10.5498/wjp.v16.i3.112962
Revised: September 9, 2025
Accepted: November 11, 2025
Published online: March 19, 2026
Processing time: 201 Days and 0.9 Hours
Attention-deficit/hyperactivity disorder (ADHD) is a common neurodevelopmental condition characterized by inattention, impulsivity, and hyperactivity. Traditional diagnosis relies on clinical evaluation, which is time-consuming and subjective. Electroencephalography (EEG) signals provide an objective alternative, and machine learning methods can improve their diagnostic utility.
To develop an explainable EEG-based model for ADHD detection by integrating a novel combination ternary pattern (CTP) feature extractor with twin wavelet transform (TWT) for multilevel signal analysis, and to evaluate its effectiveness in providing accurate, channel-wise, and fusion-based classification results for objective and rapid ADHD diagnosis.
A new EEG dataset containing more than 7000 segments from 137 ADHD patients and 150 controls was studied. A novel feature engineering framework was developed, combining a new CTP extractor with statistical features. A multilevel feature extraction structure was designed using a newly proposed TWT for signal decomposition. Extracted features were reduced to the most informative 263 using neighborhood component analysis. Channel-wise classification was performed with k-nearest neighbors, followed by iterative majority voting across 20 EEG channels.
Single-channel analysis achieved up to 99.12% accuracy. By applying majority voting, overall classification ac
Our study introduces a large ADHD EEG dataset and a novel model integrating TWT and CTP. The model pro
Core Tip: This study introduces a novel combination ternary pattern-based framework integrated with a newly developed twin wavelet transform for automated attention-deficit/hyperactivity disorder detection using electroencephalography signals. Leveraging a newly acquired multi-channel electroencephalography dataset of over 7000 recordings, the proposed approach performs channel-wise feature extraction, statistical fusion, and optimal feature selection via neighborhood component analysis. The model achieves remarkable classification performance, with up to 99.97% accuracy through majority voting, demonstrating its potential as a reliable, explainable, and non-invasive diagnostic support tool for attention-deficit/hyperactivity disorder detection assessment.
- Citation: Atas Y, Kırık S, Yıldırım K, Tasci B, Barua PD, Balgetir F, Dogan S, Tuncer T, Tan RS, Palmer E, Devi A, Acharya UR. Explainable electroencephalography-based attention-deficit/hyperactivity disorder detection model with a combination of ternary pattern and twin wavelet transform. World J Psychiatry 2026; 16(3): 112962
- URL: https://www.wjgnet.com/2220-3206/full/v16/i3/112962.htm
- DOI: https://dx.doi.org/10.5498/wjp.v16.i3.112962
Attention-deficit/hyperactivity disorder (ADHD) is a condition that typically begins in childhood[1,2]. Central to ADHD are enduring manifestations of inattention, impulsivity, and/or hyperactivity, albeit with varying degrees of severity across individuals[3,4]. Notably, recognized ADHD subtypes encompass inattentive, hyperactive, and combined presentations, the latter characterizing the co-occurrence of inattentive and hyperactive symptoms[5-7]. ADHD is a pediatric-onset condition, with 5%-10% of children and adolescents worldwide diagnosed with ADHD[8,9]. It is estimated that 50%-70% of children will continue to have at least one symptom into adulthood. ADHD in adults has been associated with antisocial behavior, alcohol and other substance abuse, increased frequency of injuries, traffic accidents, and challenges maintaining employment and stable relationships[10].
In view of the multiple and potentially life-long impacts of under-treated ADHD, timely diagnosis and evidence-based treatment approaches in childhood are important[11]. Traditionally, an accurate ADHD diagnosis is time and labor-intensive, requiring information obtained from family and school, observations by a trained clinician, and results of psychological tests and ADHD-specific scales[12,13]. This means that access to diagnoses is currently inequitable, especially in regions with limited access to appropriately skilled clinicians. Therefore, innovative, objective, time- and cost-effective diagnostic methods must be developed and validated. The potential use of electroencephalography (EEG) signals in diagnosing ADHD was first recognized more than 85 years ago[14,15]. Numerous studies have since reported characteristic individuals EEG patterns in individuals with ADHD, particularly an elevated theta/beta ratio[16,17]. Sánchez-González and García-Zapirain[18] further examined the association between alpha-band EEG oscillations and ADHD. Significant variations were observed in the frequency ranges of 8-10 Hertz (Hz) and 10-12 Hz between the ADHD group and the combined subtype. Moreover, discrepancies were noted at 8-10 Hz, 8-12 Hz, and 10-12 Hz among the inattentive and hyperactive subtypes[18].
Many different methods have been proposed for ADHD classification, as summarized below. Khare et al[19] proposed an ADHD-detection model based on EEG signals from 61 individuals with ADHD and 60 control subjects. Using Hilbert transform-based variational mode decomposition and an extreme learning machine classifier, they achieved an accuracy of 99.95% using 512 pre-processed samples. However, their work was tested on a small dataset. Einizade et al[20] employed graph-learning methods to detect ADHD in children, achieving an accuracy of 93.47% using EEG signals collected from 37 participants with ADHD using a 19-channel device. A key limitation of their study is the relatively small dataset, which may constrain the generalizability of the findings. Guney et al[21] developed a method for exploring attention process differentiation using machine learning (ML) techniques. In their proposed method, EEG signals from 65 adults with ADHD were analyzed, yielding an accuracy of 84.80% across 580 samples. The primary limitations of their study include the relatively modest accuracy and the small dataset size. Zheng et al[22] conducted a review of video games designed to aid in the diagnosis and treatment of children with ADHD. They summarized various game-based tools developed for ADHD detection and evaluated their advantages and limitations. The authors emphasized the importance of considering the risk of gaming addiction in children and noted that such games should remain simple rather than overly complex. Holker and Susan[23] proposed an ADHD-detection approach using quantitative EEG signals from 61 individuals with ADHD and 60 control subjects. They reported an accuracy of 81.82%. A key limitation of their study is the relatively low accuracy of the model. Chen et al[24] used a convolutional neural network (CNN) for ADHD detection utilizing EEG signals from 57 control subjects and 50 individuals with ADHD. They attained an accuracy rate of 94.67%, but the work is computationally complex. Boroujeni et al[25] conducted a nonlinear analysis of EEG signals for ADHD detection. They evaluated EEG data from 76 participants (26 controls and 50 individuals with ADHD) and achieved an accuracy of 96.05% using a support vector machine classifier. A primary limitation of their study is the relatively small dataset. Pedrollo et al[26] analyzed EEG signals from 243 patients to detect ADHD subtypes. Using a spiking neural network approach, they achieved an accuracy of 72.00%. The primary limitation of their method is its relatively low accuracy. TaghiBeyglou et al[27] presented an ADHD-diagnosis method using EEG signals and a common spatial pattern approach, achieving an accuracy of 83.33% with a k-nearest neighbors (kNN) classifier. Cosmaz et al[28] proposed another EEG-based ADHD detection study involving 33 participants. (15 individuals with ADHD and 18 controls). The highest accuracy was obtained as 96.526%. Bansal et al[29] proposed a diagnostic method for ADHD using EEG data from 121 participants, 61 diagnosed with ADHD and 60 healthy controls. Their highest reported accuracy was 99.42% using a ResNet-based model. Hassan and Singhal[30] proposed a CNN architecture using EEG signals for the classification of ADHD, achieving 100% accuracy with all 19 EEG channels and 99.08% accuracy with 5-channel EEG data. Latifi et al[31] proposed a deep neural network-based method for ADHD detection using EEG signals. Their dataset consisted of 121 participants, and they achieved an accuracy of 99.17%. Cura et al[32] conducted an ADHD-diagnosis study using EEG signals collected from 15 children with ADHD and 18 healthy controls. Their proposed approach, which achieved its highest performance with a support vector machine classifier, reached classification accuracies ranging from 96.6% to 99.9%. Mondal et al[33] designed a model for ADHD diagnosis using EEG data from 61 children, including both boys and girls. Their proposed model achieved an accuracy of 97.96%. Chugh et al[34] used two datasets for their proposed ADHD-diagnosis study, containing 61 and 9 people, respectively. Their highest accuracy, 98.95%, was achieved with the smaller dataset of 9 participants. Mao et al[35] conducted a study using EEG data from 61 children diagnosed with ADHD and reported a maximum accuracy of 99.58% using the CatBoost classifier. Jahani et al[36] employed a dataset of 121 participants and achieved an accuracy of 98.6% with a modified CNN model. Ranjan et al[37] aimed to diagnose ADHD using functional-connectivity features derived from EEG data; their dataset included 61 children with ADHD (48 boys, 13 girls) and 60 healthy controls. Using a pre-trained CNN model, they achieved an accuracy of 96.12%. Pappula and Anwar[38] performed time-frequency analysis to extract features for ADHD classification, generating fixed-size spectrogram images for each segment and classifying them with a CNN architecture. Their dataset consisted of 61 children with ADHD and 60 healthy controls, and their model achieved an overall F1 score of 90.00%.
ML is a major global research “hot topic”[39-41]. Advanced ML models are increasingly being applied to solve complex problems, including those in the biomedical domain, where they are used to develop intelligent assistants for healthcare professionals[42]. In general, ML models have been widely used to diagnose medical conditions, particularly through the analysis of medical images and signals[43,44]. Among these signals, EEG remains one of the most commonly used diagnostic tools. However, collecting EEG signals to build datasets for ML applications is difficult[45]. In particular, datasets focused on ADHD diagnosis tend to be relatively small, creating a barrier to developing accurate and reliable automatic detection models. To address this limitation, we collected a large ADHD EEG dataset and designed a robust feature-engineering framework to evaluate it.
Our method evaluates the dataset through both channel-wise analysis and a fusion-based approximation strategy. We drew inspiration from deep learning techniques to develop an explainable feature engineering (XFE) method. Our proposed approach is based on information fusion, incorporating both statistical and textural feature-extraction algorithms to generate a comprehensive feature set. We introduce a new textural feature extractor that generates ternary features to construct the feature vector. Because feature-engineering models typically reply on feature-selection mechanisms, we employed an effective method called neighborhood component analysis (NCA)[46] to identify the most informative features. In the classification phase, kNN[47] was used to assess the high classification abilities of the selected features, and single-channel results were reported. We then applied an iterative post-processing strategy using mode function-based majority voting to construct the optimal model. Additionally, this work presents the final optimized model as well as an analysis of the contributions of each component used in the proposed framework.
Contributions: To overcome identified barriers in the automatic diagnosis of ADHD, we compiled a large dataset of over 7000 EEG signals to depict ADHD results. We developed an accurate EEG ADHD diagnostic model with over 99% classification accuracy.
Innovations: We present a new generation combination-based ternary feature extractor, named the combination ternary pattern (CTP). Furthermore, we present a novel wavelet transformation model, named the twin wavelet transform (TWT).
We retrospectively studied the EEG data of 287 patients who attended the Firat University Pediatric Neurology Department, Firat University Hospital between 01/01/2020 and 10/30/2022 and underwent clinically indicated EEG. At the end of the diagnostic process, 137 patients (mean age 7.86; Male: 88 Female: 49) had a confirmed ADHD diagnosis by psychiatrists, while 150 individuals (mean age: 9.18; Male: 82, Female: 68) with neither a confirmed diagnosis of ADHD nor other neurological, neurodevelopmental or neuropsychiatric conditions served as controls (Table 1). The pediatric neurology report indicated no significant findings in the control group. A pediatric neurologist labeled the EEG signals. The Ethical Committee of Firat University (No. 2023/02-02) granted the study’s approval. In this study, ADHD was diagnosed by psychiatrists using standard clinical procedures. Each child in the ADHD group received a full psychiatric assessment, including clinical interviews, behavioral evaluations, and ADHD-specific rating scales. Only children with a confirmed diagnosis were included. The control group consisted of children referred to the Pediatric Neurology Department for routine EEG examinations. They had no history of neurological, developmental, or psychiatric disorders. Their medical reports confirmed normal findings, and all EEG recordings were within normal limits. Therefore, the control group represented healthy children without clinical abnormalities.
| Type | Female | Male | Total | Age (mean ± SD) |
| ADHD | 49 | 88 | 137 | 7.86 ± 3.28 |
| Control | 82 | 68 | 150 | 9.18 ± 2.34 |
EEG signals were collected using 20 channels at a sampling frequency of 500 Hz with the same device in all patients under resting conditions. EEG recordings were obtained in both resting-state and sleep-state conditions, with each session lasting at least 30 minutes. A digital, PC-based EEG system with Windows 11 operating system was used. The device included 20 referential EEG channels, supported all modern technical updates, and allowed simultaneous display of up to 128 EEG traces on a high-resolution monitor. Artifact handling was performed at the clinical stage. Obvious artifacts such as movement and eye-blinks were removed, and recordings with heavy artifacts were excluded from the dataset. The signals included in the analysis were original EEG recordings, and no additional preprocessing was applied beyond artifact removal and segmentation. EEG signals were divided into 30-second segments, which yielded 2624 and 4775 samples in the ADHD vs control groups, respectively.
The model integrates two key innovations: The CTP and the TWT. CTP is a novel textural feature extractor that generates ternary values from overlapping signal blocks and creates histograms, producing a 486-length feature vector. This enables the capture of local textural patterns in EEG signals beyond conventional binary-based approaches. On the other hand, TWT is a multilevel signal decomposition method that generates 13 low-pass wavelet bands from each EEG channel. By combining TWT-based decomposition with CTP and statistical feature extraction, the model creates a multilevel hybrid feature engineering structure that mimics deep learning while remaining computationally lightweight. Together with NCA for feature selection and kNN classification, these methods yielded channel-wise accuracy up to 99.12% and an overall accuracy of 99.97% using iterative majority voting (IMV). The explainability arises from the ability to identify the features and channels that contributed most to the classification outcome.
Our model was comprised of four layers: Multilevel hybrid feature generation, feature selection, classification, and fusion (Figure 1). Channel-wise EEG signals were decomposed using a novel TWT into 13 low-pass filter wavelet bands. In addition to the original signal, these were each fed to CTP-based textural and statistical feature extractors to calculate 486 and 40 features, respectively, which were concatenated. A total of 14 extracted feature vectors, each of length 526 (= 486 + 40), were generated that were concatenated into a final feature vector of length 7364 (= 526 × 14). Dimensionality was reduced to the most informative 263 features using NCA. The features were then input to a shallow kNN to obtain the channel-wise prediction vector. Twenty predictor vectors were generated per 20-channel EEG sample, and IMV[48] was applied to generate voted results. The result with the maximum accuracy among the 20 predictions and 18 voted vectors was chosen with a greedy algorithm. Individual features and channels contributing to the best result were identifiable at every layer, adding to model explainability.

To emulate the performance of deep models, we have developed a multilevel hybrid feature engineering architecture. This architecture combines TWT-based signal decomposition with hybrid feature extraction, utilizing a novel CTP and statistical moments for textural and statistical feature generation. Our work presents a novel feature engineering model, which includes two new methods proposed in this section: TWT decomposition, a novel approximation of the discrete wavelet transform, and a combination-based feature extraction function.
TWT: In the novel TWT, a two-sided mother wavelet band transform was applied to the channel-wise signal to create a wavelet tree with two branches, from which the low-pass filter bands were selected for downstream feature extraction (Figure 2). This process is described mathematically in equation 1 below:
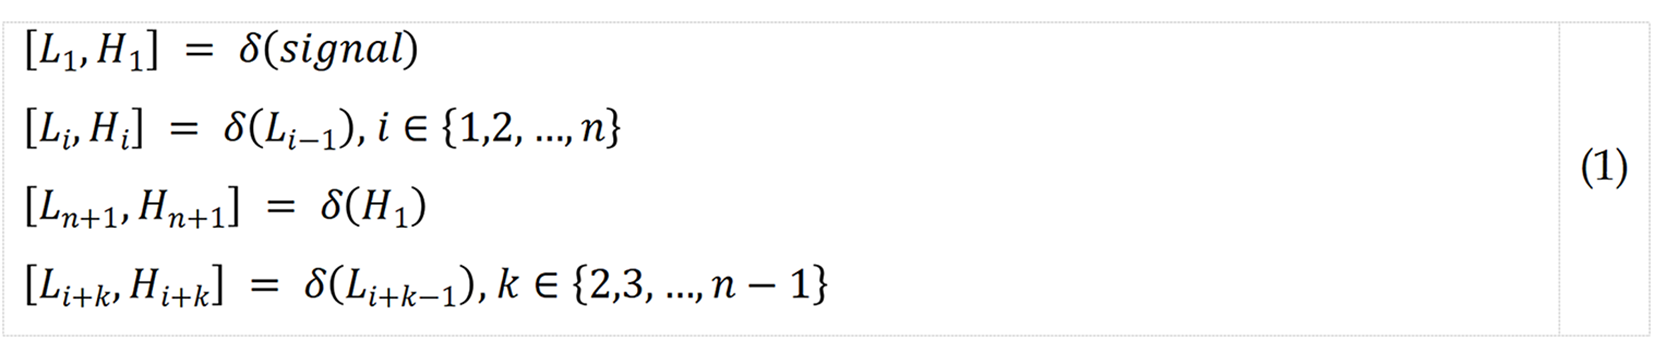

where δ(.) is the discrete wavelet transform function; H, high-pass filter band; L represents low-pass filter band; and n; number of levels. In this work, we set n = 7, as 13 (= 2 × 7 - 1) low-pass filter wavelet bands were selected.
After testing Daubechies-4, Haar, and Coiflet wavelets, we proceeded with the Symlet-4 wavelet filter because it delivered the most stable decomposition with minimal boundary distortion and maintained both time and frequency details important for EEG analysis. Edge effects during decomposition were minimized using symmetric reflection at the boundaries, which is a standard practice in wavelet-based EEG signal processing. The computed band using a sample EEG signal is shown in Figure 3 and the frequency bands of wavelet decomposition are shown in Figure 4.


Each subplot shows the temporal signal at one decomposition level: Level 1 (125-250 Hz), Level 2 (62.5-125 Hz), Level 3 (31.3-62.5 Hz), Level 4 (15.631.2 Hz), Level 5 (7.8-15.6 Hz), and Level 6 (3.9-7.8 Hz). Time is expressed in seconds, and amplitudes are shown in original units. The wavelet decomposition in Figure 4 separates the EEG signal into distinct frequency bands, each with unique temporal and amplitude characteristics. The hierarchical use of the Symlet-4 wavelet allows clear observation of both fast and slow signal dynamics. High-frequency bands (Levels 1-2; 62.5-250 Hz) show rapid fluctuations and relatively lower amplitudes. Level 1 demonstrates strong variability, while Level 2 presents more structured oscillations. Such activity often reflects transient neural oscillations or artifacts. Mid-frequency bands (Levels 3-4; 15.6-62.5 Hz) display sustained oscillatory patterns. Level 3 corresponds to the gamma range, and Level 4 aligns with beta activity. These rhythms are typically associated with cognition and motor function. Low-frequency bands (Levels 5-6; 3.9-15.6 Hz) show the highest amplitudes and slower dynamics. Level 5 captures alpha activity, while Level 6 reflects theta activity. Both rhythms are fundamental in EEG and are linked to attention, memory, and conscious states. The progressive increase in amplitude from high to low frequencies follows the expected 1/f spectral trend of biological signals. This decomposition highlights frequency-dependent features that are not visible in the raw signal. Identifying such patterns is valuable for linking specific frequency ranges with physiological or clinical conditions.
Statistical feature extraction: Forty statistical features were extracted by applying to the raw signal and its absolute value the following 20 statistical moments[49]: Log entropy, standard deviation, maximum, energy, minimum, Shannon entropy, variance, median, mode, range, root mean square, skewness, kurtosis, norm entropy, tsallis entropy, quartile range, sure entropy, threshold entropy, Higuchi, and wavelet entropy.
CTP-based textural feature extraction: We have developed a novel feature extraction function that we name CTP. Its essential objective is to use the power of the combination to extract features because the local binary pattern-like feature extractors have generated features using a fixed pattern. Figure 5 showcases a graphical overview of the developed pattern for enhanced elucidation. The CTP-based model extracted ternary values from overlapping signal blocks of length 5 using three logic operators: <, =, and >. Detailed steps of CTP feature extraction S1 to S5 corresponding to equations 2 to 6, respectively are given below.

S1: Create overlapping blocks, each of length 5.

where w describes the overlapping block, and S and ℓ are the EEG signal and its length, respectively.
S2: Generate ternary values by deploying combination.
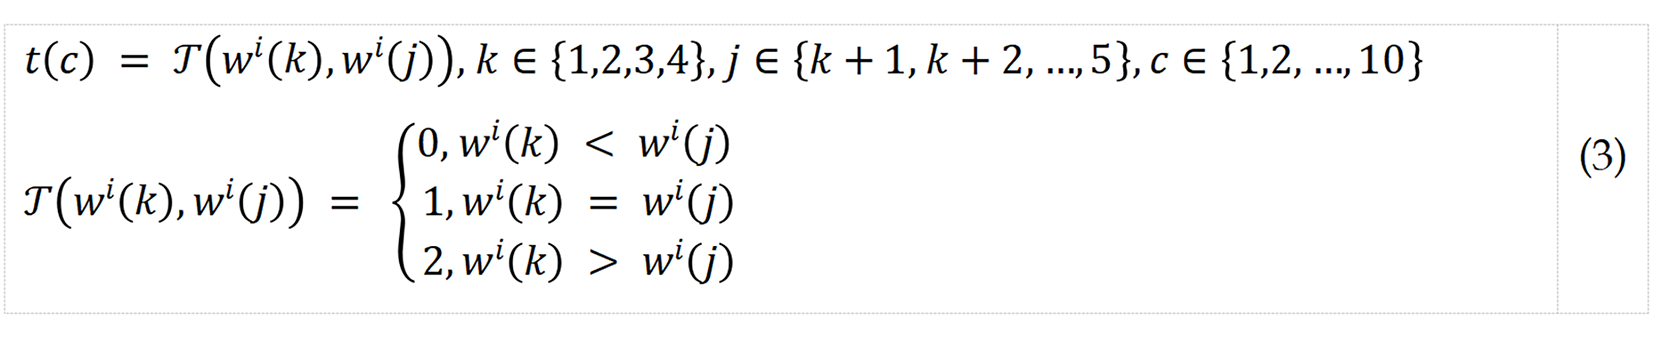
where t represents ternary value; and T() represents ternary value generation function. Ten ternary values were extracted.
S3: Create two signals by dividing the extracted ternary values into two equal parts.
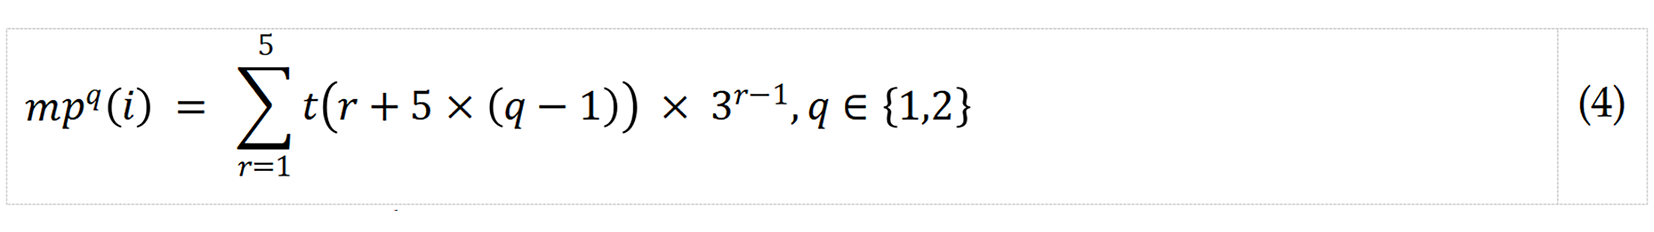
where mpq is the qth feature map signal.
S4: Extract histograms of the generated signal by deploying ternary values.

where h represents histogram vector, each of length 243 (= 35); and η(), histogram generation function.
S5: Merge the generated histograms into a feature vector.

where f describes the feature vector of length 486 (= 243 × 2).
Proposed model: All four layers of the model were parametric, and the overall model was self-organized by incorporating a greedy algorithm in the last layer, which automatically selected the best result (Table 2). The steps are detailed below. Step 1: Apply TWT with seven levels to generate 13 low-pass filter wavelet bands.

| Layer | Method(s) | Parameter(s) | Output(s) |
| Feature extraction | Twin wavelet transformation | Filter: Sym4; number of levels: 7 | 13 wavelet bands |
| Combination ternary pattern | Kernel: Ternary; block length: 5; pattern: Combination | Feature vector length: 486 | |
| Statistical features | 20 statistical moments | Feature vector length: 40 | |
| Concatenate features | Textural and statistical features | Feature vector length: 526 | |
| Concatenate feature vectors | Merge 14 feature vectors | Feature vector length: 7364 | |
| Feature selection | Neighborhood component analysis | Select the top informative features | Selected feature vector length: 263 |
| Classification | k-Nearest neighbors | k:1; distance: L2norm, voting: No | 20 prediction vectors |
| Post-processing | Iterative majority voting | Loop range: 3 to 20; function: Mode | 18 voted vectors |
| Greedy algorithm | Maximum accuracy | Best result |
where θ(.) represents the TWT function (we used the symlet 4 wavelet filter here).
Step 2: Extract feature vectors using CTP and statistical moments.
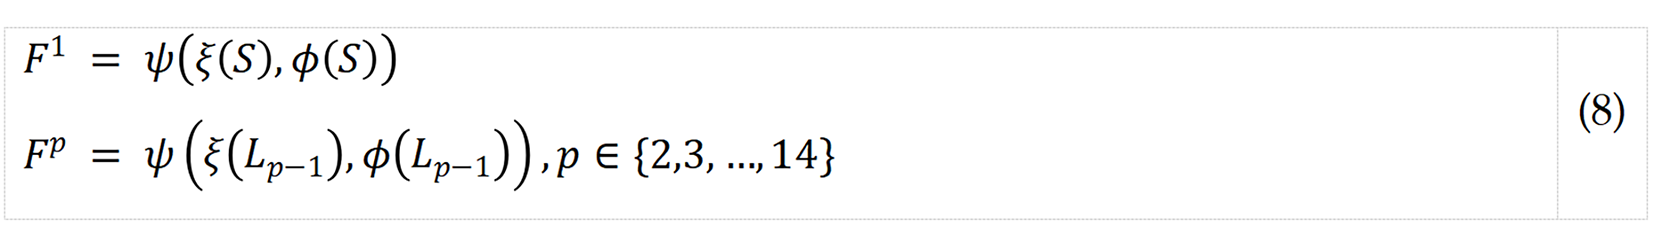
where ψ() represents the merging function; ξ() and Φ(), CTP textural feature and statistical feature extraction functions, respectively, which extract 486 and 40 features’ and F, the merged feature vector of length 526 (= 486 + 40).
Step 3: Concatenate the extracted feature vectors into a final feature vector.

where X presents the final feature vector of length 7364 (= 526 × 14).
In this case, the L1 norm distance-based fitness function is selected to calculate the importance of each feature in the dataset. This involves measuring the absolute differences between feature values for each data point. Features with high weights are deemed valuable and informative, while features with low weights are deemed redundant and less informative. After assigning the weights to all features, they are sorted based on their importance, and the most informative features are selected for further analysis. This process effectively reduces the dimensionality of the dataset, which can help improve the accuracy and efficiency of ML models. NCA represents a supervised learning algorithm designed to enhance the classification accuracy of a given model by transforming input features into a space that promotes discrimination. By minimizing distances among data points belonging to the same class and concurrently maximizing distances between data points from distinct classes, the algorithm strives to achieve optimal results. NCA stands as a prominent choice for feature selection, often referred to as the feature selection variant of the kNN.
We did not set the NCA dimension arbitrarily; instead, we selected the final dimension by a validation curve. On each training fold, we swept the number of retained features (d) over a broad range (approximately 50-2000; denser near 200-400). For each d, we trained the NCA-weighted kNN on the inner-training data and evaluated on the inner-validation data. The validation curve reached a clear plateau in the interval of 240-300 features. We then chose d = 263 as the elbow point that achieved the first plateau with no meaningful gain (< 0.1% accuracy) for larger d. We repeated this procedure across folds to avoid test leakage. Performance remained stable for any d in 240-300, and 263 provided the best accuracy-parsimony balance.
This rule makes the choice reproducible: Choose the smallest d whose mean inner-cross-validation (CV) accuracy is within 0.1% of the maximum and whose variance does not decrease further.
Step 4: Apply NCA to choose the top 263 from among 7364 extracted features.
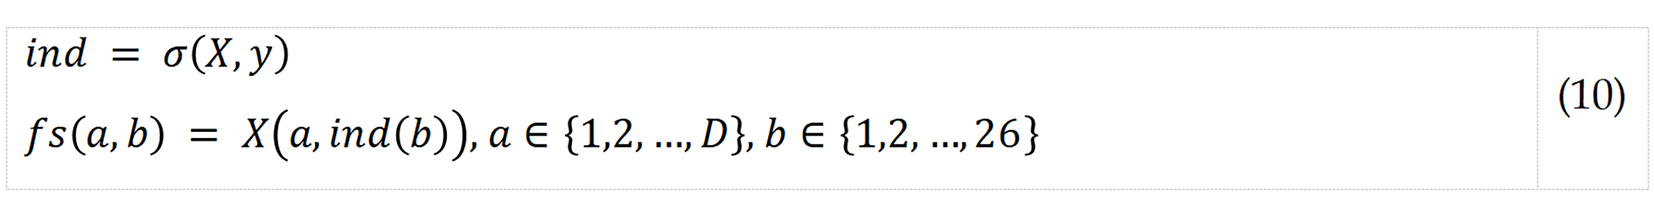
where σ(.,.) represents NCA function; fs, selected feature vector; D, number of observations; y, real outputs/Labels; and ind, sorted index generated by NCA.
The kNN algorithm identifies the k-nearest data points in the training dataset to the new data point under classification. Subsequently, it leverages the class labels associated with those k nearest neighbors to determine the class label for the new data point. A distance metric, such as the Euclidean distance, is then employed to compute the distance between the new data point and each training data point. The Euclidean distance quantifies the straight-line distance between two points within a multidimensional space. Using a 10-fold CV means that the dataset was split into ten equally sized subsets and the algorithm was trained and tested on each subset in turn. This helps to reduce the risk of overfitting the model to the training data and provides a more accurate estimate of the algorithm’s performance on new, unseen data.
The attributes of the kNN classifier are specified as follows: (1) k: This refers to the number of nearest neighbors to consider when making a prediction. In this case, k is set to 1, meaning only the closest data point is considered; (2) Distance: This specifies the distance metric to use when calculating the distances between data points. In this case, Euclidean distance is used; and (3) Voting: This specifies the method used to determine the class label of the new data point based on the class labels of its k nearest neighbors. In this case, the “none” option is chosen, which means that the class label with the highest frequency among the k nearest neighbors is selected as the predicted class label.
Step 5: Classify selected features using kNN with a 10-fold cross-validation (CV).

where κ() represents kNN classifier; and pr, kNN-generated prediction vector.
Step 6: Iterate Steps 1 to 5 for all channels. Twenty prediction vectors were calculated for each 20-channel EEG signal input.
The 20 channel-wise prediction vectors were sorted by accuracy, after which IMV[48] was applied to generate mode function-based voted vectors using a loop range of 3 to 20. Thus, 20 – 3 + 1 = 18 voted vectors were created. The most accurate voted vector by generating IMV was chosen as the final result to represent the best overall model performance.
Step 7: Apply IMV to the 20 channel-wise prediction vectors to calculate voted vectors.
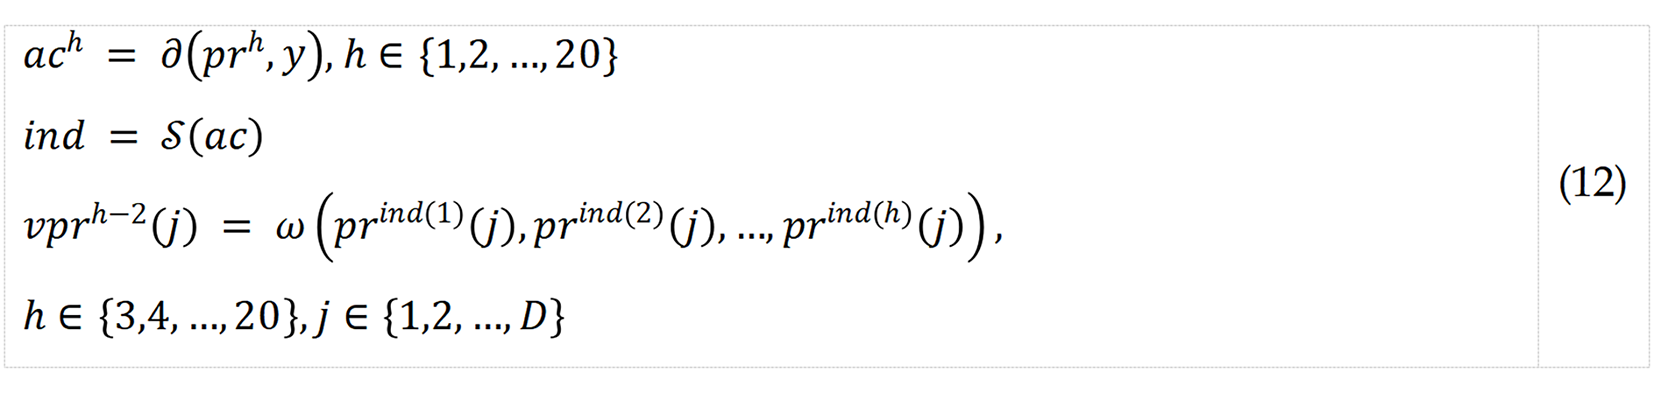
where ac represents calculated accuracy; ∂(.), accuracy calculation function; ind, qualified index; S(), sorting function; νpr, voted vector; and ω(), mode function.
Step 8: Calculate the best result from among the voted vectors.
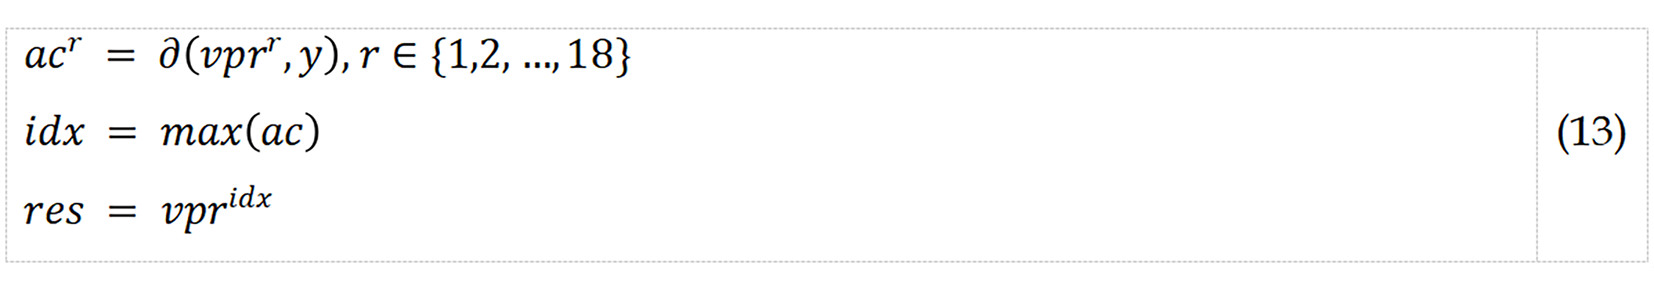
where idx represents the index of the voted vector with the best classification accuracy; and res represents the final result.
Channel-wise and post-processed overall model performance were evaluated using standard metrics: Accuracy, sensitivity, and specificity. On a 10-fold CV, excellent channel-wise results were attained across all channels, with maximum accuracy, sensitivity, and specificity of 99.12%, 98.78% and 99.43% seen on channels 8, 10, and 11, respectively (Table 3). After applying IMV on the 20 kNN-calculated prediction plus incremental iterations of voted vectors, overall model performances exceeded 99% of classification accuracies, sensitivities, and specificities. Maximum model accuracy was attained at the sixth iteration (Table 4), which deployed eight additional voted vectors calculated from (in descending order of accuracy) channels 8, 5, 9, 19, 6, 11, 17, and 1, which correspond to the following channels: P4, C3, O1, Fz, C4, F7, A1, and FP1, respectively. The confusion matrices of the most accurate channel-wise and overall performances - i.e., channel 8 and the 6th IMV iteration, respectively - show low rates of misclassification (Figure 3 and Table 3). The best results’ confusion matrices have been illustrated in Figure 6. Moreover, we extracted the receiver operating characteristic (ROC) curve, and the generated ROC curve is shown in Figure 7. The curve shows an area under the curve of 0.9997, indicating almost perfect discrimination between the ADHD and control groups. The red circle marks the operating point reported in the paper (true positive rate = 0.9996, false positive rate = 0.0002), while the green square shows the optimal threshold based on Youden’s J statistic (J = 1.000). The black asterisk represents the theoretical perfect classifier at point (0,1). These results confirm that the model provides both very high sensitivity and very high specificity for ADHD detection.


| Channel | Acc | Sen | Spe | Channel | Acc | Sen | Spe |
| 1 | 98.92 | 98.32 | 99.25 | 11 | 98.96 | 98.09 | 99.43 |
| 2 | 98.55 | 97.79 | 98.97 | 12 | 98.72 | 97.79 | 99.23 |
| 3 | 98.86 | 98.17 | 99.25 | 13 | 98.91 | 98.32 | 99.23 |
| 4 | 98.53 | 97.79 | 98.93 | 14 | 98.77 | 97.79 | 99.31 |
| 5 | 99.08 | 98.51 | 99.39 | 15 | 98.80 | 98.09 | 99.18 |
| 6 | 98.96 | 98.32 | 99.31 | 16 | 98.82 | 98.06 | 99.25 |
| 7 | 97.99 | 96.65 | 98.72 | 17 | 98.93 | 98.48 | 99.18 |
| 8 | 99.12 | 98.74 | 99.33 | 18 | 98.69 | 98.17 | 98.97 |
| 9 | 99.08 | 98.59 | 99.35 | 19 | 99.04 | 98.63 | 99.27 |
| 10 | 98.91 | 98.78 | 98.97 | 20 | 98.82 | 98.06 | 99.25 |
| Iteration | Acc | Sen | Spe | Iteration | Acc | Sen | Spe |
| 1 | 99.70 | 99.39 | 99.87 | 10 | 99.96 | 99.92 | 99.98 |
| 2 | 99.82 | 99.92 | 99.77 | 11 | 99.92 | 99.81 | 99.98 |
| 3 | 99.89 | 99.77 | 99.96 | 12 | 99.95 | 99.89 | 99.98 |
| 4 | 99.96 | 100 | 99.94 | 13 | 99.95 | 99.89 | 99.98 |
| 5 | 99.96 | 99.89 | 100 | 14 | 99.95 | 99.89 | 99.98 |
| 6 | 99.97 | 99.96 | 99.98 | 15 | 99.95 | 99.85 | 100 |
| 7 | 99.93 | 99.85 | 99.98 | 16 | 99.93 | 99.85 | 99.98 |
| 8 | 99.97 | 100 | 99.96 | 17 | 99.93 | 99.81 | 100 |
Our proposed model used NCA to select from concatenated statistical and novel CTP-based textural features extracted from multi-channel EEG segments, as well as their corresponding TWT-decomposed wavelet bands, which yielded excellent channel-wise and overall model classification performances using kNN and IMV, respectively. As the dataset contained an unbalanced class, balanced accuracy (the mean of sensitivity and specificity) is calculated as 99.97%.
Besides textural features, statistical EEG signal/wavelet band features were found to be significant contributors to the overall performance of our model. The dataset we used contained 20 channels, resulting in a total of 5260 selected features (= 263 × 20). Our feature analysis revealed that out of the selected features, 1966 were statistical and the remaining 3294 were textural. Therefore, statistical features accounted for approximately 37.4% of the selected features, while the remaining 62.6% were textural features. These results suggest that textural features are more effective than statistical features in solving the ADHD detection problem using EEG signals. To further explore the effectiveness of our features, we generated 14 feature vectors from the raw EEG signal and 13 low-pass filters through TWT. When analyzing the 263 features in the selected feature vector of the most accurate channel (Channel 8), we observed varying relative proportions of statistical and textural features chosen across the input raw signal and 13 wavelet bands (Figure 8A). The 8th wavelet band, L8, followed by the raw signal, was associated with the most selected features, i.e., 38 and 34, with predominant textural and statistical feature contributions, respectively (Figure 8A).

From the 7364 candidates, NCA retained 263 features: 62.6% textural (CTP-based) and 37.4% statistical. We examined the NCA weights and confirmed the following patterns: (1) Most selected features came from low-frequency TWT bands that correspond to theta-alpha activity. This is consistent with ADHD literature that highlights altered low-frequency dynamics; (2) The highest-weighted CTP codes were bins that encode monotonic rises/falls and short plateaus within local windows. These bins capture slow waveform transitions and amplitude instabilities rather than sharp spikes; (3) The top statistical contributors were wavelet entropy, variance, root mean square, and skewness computed on the same low-frequency bands and on the raw signal. Wavelet entropy and variance indicate irregularity and energy distribution; root mean square reflects overall amplitude; skewness captures asymmetry in the waveform; and (4) The model relies on features that summarize low-frequency irregularity and amplitude modulation across channels. This aligns with clinical observations of atypical theta/alpha dynamics in ADHD. Thus, the XFE pipeline remains explainable at the feature level (which moments and which CTP codes) and at signal-band level (which TWT bands). We added a validation-curve figure (dimension d vs inner-CV accuracy) and a ranked list of the top-20 features with NCA weights (CTP bin ID or moment name with its TWT band). These items make the selection rule and the main contributors transparent and reproducible.
To demonstrate the robustness and utility of TWT-enabled multilevel hybrid feature extraction and downstream NCA-based feature selection, we compared five ablation models with various elements of our base model removed: (1) Case 1: Raw EEG signal input without TWT-decomposition; only statistical feature extraction; no NCA-based feature selection; (2) Case 2: Raw EEG signal input without TWT-decomposition; only CTP-based textural feature extraction; no NCA-based feature selection; (3) Case 3: Raw EEG signal and TWT-decomposed wavelet band inputs; only CTP-based textural feature extraction; NCA-based feature selection; (4) Case 4: Raw EEG signal and TWT-decomposed wavelet band inputs; only statistical feature extraction; NCA-based feature selection; and (5) Case 5: Raw EEG signal and TWT-decomposed wavelet band inputs; hybrid CTP-based textural and statistical feature extraction; feature selection using NCA.
As shown in Figure 4, we used channel 8 as input, as it was the most accurate, and fed the outputs of the five ablation models to kNN as well as bagged tree classifiers. Case 5, our base model that retained TWT-based signal decomposition, hybrid feature extraction, and NCA-based feature selection, delivered excellent channel-wise accuracy rates for both kNN and bagged tree classifiers with a 10-fold CV (Figure 8B). However, removing hybrid feature extraction degraded model performance (Cases 3 and 4); further removing TWT and NCA caused even more serious performance deterioration (Cases 1 and 2). Per Figure 8B, the best resulting case is our proposed Case 5, and we have used the best combination to get high classification performance.
We performed a nonsystematic review of published models of ADHD detection. With an overall 99.97% accuracy, our self-organized model outperformed these prior models (Table 5)[24,50-63]. Moreover, our dataset comprised the largest number of subjects and study samples compared to previous studies. Table 5 lists various ML models used for classification tasks. Most of the models presented in the table use deep learning techniques and have been trained on smaller datasets. In contrast, our developed model is handcrafted and uses feature engineering techniques. Our model has achieved an exceptional classification performance with over 99.9% accuracy in diagnosing ADHD using EEG signals. This study introduces a competitive approach to deep learning for ADHD diagnosis using EEG signals. Moreover, we compared the proposed model was compared with deep learning baselines. While kNN served as the shallow classifier, we also tested a one-dimensional convolutional neural network and a bidirectional long short-term memory network (BiLSTM), as shown in Figure 9. Figure 8A shows the best channel-wise results under 10-fold CV. Our proposed XFE model achieved 99.12% accuracy, which is higher than the accuracies of both the one-dimensional convolutional neural network (95.12%) and BiLSTM (93.93%). The difference demonstrates that a handcrafted and explainable feature-engineering pipeline can outperform standard deep learning baselines on the same dataset. While CNNs and LSTMs are capable of modeling temporal EEG dynamics, they require large data and careful tuning to reach optimal performance. In contrast, the proposed model remains compact, computationally efficient, and interpretable while still providing superior accuracy. This supports the claim that XFE is a competitive alternative to deep learning for ADHD detection.

| Ref. | Method(s) | Classifier | Subjects | Samples | Channels | Split ratio | Results |
| Nouri et al[50], 2023 | Layer-wise relevance propagation, CNN | Softmax | 31 ADHD; 30 controls | 656 | 19 | 5-fold CV | Acc: 92.45; Sen: 93.06; Spe: 98.10 |
| Chen et al[24], 2019 | CNN | Softmax | 50 ADHD; 51 controls | 4545 | 32 | 90:10 | Acc: 94.67 |
| Sharma et al[51], 2023 | MEMD, GA, MEWT, multivariate empirical-basis decomposition approaches, NCA | ANN | 61 ADHD; 60 controls | 7983 | 19 | 5-fold CV | Acc: 96.16; F1: 96.32; MCC: 0.92 |
| Cura et al[52], 2023 | Intrinsic time-scale decomposition | Bagged tree | 15 ADHD; 18 controls | 198 | 12 | 10-fold CV | Acc: 99.46; Sen: 99.47; Spe: 99.47 |
| Barua et al[53], 2022 | Ternary motif pattern, TQWT, NCA | kNN | 61 ADHD 60 Controls | 4173 | 14 | 10-fold CV | Acc: 95.57; GM:95.18 |
| Tor et al[54], 2021 | EMD, DWT | kNN | 45 ADHD; 62 ADHD + CD; CD 16 | 5000 | 12 | 10-fold CV | Acc: 97.88; Sen: 96.68; Spe: 100 |
| Tosun[55], 2021 | LSTM, PSD | SVM | 8 ADHD; 8 controls | 4352 | 16 | 80:20 | Acc:92.15; Sen: 90.95; Spe: 93.43 |
| Moghaddari et al[56], 2020 | Deep CNN | Softmax | 31 ADHD; 30 controls | 328 | 19 | 5-fold CV | Acc: 98.48; Rec:98.48; F1:98.49; Pre: 98.51 |
| Kaur et al[57], 2020 | Phase space reconstruction | SVM | 47 ADHD; 50 controls | Not specified | 19 | 69:31 | Acc: 93.30; Sen: 100; Spe: 86.70 |
| Tanko et al[58], 2022 | 8-pointed star pattern learning network | kNN | 61 ADHD; 60 controls | Not specified | 19 | 10-fold CV | Acc: 97.19; Rec: 97.12; Pre: 97.18; F1: 97.15 |
| García-Ponsoda et al[59], 2024 | Independent component analysis process | XGBoost | 61 ADHD; 60 controls | 128 samples per second | 19 | 5-fold CV | Acc: 86.10 |
| Mercado-Aguirre et al[60], 2025 | Ridge Regression, Independent Component Analysis | SVM | 22 ADHD; 25 controls | 800 ms (100 samples) | 6 | 5-fold CV | Acc: 86.36; Sen: 95.45 |
| Colonnese et al[61], 2025 | Hyperdimensional Computing with a spatio-temporal encoder | ADHDC (HDC) | 37 ADHD; 42 controls | 7168 | 14 | 75:25 | Acc: 88.90; F1: 87.50; Rec: 90.40 |
| Cai et al[62], 2025 | Phase space reconstruction | kNN | 61 ADHD; 60 controls | Not specified | 19 | 80:20 | Acc: 78.27; Sen: 80.62; Spe: 75.63 |
| Alhussen et al[63], 2025 | Discrete Cosine Transform- Independent Component Analysis, rhinofish optimization, AttentionNet | Softmax | (1) 17 ADHD; 17 controls; (2) 51 ADHD; 52 controls | Not specified | 25 | 5-fold CV | (1) Acc: 97.89; (2) Acc: 98.52 |
| Our study | Twin wavelet transformation, combination ternary pattern, NCA, iterative majority voting | kNN | 137 ADHD; 150 controls | 7399 | 20 | 10-fold CV | Acc: 99.97; Sen: 99.96; Spe: 99.98 |
Feature engineering involves selecting and transforming relevant features from the raw input data to improve the model’s performance. On the other hand, deep learning uses neural networks to learn and automatically extract features from raw data. The study suggests that our handcrafted model can achieve competitive results in ADHD diagnosis using EEG signals compared to deep learning models.
We have highlighted the advantages and limitations of our work, as discussed below.
Findings: Our results demonstrate that the proposed model achieved very high classification performance. Accuracy reached 99.12% using a single EEG channel, and this improved to 99.97% when we applied IMV across all channels. This indicates that fusing channel-level information substantially enhances diagnostic reliability. An important observation is the contribution of specific EEG channels to the classification results. The most informative channels were identified as P4, C3, O1, Fz, C4, F7, A1, and FP1, suggesting that both frontal and parietal regions contain critical patterns that differentiate ADHD patients from controls. These findings align with known neurocognitive roles of these brain regions in attention and impulse control. The feature analysis also provides meaningful insights. Among the selected features, 62.6% were textural features extracted by the proposed CTP, while 37.4% were statistical. This highlights the stronger discriminative ability of textural signal characteristics in ADHD detection, while statistical features remain important in providing complementary information. The TWT decomposition played a key role in improving performance. In particular, the eighth wavelet band (L8) and the raw EEG signal contributed the largest proportion of selected features, showing that multilevel decomposition captures additional patterns beyond the raw input and provides complementary diagnostic information. Robustness of the proposed framework was further confirmed through ablation studies. When statistical or textural features were removed, or when TWT decomposition was excluded, classification accuracy dropped significantly. These comparisons demonstrate that the hybrid multilevel feature engineering framework - combining statistical, textural, and decomposed signal features - was the optimal approach. Finally, when benchmarked against previously published EEG-based ADHD detection methods, our model outperformed even deep learning-based approaches while remaining computationally lightweight. Importantly, the model retains explainability, as it provides both channel-wise and feature-level interpretation. This transparency makes the approach more suitable for medical applications, where clinicians must understand which EEG patterns contribute to diagnostic outcomes.
Advantages: We have acquired the largest EEG ADHD dataset. Our approach combines handcrafted textural and statistical features, including innovative components such as TWT-based wavelet decomposition and textural feature extraction using a combination of ternary function-based extraction kernel. Our full model demonstrates excellent performance, with channel-wise classification accuracies exceeding 98% and an overall model accuracy of 99.97%. Ablation models lacking specific elements, such as textural or statistical features, TWT signal decomposition, and/or NCA feature selection, show diminished accuracies, supporting our choice of model composition and parameter settings. Our model possesses a cognitive architecture with linear complexity and computational lightweight and outperforms published ADHD detection models, including deep learning models. We did not attempt metaheuristic optimization. Our study included EEG recordings from 137 ADHD patients and 150 control subjects, yielding more than 7000 EEG segments after preprocessing. While the number of participants is modest compared with the global prevalence of ADHD, it is still among the largest subject-level EEG datasets used for ADHD detection to date. Previous studies have typically relied on much smaller groups, often fewer than 100 participants. Importantly, our model was designed to be channel-wise and explainable, enabling feature-level and channel-level analysis rather than relying only on aggregated samples.
We acknowledge that larger, multicenter datasets will be necessary to ensure broader generalizability and clinical translation. Nevertheless, our results provide strong evidence that carefully engineered features combined with rigorous CV can achieve highly accurate classification even with a moderate number of participants. This study should therefore be viewed as a step toward scalable, objective diagnostic tools rather than as a final clinical solution.
Limitations: Our study and others (Table 5) performed k-fold CV, an established standard that has limitations when accounting for subject-specific data. We used tenfold CV to show comparative results. Using a more rigorous leave-one-subject-out CV (LOSO CV) method, we obtained a modest 75% channel-wise classification accuracy.
Future work: The LOSO CV method serves as a clinically useful validation technique that replicates the situation of encountering new patients. The model reached 99.97% accuracy during 10-fold CV testing, yet its performance dropped to 75% when evaluated using LOSO because of both high inter-subject EEG variability and strong signal pattern dependence within subjects. The team will use subject-invariant normalization together with domain adaptation methods and ensemble learning strategies to improve model performance in actual clinical practice. The validation process will move to multiple centers to test the model across different patient characteristics and equipment types, which will enhance its general use and minimize site-specific errors.
The diagnosis of ADHD is a crucial area of research in ML due to its high prevalence and impact worldwide. While most studies have focused on diagnosing ADHD through EEG signals, progress has been hindered by the use of relatively small datasets. We collected a large dataset to address this limitation and developed a novel ADHD diagnostic model, the Self-Organized Feature Engineering model. We also propose a novel combination-based textural feature extraction function called CTP and implement a multilevel feature extraction method using TWT, inspired by the structure of deep learning architectures.
Our model achieved impressive results with single-channeled and voted results calculated. The best single-channeled result yielded a classification accuracy of 99.12%, while the voted result achieved an accuracy of 99.97%. The optimal model was generated using the results of eight channels, namely channels P4, C3, O1, Fz, C4, F7, A1, and FP1, which produced the most significant results. Our findings indicate that the Self-Organized Feature Engineering model is ready for use in medical applications and has tremendous potential to improve access to rapid and accurate ADHD diagnoses globally, thus promoting equity.
| 1. | Breunig S, Lawrence JM, Foote IF, Gebhardt HJ, Willcutt EG, Grotzinger AD. Examining Differences in the Genetic and Functional Architecture of Attention-Deficit/Hyperactivity Disorder Diagnosed in Childhood and Adulthood. Biol Psychiatry Glob Open Sci. 2024;4:100307. [RCA] [PubMed] [DOI] [Full Text] [Full Text (PDF)] [Cited by in Crossref: 6] [Cited by in RCA: 8] [Article Influence: 4.0] [Reference Citation Analysis (0)] |
| 2. | Adamo N, Singh SP, Bölte S, Coghill D, Newcorn JH, Parlatini V, Purper-Ouakil D, Rausch J, Rohde L, Santosh P, Banaschewski T, Buitelaar JK. Practitioner Review: Continuity of mental health care from childhood to adulthood for youths with ADHD - who, how and when? J Child Psychol Psychiatry. 2024;65:1526-1537. [RCA] [PubMed] [DOI] [Full Text] [Cited by in Crossref: 11] [Cited by in RCA: 9] [Article Influence: 4.5] [Reference Citation Analysis (0)] |
| 3. | Magdi HM, Abousoliman AD, Lbrahim AM, Elsehrawy MG, El-Gazar HE, Zoromba MA. Attention-deficit/hyperactivity disorder and post-traumatic stress disorder adult comorbidity: a systematic review. Syst Rev. 2025;14:41. [RCA] [PubMed] [DOI] [Full Text] [Full Text (PDF)] [Cited by in Crossref: 11] [Cited by in RCA: 6] [Article Influence: 6.0] [Reference Citation Analysis (0)] |
| 4. | Jairath, B, Fosco, W, Baweja, R. Attention-Deficit Hyperactivity Disorder (ADHD). In Handbook of Psychopathology in Intellectual Disability: Research, Practice, and Policy; Springer 2024; 117-129. [DOI] [Full Text] |
| 5. | Yen JY, Ko CH, Yen CF, Wu HY, Yang MJ. The comorbid psychiatric symptoms of Internet addiction: attention deficit and hyperactivity disorder (ADHD), depression, social phobia, and hostility. J Adolesc Health. 2007;41:93-98. [RCA] [PubMed] [DOI] [Full Text] [Cited by in Crossref: 589] [Cited by in RCA: 414] [Article Influence: 21.8] [Reference Citation Analysis (0)] |
| 6. | Lange KW, Reichl S, Lange KM, Tucha L, Tucha O. The history of attention deficit hyperactivity disorder. Atten Defic Hyperact Disord. 2010;2:241-255. [RCA] [PubMed] [DOI] [Full Text] [Full Text (PDF)] [Cited by in Crossref: 286] [Cited by in RCA: 171] [Article Influence: 10.7] [Reference Citation Analysis (0)] |
| 7. | Demontis D, Walters GB, Athanasiadis G, Walters R, Therrien K, Nielsen TT, Farajzadeh L, Voloudakis G, Bendl J, Zeng B, Zhang W, Grove J, Als TD, Duan J, Satterstrom FK, Bybjerg-Grauholm J, Bækved-Hansen M, Gudmundsson OO, Magnusson SH, Baldursson G, Davidsdottir K, Haraldsdottir GS, Agerbo E, Hoffman GE, Dalsgaard S, Martin J, Ribasés M, Boomsma DI, Soler Artigas M, Roth Mota N, Howrigan D, Medland SE, Zayats T, Rajagopal VM; ADHD Working Group of the Psychiatric Genomics Consortium; iPSYCH-Broad Consortium; Nordentoft M, Mors O, Hougaard DM, Mortensen PB, Daly MJ, Faraone SV, Stefansson H, Roussos P, Franke B, Werge T, Neale BM, Stefansson K, Børglum AD. Genome-wide analyses of ADHD identify 27 risk loci, refine the genetic architecture and implicate several cognitive domains. Nat Genet. 2023;55:198-208.. [RCA] [PubMed] [DOI] [Full Text] [Full Text (PDF)] [Cited by in Crossref: 658] [Cited by in RCA: 512] [Article Influence: 170.7] [Reference Citation Analysis (0)] |
| 8. | Ahmann E, Saviet M. Communication modalities and their perceived effectiveness in coaching for individuals with Attention-Deficit/Hyperactivity Disorder (ADHD). Int J Evid Based Coach Ment. 2019;17:93-107. |
| 9. | Aloni R, Kalron A, Goodman A, Ben-Ari A, Yoeli-Shalom T, Menascu S. Attention Deficit/Hyperactivity Disorder in Children with Multiple Sclerosis. J Atten Disord. 2024;28:1105-1113. [RCA] [PubMed] [DOI] [Full Text] [Cited by in Crossref: 4] [Cited by in RCA: 3] [Article Influence: 1.5] [Reference Citation Analysis (0)] |
| 10. | Rivas-Vazquez RA, Diaz SG, Visser MM, Rivas-Vazquez AA. Adult ADHD: Underdiagnosis of a Treatable Condition. J Health Serv Psychol. 2023;49:11-19. [RCA] [PubMed] [DOI] [Full Text] [Full Text (PDF)] [Cited by in Crossref: 49] [Cited by in RCA: 25] [Article Influence: 8.3] [Reference Citation Analysis (0)] |
| 11. | Bang Madsen K, Robakis TK, Liu X, Momen N, Larsson H, Dreier JW, Kildegaard H, Groth JB, Newcorn JH, Hove Thomsen P, Munk-Olsen T, Bergink V. In utero exposure to ADHD medication and long-term offspring outcomes. Mol Psychiatry. 2023;28:1739-1746.. [RCA] [PubMed] [DOI] [Full Text] [Cited by in Crossref: 28] [Cited by in RCA: 18] [Article Influence: 6.0] [Reference Citation Analysis (0)] |
| 12. | Jendreizik LT, von Wirth E, Döpfner M. Familial Factors Associated With Symptom Severity in Children and Adolescents With ADHD: A Meta-Analysis and Supplemental Review. J Atten Disord. 2023;27:124-144. [RCA] [PubMed] [DOI] [Full Text] [Cited by in Crossref: 19] [Cited by in RCA: 12] [Article Influence: 4.0] [Reference Citation Analysis (0)] |
| 13. | Hu RZ, Zhu KS, Hou ZZ, Wang RD, Liu FF. Enhanced ADHD detection: Frequency information embedded in a visual-language framework. Displays. 2024;83:102712. [DOI] [Full Text] |
| 14. | Jasper HH, Solomon P, Bradley C. Electroencephalographic analyses of behavior problem children. Am J Psychiatry. 1938;95:641-658. [DOI] [Full Text] |
| 15. | Carreiro C, Reicher V, Kis A, Gácsi M. Owner-rated hyperactivity/impulsivity is associated with sleep efficiency in family dogs: a non-invasive EEG study. Sci Rep. 2023;13:1291. [RCA] [PubMed] [DOI] [Full Text] [Full Text (PDF)] [Cited by in Crossref: 10] [Cited by in RCA: 9] [Article Influence: 3.0] [Reference Citation Analysis (0)] |
| 16. | Arns M, Conners CK, Kraemer HC. A decade of EEG Theta/Beta Ratio Research in ADHD: a meta-analysis. J Atten Disord. 2013;17:374-383. [RCA] [PubMed] [DOI] [Full Text] [Cited by in Crossref: 498] [Cited by in RCA: 363] [Article Influence: 27.9] [Reference Citation Analysis (0)] |
| 17. | Selaskowski B, Asché LM, Wiebe A, Kannen K, Aslan B, Gerding TM, Sanchez D, Ettinger U, Kölle M, Lux S, Philipsen A, Braun N. Gaze-based attention refocusing training in virtual reality for adult attention-deficit/hyperactivity disorder. BMC Psychiatry. 2023;23:74. [RCA] [PubMed] [DOI] [Full Text] [Full Text (PDF)] [Cited by in Crossref: 33] [Cited by in RCA: 16] [Article Influence: 5.3] [Reference Citation Analysis (0)] |
| 18. | Sánchez-González A, García-Zapirain B. Electroencephalography Mu rhythm suppression analysis during observation-execution tasks in children with attention-deficit/hyperactivity disorder. J Med Imaging Health Inform. 2017;7:1005. [DOI] [Full Text] |
| 19. | Khare SK, Gaikwad NB, Bajaj V. VHERS: A Novel Variational Mode Decomposition and Hilbert Transform-Based EEG Rhythm Separation for Automatic ADHD Detection. IEEE Trans Instrum Meas. 2022;71:1-10. [DOI] [Full Text] |
| 20. | Einizade A, Mozafari M, Rezaei-Dastjerdehei M, Aghdaei E, Mijani AM, Sardouie SH. Detecting ADHD children based on EEG signals using Graph Signal Processing techniques. In Proceedings of the 2020 27th National and 5th International Iranian Conference on Biomedical Engineering (ICBME), 2020: 264-270. [DOI] [Full Text] |
| 21. | Guney G, Kisacik E, Kalaycioglu C, Saygili G. Exploring the attention process differentiation of attention deficit hyperactivity disorder (ADHD) symptomatic adults using artificial intelligence onelectroencephalography (EEG) signals. Turk J Electr Eng Comput Sci. 2021;29:2312-2325. [DOI] [Full Text] |
| 22. | Zheng YY, Li RY, Sha Li, Zhang YD, Yang SK, Ning HS. A Review on Serious Games for ADHD. arXiv:2105.02970. [DOI] [Full Text] |
| 23. | Holker R, Susan S. Computer-Aided Diagnosis Framework for ADHD Detection Using Quantitative EEG. In Proceedings of the Brain Informatics: 15th International Conference, BI 2022, Padua, Italy, July 15-17, 2022, Proceedings, 2022: 229-240. [RCA] [DOI] [Full Text] [Cited by in RCA: 3] [Reference Citation Analysis (0)] |
| 24. | Chen H, Song Y, Li XL. A deep learning framework for identifying children with ADHD using an EEG-based brain network. Neurocomputing. 2019;356:83-96. [RCA] [DOI] [Full Text] [Cited by in Crossref: 61] [Cited by in RCA: 75] [Article Influence: 10.7] [Reference Citation Analysis (0)] |
| 25. | Boroujeni YK, Rastegari AA, Khodadadi H. Diagnosis of attention deficit hyperactivity disorder using non-linear analysis of the EEG signal. IET Syst Biol. 2019;13:260-266. [RCA] [PubMed] [DOI] [Full Text] [Full Text (PDF)] [Cited by in Crossref: 60] [Cited by in RCA: 27] [Article Influence: 3.9] [Reference Citation Analysis (0)] |
| 26. | Pedrollo GR, Franco AR, Bagesteiro LB, Balbinot A. Spiking Neural Networks Diagnosis of ADHD subtypes through EEG Signals Evaluation. Annu Int Conf IEEE Eng Med Biol Soc. 2022;2022:3166-3169. [RCA] [PubMed] [DOI] [Full Text] [Cited by in Crossref: 6] [Cited by in RCA: 5] [Article Influence: 1.3] [Reference Citation Analysis (0)] |
| 27. | TaghiBeyglou B, Hasanzadeh N, Bagheri F, Jahed M. ADHD diagnosis in children using common spatial pattern and nonlinear analysis of filter banked EEG. In Proceedings of the 2020 28th Iranian Conference on Electrical Engineering (ICEE), 2020: 1-5. [DOI] [Full Text] |
| 28. | Coşmaz E U. Detection of Attention Deficit Hyperactivity Disorder by Using EEG Signals and Deep Learning. İzmir Ekonomi Üniversitesi, 2024. |
| 29. | Bansal J, Gangwar G, Aljaidi M, Alkoradees A, Singh G. EEG-Based ADHD Classification Using Autoencoder Feature Extraction and ResNet with Double Augmented Attention Mechanism. Brain Sci. 2025;15:95. [RCA] [PubMed] [DOI] [Full Text] [Full Text (PDF)] [Cited by in Crossref: 13] [Cited by in RCA: 8] [Article Influence: 8.0] [Reference Citation Analysis (0)] |
| 30. | Hassan U, Singhal A. Convolutional neural network framework for EEG-based ADHD diagnosis in children. Health Inf Sci Syst. 2024;12:44. [RCA] [PubMed] [DOI] [Full Text] [Full Text (PDF)] [Cited by in Crossref: 14] [Cited by in RCA: 6] [Article Influence: 3.0] [Reference Citation Analysis (0)] |
| 31. | Latifi B, Amini A, Motie Nasrabadi A. Siamese based deep neural network for ADHD detection using EEG signal. Comput Biol Med. 2024;182:109092. [RCA] [PubMed] [DOI] [Full Text] [Cited by in Crossref: 15] [Cited by in RCA: 4] [Article Influence: 2.0] [Reference Citation Analysis (0)] |
| 32. | Cura OK, Akan A, Atli SK. Detection of Attention Deficit Hyperactivity Disorder based on EEG feature maps and deep learning. Biocybern Biomed Eng. 2024;44:450-460. [DOI] [Full Text] |
| 33. | Mondal S, Biswas D, Mukherjee P, Roy AH. ADHD-Net: A Robust Deep Learning-based Framework for Detecting ADHD Patients using EEG. In Proceedings of the 2024 Global Conference on Communications and Information Technologies (GCCIT), 2024: 1-6. [DOI] [Full Text] |
| 34. | Chugh N, Aggarwal S, Balyan A. The Hybrid Deep Learning Model for Identification of Attention-Deficit/Hyperactivity Disorder Using EEG. Clin EEG Neurosci. 2024;55:22-33. [RCA] [PubMed] [DOI] [Full Text] [Cited by in Crossref: 14] [Cited by in RCA: 3] [Article Influence: 1.5] [Reference Citation Analysis (0)] |
| 35. | Mao Y, Qi X, He L, Wang S, Wang Z, Wang F. Advanced machine learning techniques reveal multidimensional EEG abnormalities in children with ADHD: a framework for automatic diagnosis. Front Psychiatry. 2025;16:1475936. [RCA] [PubMed] [DOI] [Full Text] [Full Text (PDF)] [Cited by in Crossref: 6] [Cited by in RCA: 2] [Article Influence: 2.0] [Reference Citation Analysis (0)] |
| 36. | Jahani H, Safaei AA. Efficient deep learning approach for diagnosis of attention-deficit/hyperactivity disorder in children based on EEG Signals. Cogn Comput. 2024;16:2315-2330. [DOI] [Full Text] |
| 37. | Ranjan R, Shovit S, Bagri SS, Sahana BC. EEG Functional Connectivity Feature-Based Diagnosis of ADHD Using Deep Learning on Raspberry Pi. In Proceedings of the 2024 IEEE International Conference on Electronics, Computing and Communication Technologies (CONECCT), 2024: 1-6. [DOI] [Full Text] |
| 38. | Pappula M, Anwar SM. An ADHD Diagnostic Interface Based on EEG Spectrograms and Deep Learning Techniques. In Proceedings of the 2024 20th International Symposium on Medical Information Processing and Analysis (SIPAIM), 2024: 1-4. [DOI] [Full Text] |
| 39. | Barua PD, Yildiz AM, Canpolat N, Keles T, Dogan S. , Baygin M, Tuncer I, Tuncer T, Tan RS, Fujita H. An accurate automated speaker counting architecture based on James Webb Pattern. Eng Appl Artif Intell. 2023;119:105821. [DOI] [Full Text] |
| 40. | Keles T, Yildiz AM, Barua PD, Dogan S, Baygin M, Tuncer T, Demir CF, Ciaccio EJ, Acharya UR. A new one-dimensional testosterone pattern-based EEG sentence classification method. Eng Appl Artif Intell. 2023;119:105722. [RCA] [DOI] [Full Text] [Cited by in Crossref: 13] [Cited by in RCA: 4] [Article Influence: 1.3] [Reference Citation Analysis (0)] |
| 41. | Sharma M, Makwana P, Chad RS, Acharya UR. A novel automated robust dual-channel EEG-based sleep scoring system using optimal half-band pair linear-phase biorthogonal wavelet filter bank. Appl Intell (Dordr). 2023;1-19. [RCA] [PubMed] [DOI] [Full Text] [Full Text (PDF)] [Cited by in Crossref: 13] [Cited by in RCA: 5] [Article Influence: 1.7] [Reference Citation Analysis (0)] |
| 42. | Khare SK, Acharya UR. An explainable and interpretable model for attention deficit hyperactivity disorder in children using EEG signals. Comput Biol Med. 2023;155:106676. [RCA] [PubMed] [DOI] [Full Text] [Cited by in Crossref: 96] [Cited by in RCA: 33] [Article Influence: 11.0] [Reference Citation Analysis (0)] |
| 43. | Inthiyaz S, Altahan BR, Ahammad SH, Rajesh V, Kalangi RR, Smirani LK, Hossain MA, Rashed ANZ. Skin disease detection using deep learning. Adv Eng Softw. 2023;175:103361. [DOI] [Full Text] |
| 44. | Ait Nasser A, Akhloufi MA. A Review of Recent Advances in Deep Learning Models for Chest Disease Detection Using Radiography. Diagnostics (Basel). 2023;13:159. [RCA] [PubMed] [DOI] [Full Text] [Full Text (PDF)] [Cited by in Crossref: 87] [Cited by in RCA: 24] [Article Influence: 8.0] [Reference Citation Analysis (0)] |
| 45. | Tuncer T, Dogan S, Kaya MC, Subasi A. Automated and accurate focal EEG signal detection method based on the cube pattern. Multimed Tools Appl. 2023;1-17. [DOI] [Full Text] |
| 46. | Goldberger J, Hinton GE, Roweis S, Salakhutdinov RR. Neighbourhood components analysis. Adv Neural Inf Process Syst. 2004;17:513-520. |
| 47. | Maillo J, Ramírez S, Triguero I, Herrera F. kNN-IS: An Iterative Spark-based design of the k-Nearest Neighbors classifier for big data. Knowledge-based Syst. 2017;117:3-15. [RCA] [DOI] [Full Text] [Cited by in Crossref: 171] [Cited by in RCA: 95] [Article Influence: 10.6] [Reference Citation Analysis (0)] |
| 48. | Dogan A, Akay M, Barua PD, Baygin M, Dogan S, Tuncer T, Dogru AH, Acharya UR. PrimePatNet87: Prime pattern and tunable q-factor wavelet transform techniques for automated accurate EEG emotion recognition. Comput Biol Med. 2021;138:104867. [RCA] [PubMed] [DOI] [Full Text] [Cited by in Crossref: 95] [Cited by in RCA: 48] [Article Influence: 9.6] [Reference Citation Analysis (0)] |
| 49. | Kuncan F, Yılmaz K, Kuncan M. Sensör işaretlerinden cinsiyet tanıma için yerel ikili örüntüler tabanlı yeni yaklaşımlar. Gazi Üniversitesi Mühendislik Mimarlık Fakültesi Dergisi. 2019;34:2173-2186. [DOI] [Full Text] |
| 50. | Nouri A, Tabanfar Z. Detection of ADHD Disorder in Children using Layer-wise Relevance Propagation and Convolutional Neural Network: an EEG Analysis. Front Biomed Technol. 2023. [DOI] [Full Text] |
| 51. | Sharma Y, Singh BK. Attention deficit hyperactivity disorder detection in children using multivariate empirical EEG decomposition approaches: A comprehensive analytical study. Expert Syst Appl: X. 2023;213:119219. [DOI] [Full Text] |
| 52. | Cura OK, Atli SK, Akan A. Attention deficit hyperactivity disorder recognition based on intrinsic time-scale decomposition of EEG signals. Biomed Signal Process Control. 2023;81:104512. [RCA] [DOI] [Full Text] [Cited by in RCA: 4] [Reference Citation Analysis (0)] |
| 53. | Barua PD, Dogan S, Baygin M, Tuncer T, Palmer EE, Ciaccio EJ, Acharya UR. TMP19: A Novel Ternary Motif Pattern-Based ADHD Detection Model Using EEG Signals. Diagnostics (Basel). 2022;12:2544. [RCA] [PubMed] [DOI] [Full Text] [Full Text (PDF)] [Cited by in Crossref: 18] [Cited by in RCA: 10] [Article Influence: 2.5] [Reference Citation Analysis (0)] |
| 54. | Tor HT, Ooi CP, Lim-Ashworth NS, Wei JKE, Jahmunah V, Oh SL, Acharya UR, Fung DSS. Automated detection of conduct disorder and attention deficit hyperactivity disorder using decomposition and nonlinear techniques with EEG signals. Comput Methods Programs Biomed. 2021;200:105941. [RCA] [PubMed] [DOI] [Full Text] [Cited by in Crossref: 116] [Cited by in RCA: 47] [Article Influence: 9.4] [Reference Citation Analysis (0)] |
| 55. | Tosun M. Effects of spectral features of EEG signals recorded with different channels and recording statuses on ADHD classification with deep learning. Phys Eng Sci Med. 2021;44:693-702. [RCA] [PubMed] [DOI] [Full Text] [Cited by in Crossref: 55] [Cited by in RCA: 26] [Article Influence: 5.2] [Reference Citation Analysis (0)] |
| 56. | Moghaddari M, Lighvan MZ, Danishvar S. Diagnose ADHD disorder in children using convolutional neural network based on continuous mental task EEG. Comput Methods Programs Biomed. 2020;197:105738. [RCA] [PubMed] [DOI] [Full Text] [Cited by in Crossref: 129] [Cited by in RCA: 55] [Article Influence: 9.2] [Reference Citation Analysis (0)] |
| 57. | Kaur S, Singh S, Arun P, Kaur D, Bajaj M. Phase Space Reconstruction of EEG Signals for Classification of ADHD and Control Adults. Clin EEG Neurosci. 2020;51:102-113. [RCA] [PubMed] [DOI] [Full Text] [Cited by in Crossref: 51] [Cited by in RCA: 30] [Article Influence: 5.0] [Reference Citation Analysis (0)] |
| 58. | Tanko D, Barua PD, Dogan S, Tuncer T, Palmer E, Ciaccio EJ, Acharya UR. EPSPatNet86: eight-pointed star pattern learning network for detection ADHD disorder using EEG signals. Physiol Meas. 2022;43. [RCA] [PubMed] [DOI] [Full Text] [Cited by in Crossref: 20] [Cited by in RCA: 10] [Article Influence: 2.5] [Reference Citation Analysis (0)] |
| 59. | García-Ponsoda S, Maté A, Trujillo J. Refining ADHD diagnosis with EEG: The impact of preprocessing and temporal segmentation on classification accuracy. Comput Biol Med. 2024;183:109305. [RCA] [PubMed] [DOI] [Full Text] [Cited by in Crossref: 17] [Cited by in RCA: 7] [Article Influence: 3.5] [Reference Citation Analysis (0)] |
| 60. | Mercado-Aguirre I, Gutiérrez-Ruiz K, Contreras-Ortiz SH. Classification of auditory ERPs for ADHD detection in children. J Med Eng Technol. 2025;49:69-78. [RCA] [PubMed] [DOI] [Full Text] [Cited by in Crossref: 3] [Cited by in RCA: 2] [Article Influence: 2.0] [Reference Citation Analysis (0)] |
| 61. | Colonnese F, Rosato A, Di Luzio F, Panella M. Hyperdimensional Computing for ADHD Classification using EEG Signals. arXiv preprint arXiv:2501.05186, 2025. [DOI] [Full Text] |
| 62. | Cai T, Zhao G, Zang J, Zong C, Zhang Z, Xue C. Topological feature search method for multichannel EEG: Application in ADHD classification. Biomed Signal Process Control. 2025;100:107153. [DOI] [Full Text] |
| 63. | Alhussen A, Alutaibi AI, Sharma SK, Khan AR, Ahmad F, Tejani GG. Early attention-deficit/hyperactivity disorder (ADHD) with NeuroDCT-ICA and rhinofish optimization (RFO) algorithm based optimized ADHD-AttentionNet. Sci Rep. 2025;15:6967. [RCA] [PubMed] [DOI] [Full Text] [Full Text (PDF)] [Cited by in Crossref: 12] [Cited by in RCA: 5] [Article Influence: 5.0] [Reference Citation Analysis (0)] |
Open Access: This article is an open-access article that was selected by an in-house editor and fully peer-reviewed by external reviewers. It is distributed in accordance with the Creative Commons Attribution NonCommercial (CC BY-NC 4.0) license, which permits others to distribute, remix, adapt, build upon this work non-commercially, and license their derivative works on different terms, provided the original work is properly cited and the use is non-commercial. See: https://creativecommons.org/Licenses/by-nc/4.0/