















Copyright: ©Author(s) 2026.
World J Psychiatry. Aug 19, 2026; 16(8): 117122
Published online Aug 19, 2026. doi: 10.5498/wjp.v16.i8.117122
Published online Aug 19, 2026. doi: 10.5498/wjp.v16.i8.117122
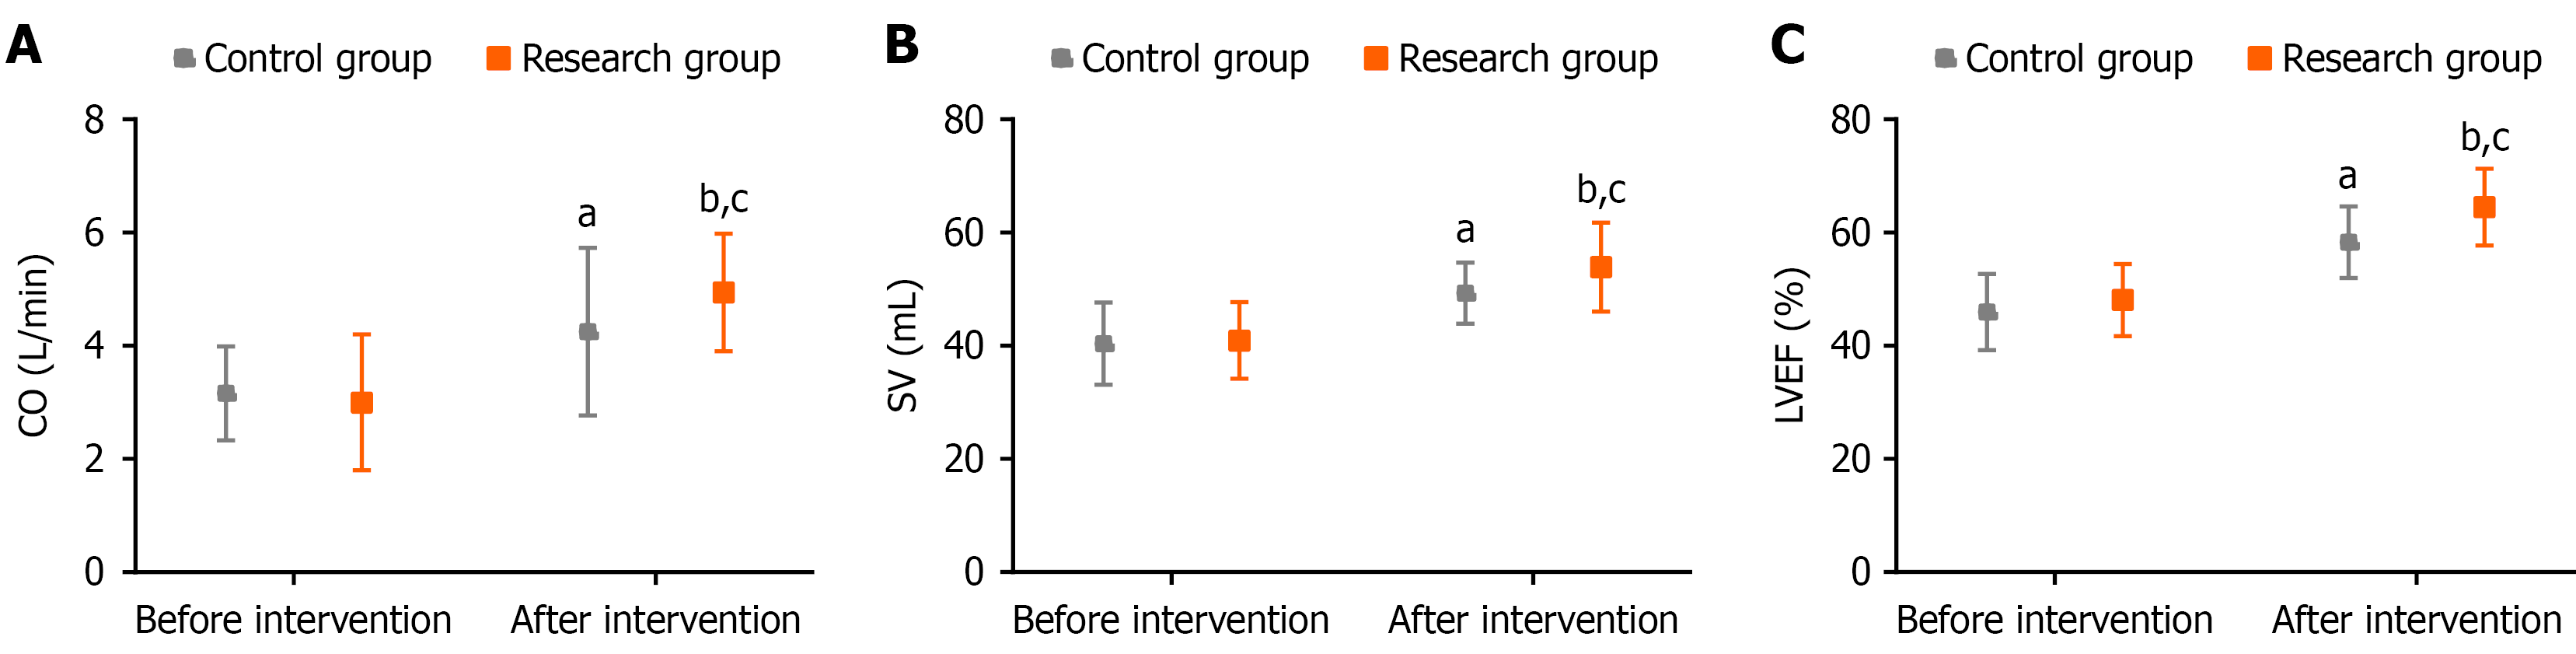
Figure 1 Cardiac function comparison A: Cardiac output comparison pre- and post-intervention; B: Stroke volume comparison before and after intervention; C: Left ventricular ejection fraction comparison pre- and post-intervention.
aP < 0.05 and bP < 0.01 vs the pre-interventional level; cP < 0.05 vs control group at the same time point. CO: Cardiac output; SV: Stroke volume; LVEF: Left ventricular ejection fraction.
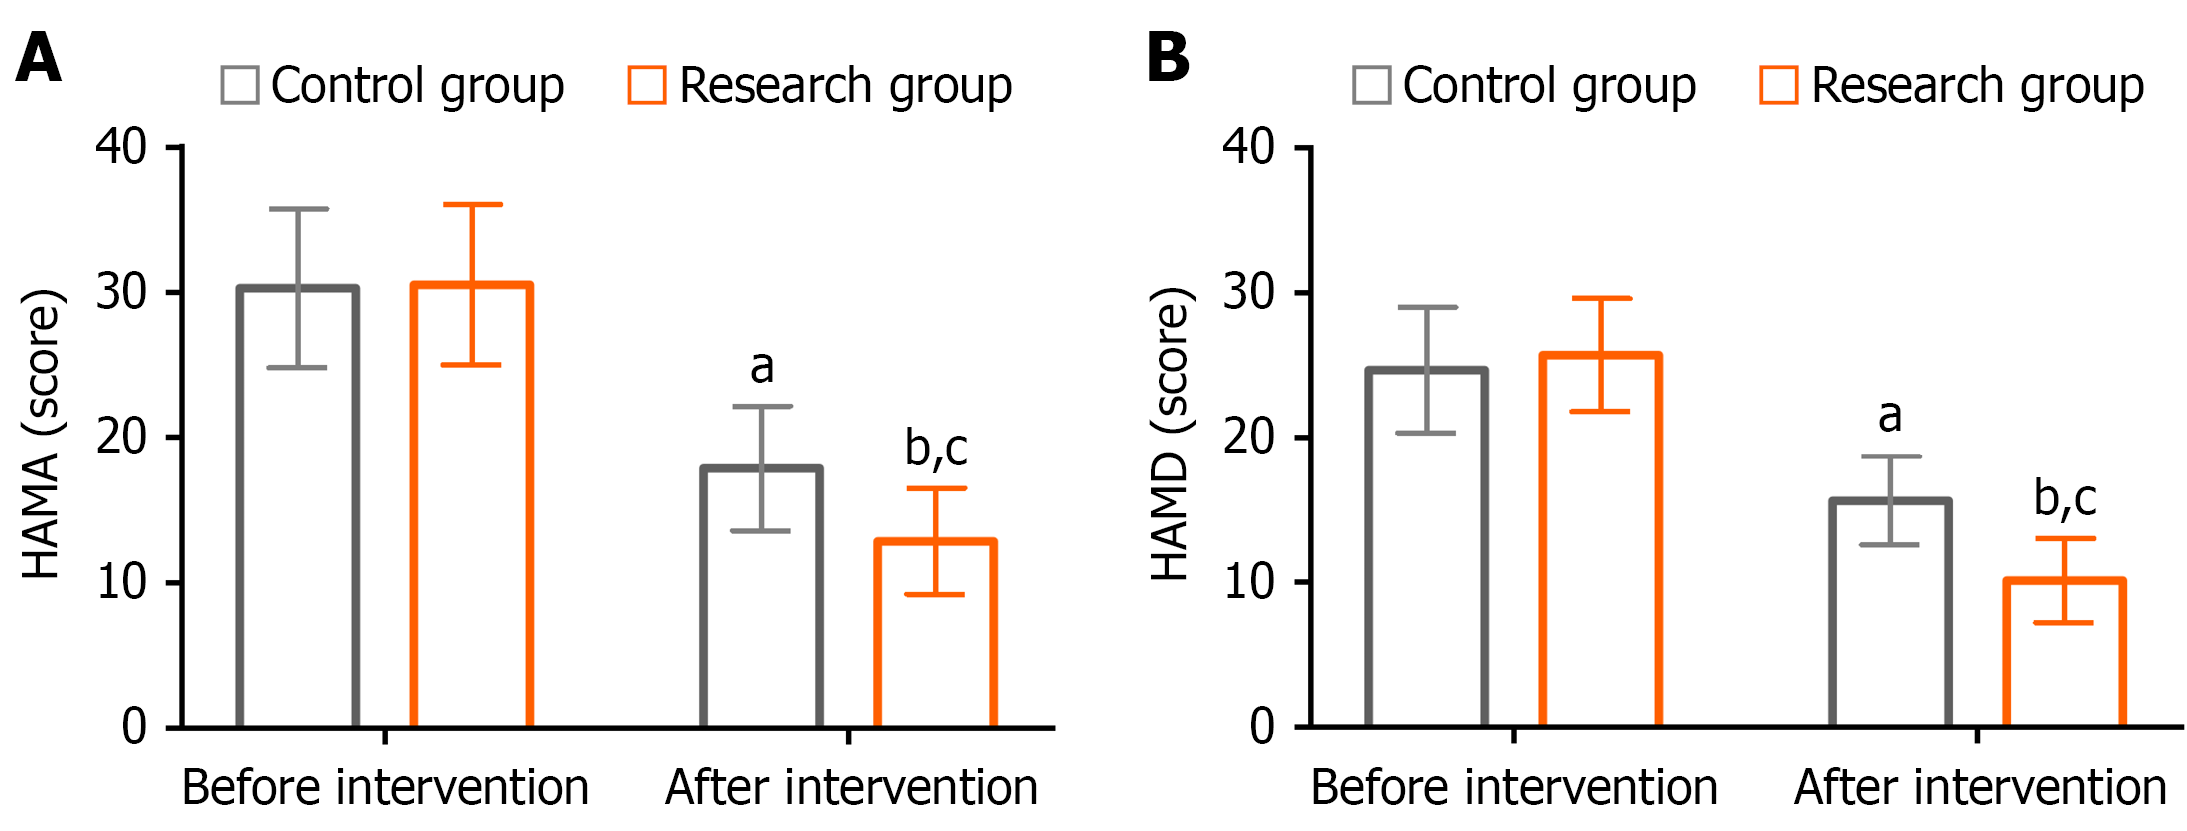
Figure 2 Adverse mood comparison.
A: Comparative analysis of Hamilton Anxiety Rating Scale before and after intervention; B: Hamilton Depression Rating Scale comparison pre- and post-intervention. aP < 0.05 and bP < 0.01 vs the pre-interventional level within the group; cP < 0.05 vs control group at the identical time point. HAMA: Hamilton Anxiety Rating Scale; HAMD: Hamilton Depression Rating Scale.
- Citation: Chu LJ, Lv JN. Sertraline plus psychological intervention for acute myocardial infarction with anxiety-depression comorbidity: Cardiac function, adverse mood, and resilience impacts. World J Psychiatry 2026; 16(8): 117122
- URL: https://www.wjgnet.com/2220-3206/full/v16/i8/117122.htm
- DOI: https://dx.doi.org/10.5498/wjp.v16.i8.117122