















Copyright: ©Author(s) 2026.
World J Psychiatry. Aug 19, 2026; 16(8): 116766
Published online Aug 19, 2026. doi: 10.5498/wjp.116766
Published online Aug 19, 2026. doi: 10.5498/wjp.116766
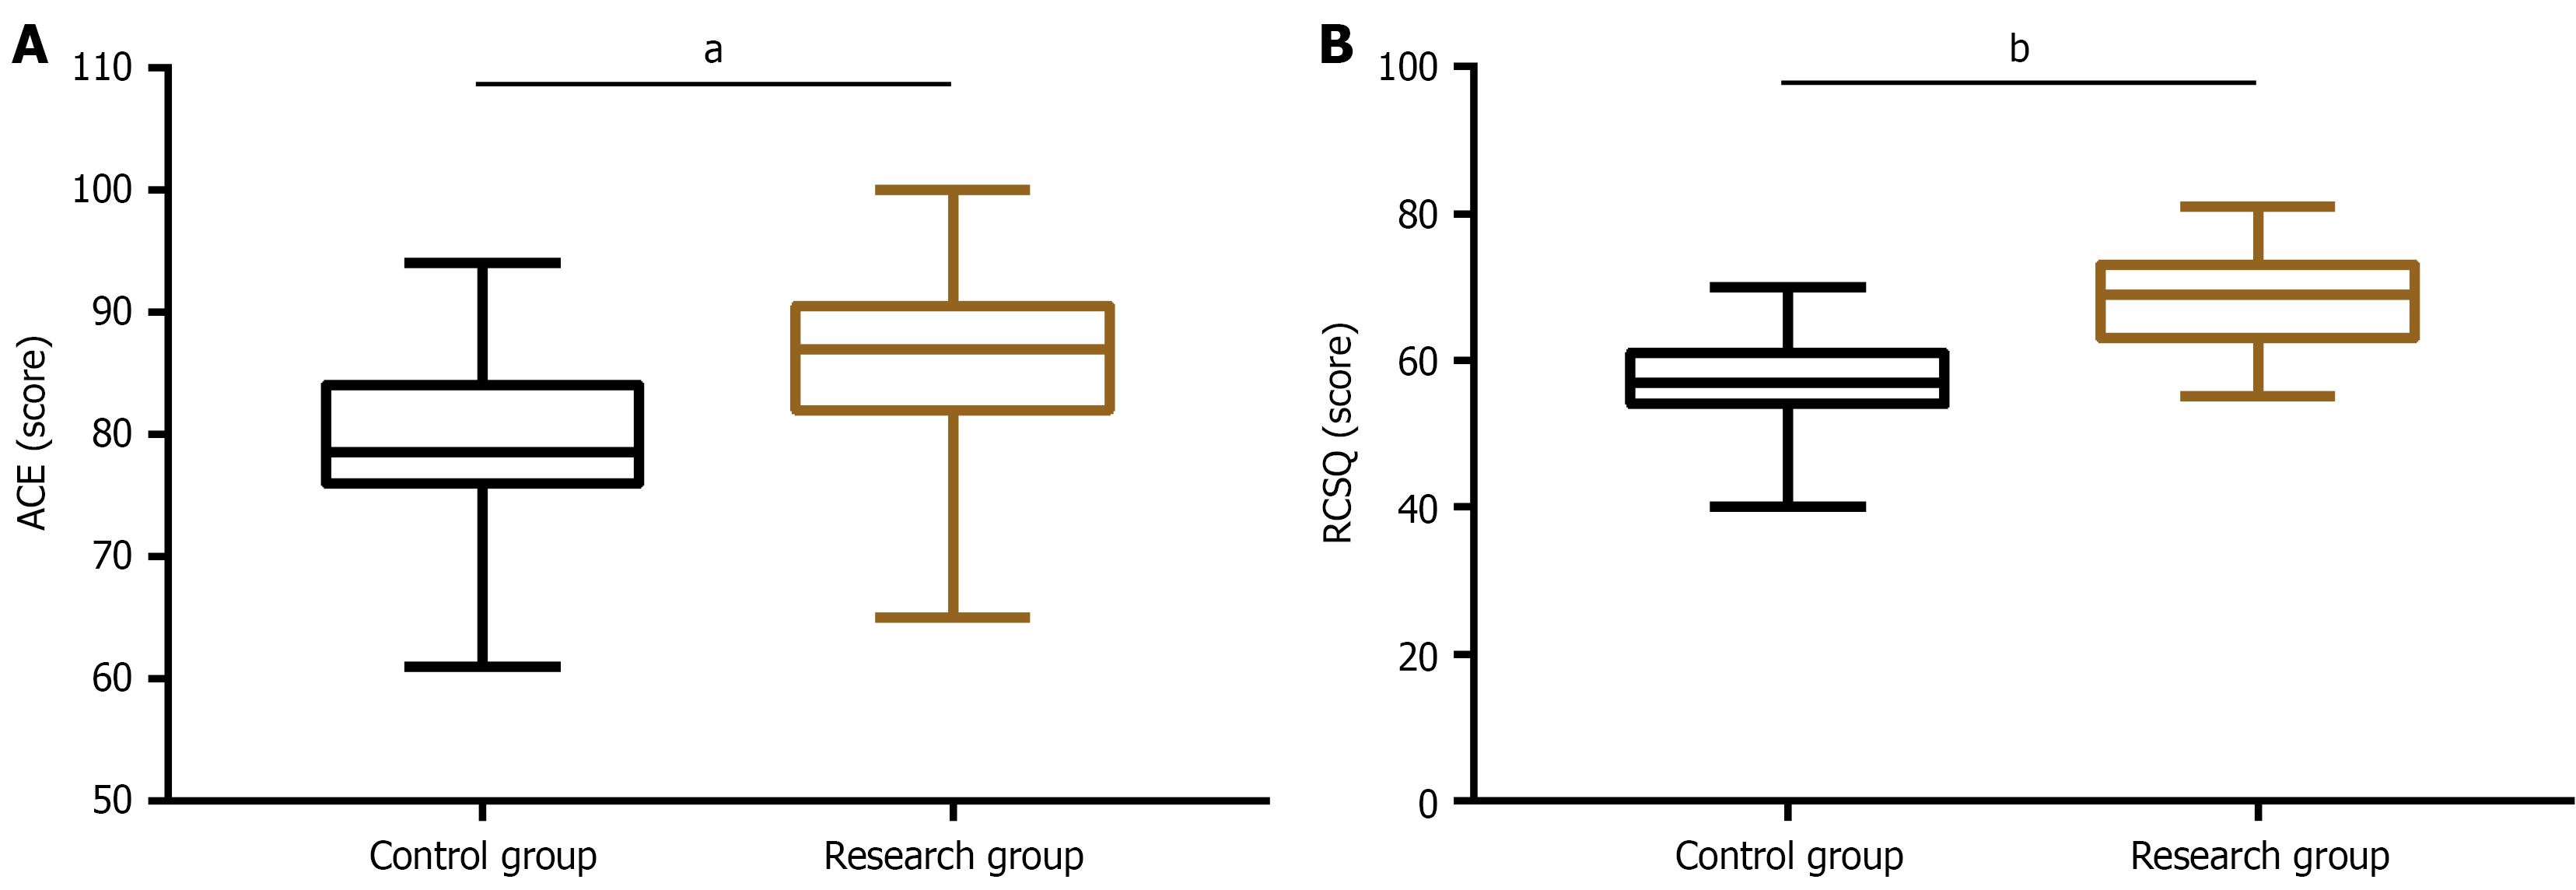
Figure 1 Cognitive function and sleep quality.
A: Pre-interventional and post-interventional Adapted Cognitive Exam scores; B: Pre-interventional and post-interventional Richards-Campbell Sleep Questionnaire scores. aP < 0.05, bP < 0.01 for inter-group comparisons. ACE: Adapted Cognitive Exam; RCSQ: Richards-Campbell Sleep Questionnaire.
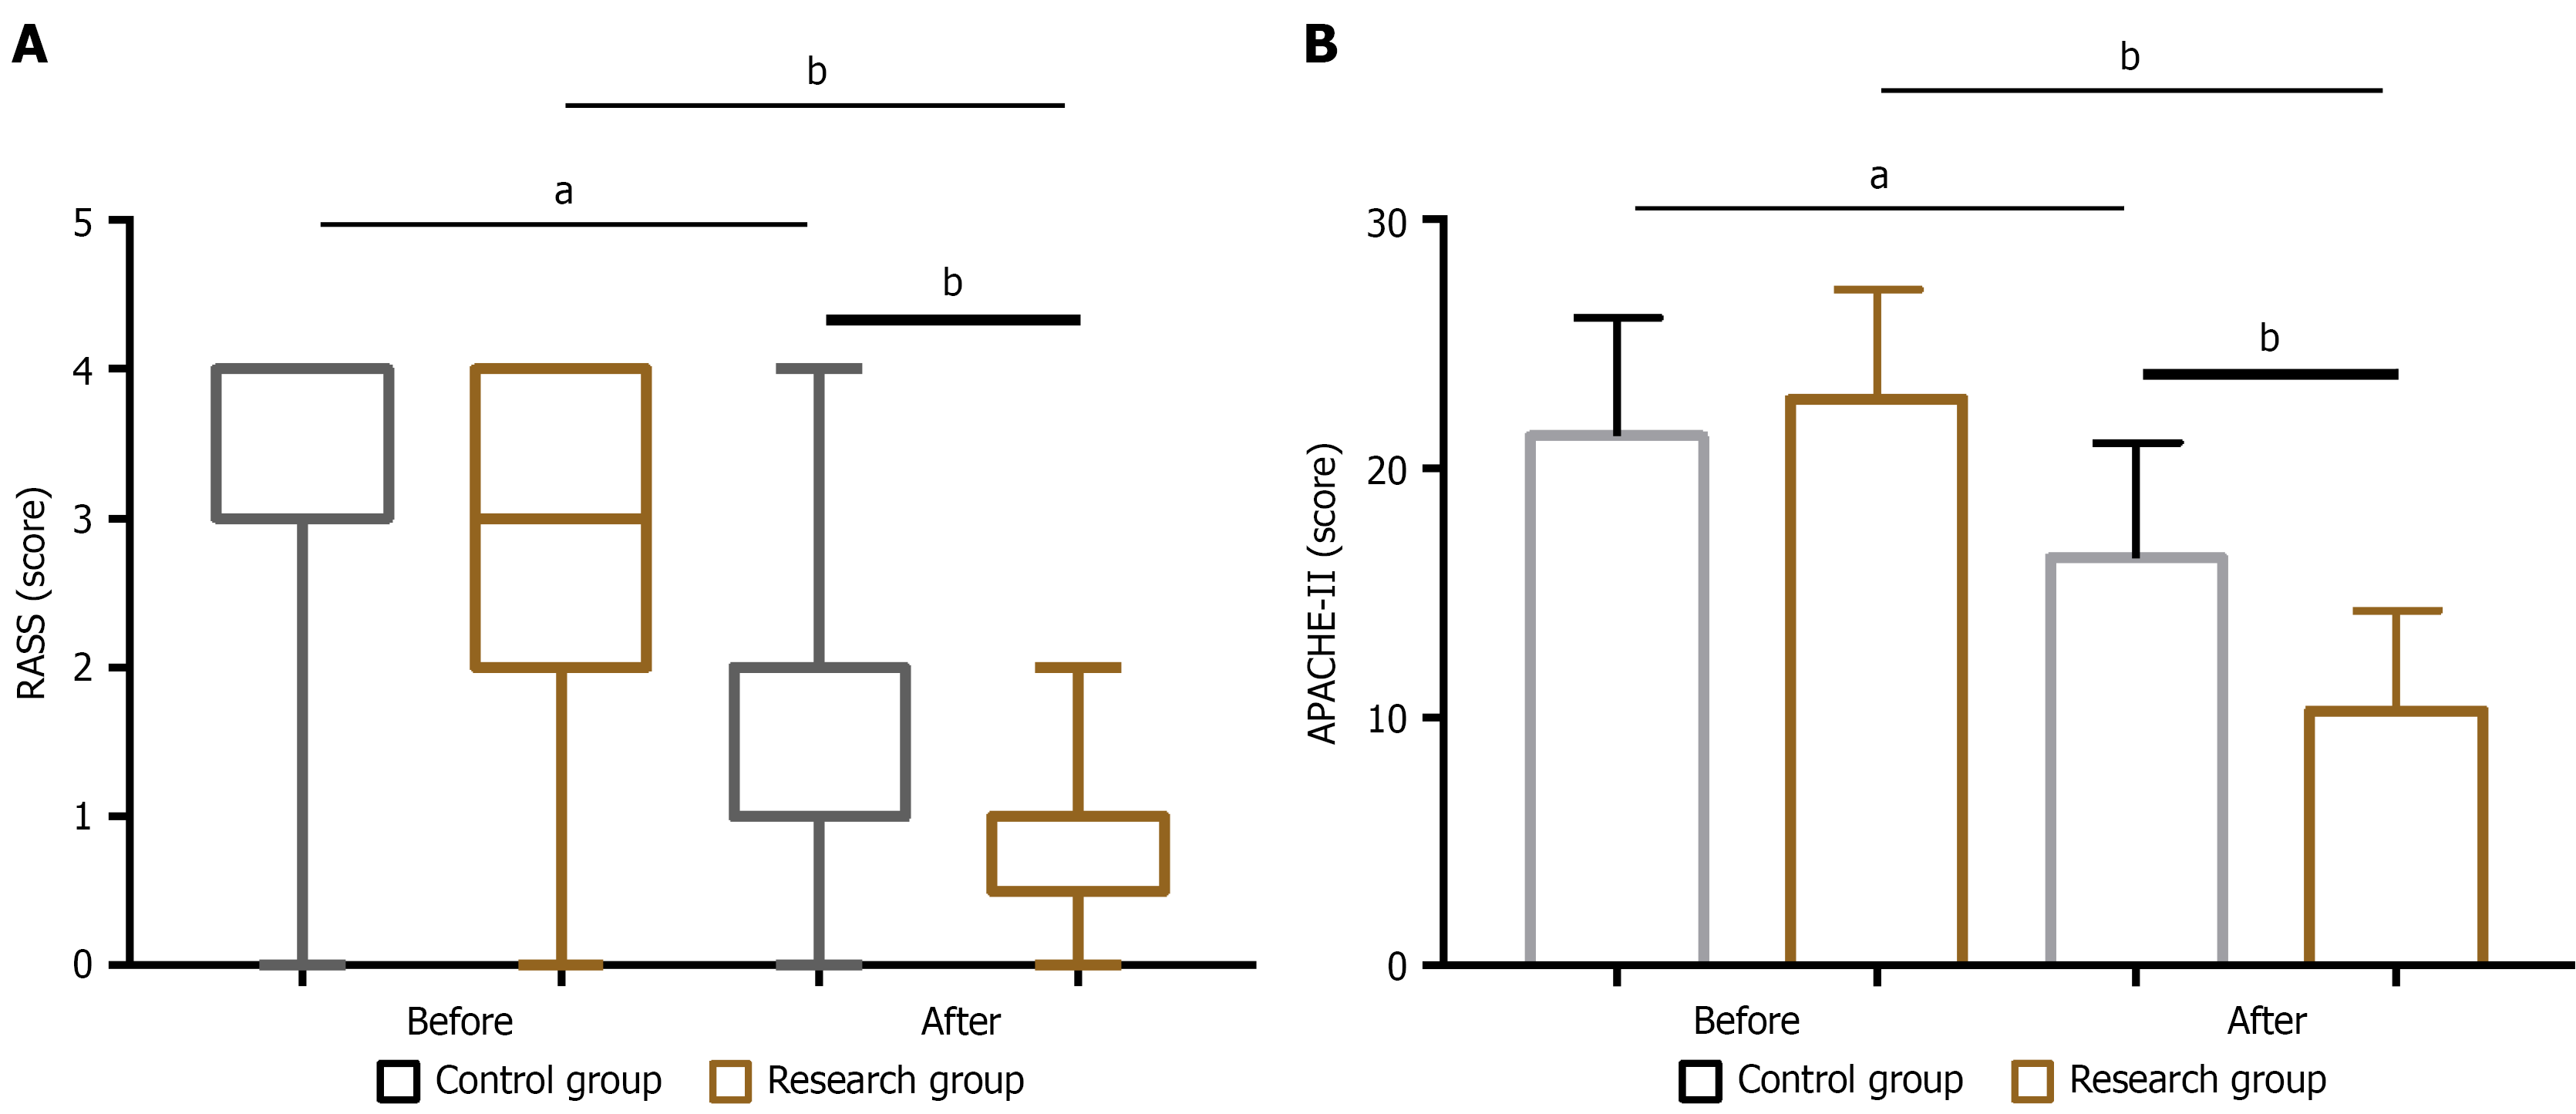
Figure 2 Sedation level and health status.
A: Pre-interventional and post-interventional Richmond Agitation and Sedation Scale scores; B: Acute Physiology and Chronic Health Evaluation II scores pre-intervention and post-intervention. aP < 0.05 and bP < 0.01 vs before intervention. APACHE-II: Acute Physiology and Chronic Health Evaluation II; RASS: Richmond Agitation and Sedation Scale.
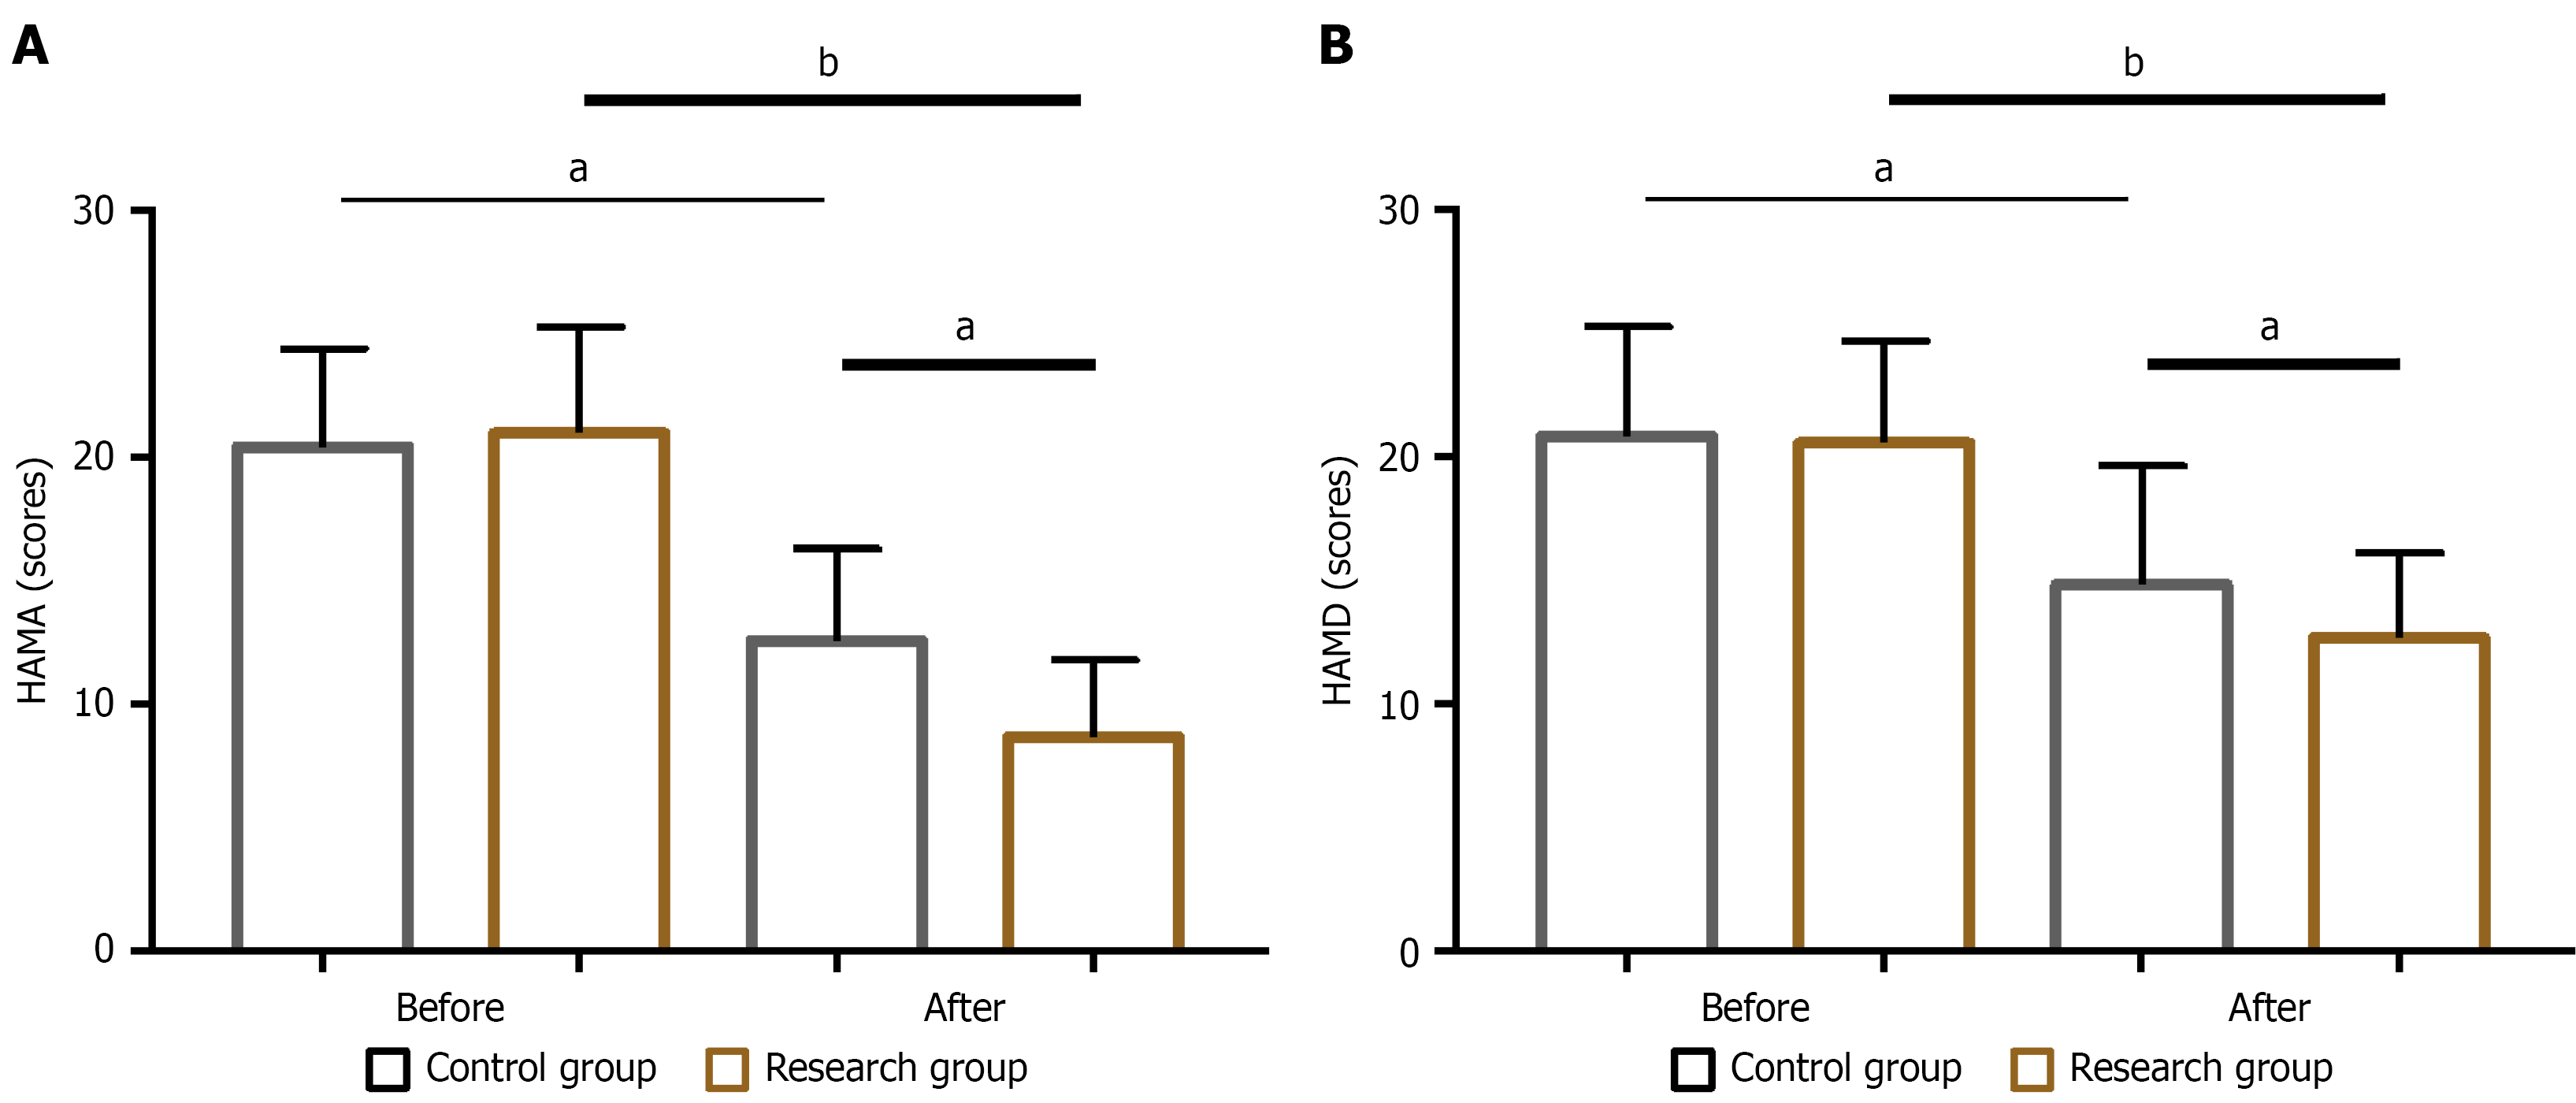
Figure 3 Anxiety and depression assessments.
A: Pre-interventional and post-interventional Hamilton Anxiety Scale scores; B: Hamilton Depression Scale scores pre- and post-intervention. aP < 0.05 and bP < 0.01 vs pre-intervention. HAMA: Hamilton Anxiety Scale; HAMD: Hamilton Depression Scale.
- Citation: Xiao YT, Wang XY, Huang J. Analysis of the preventive effect of evidence-based, non-pharmacological care bundles against delirium in intensive care unit patients. World J Psychiatry 2026; 16(8): 116766
- URL: https://www.wjgnet.com/2220-3206/full/v16/i8/116766.htm
- DOI: https://dx.doi.org/10.5498/wjp.116766