Copyright
©The Author(s) 2025.
World J Psychiatry. Oct 19, 2025; 15(10): 109425
Published online Oct 19, 2025. doi: 10.5498/wjp.v15.i10.109425
Published online Oct 19, 2025. doi: 10.5498/wjp.v15.i10.109425
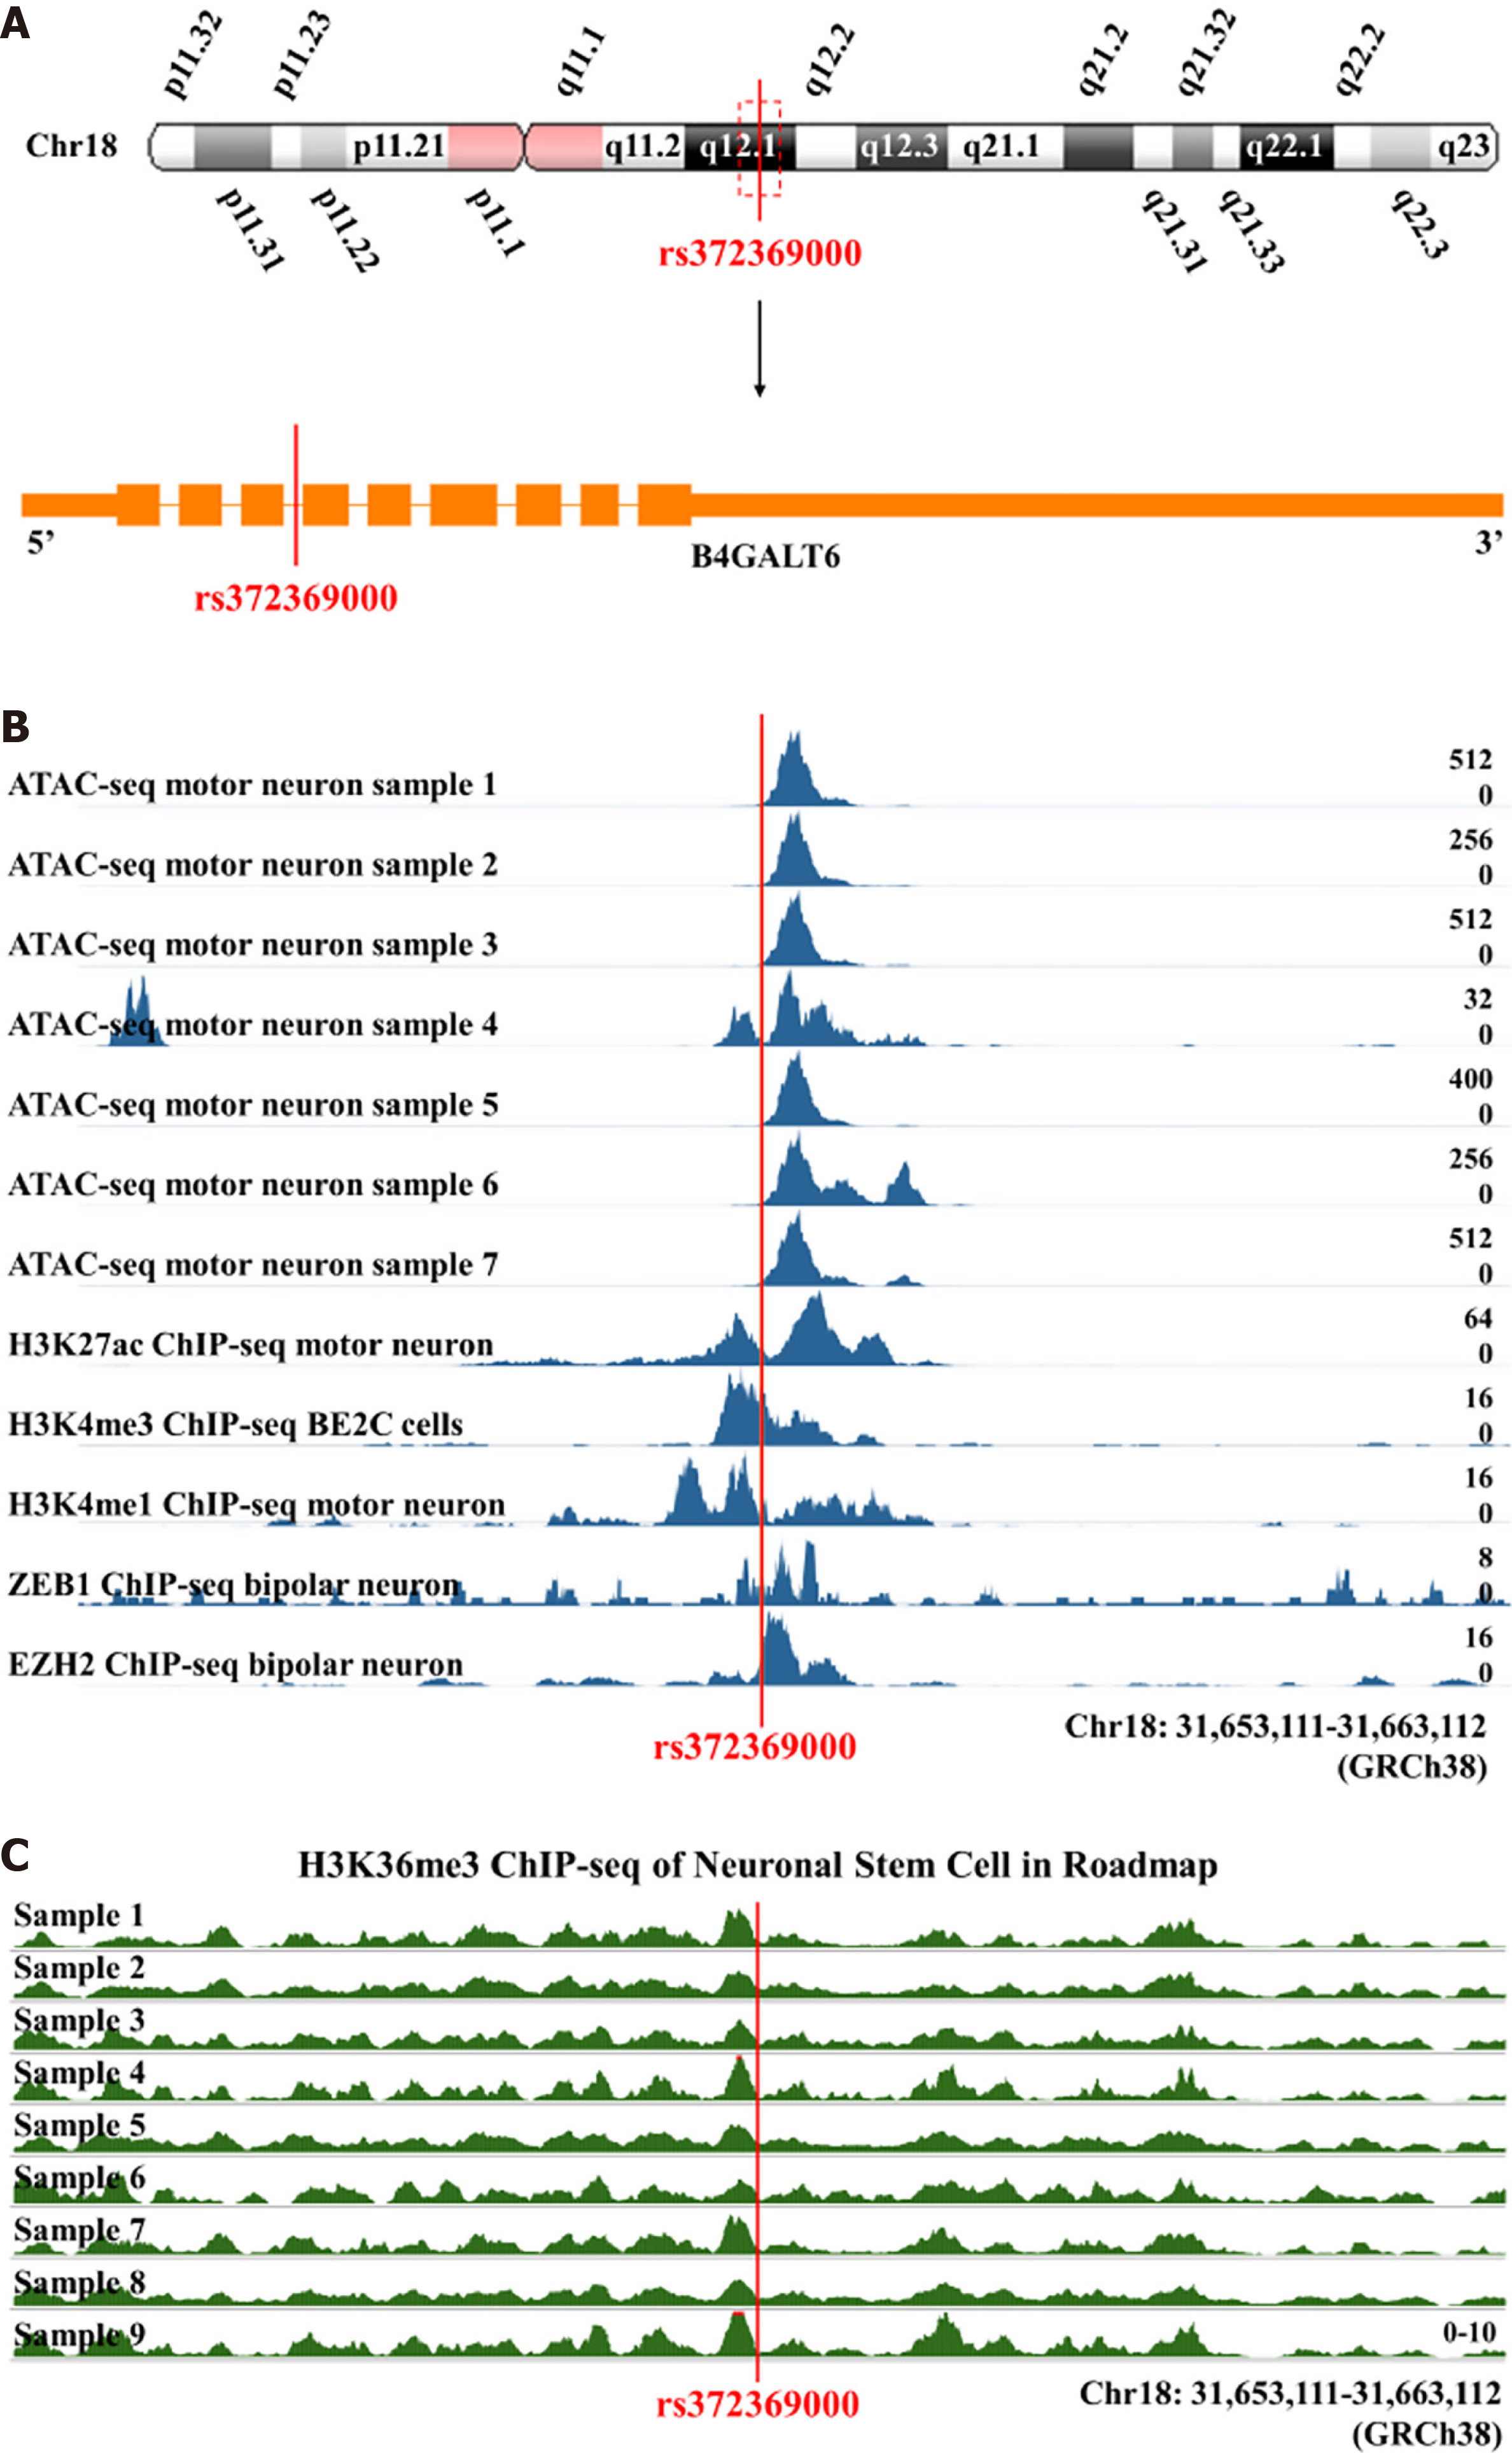
Figure 1 rs372369000 is a functional variant.
A: Rs372369000 is located on q12.1 of chromosome 18 in the intronic region of the B4GALT6 gene; B: ENCODE chromatin accessibility data indicated that rs372369000 was located in the open chromatin region of motor neurons; C: ChIP-seq results of epigenetic modification in Roadmap showed that the rs372369000 region had H3k36me3 signal peaks in neural stem cells. Chr: Chromosome; ATAC-seq: Assay for trans
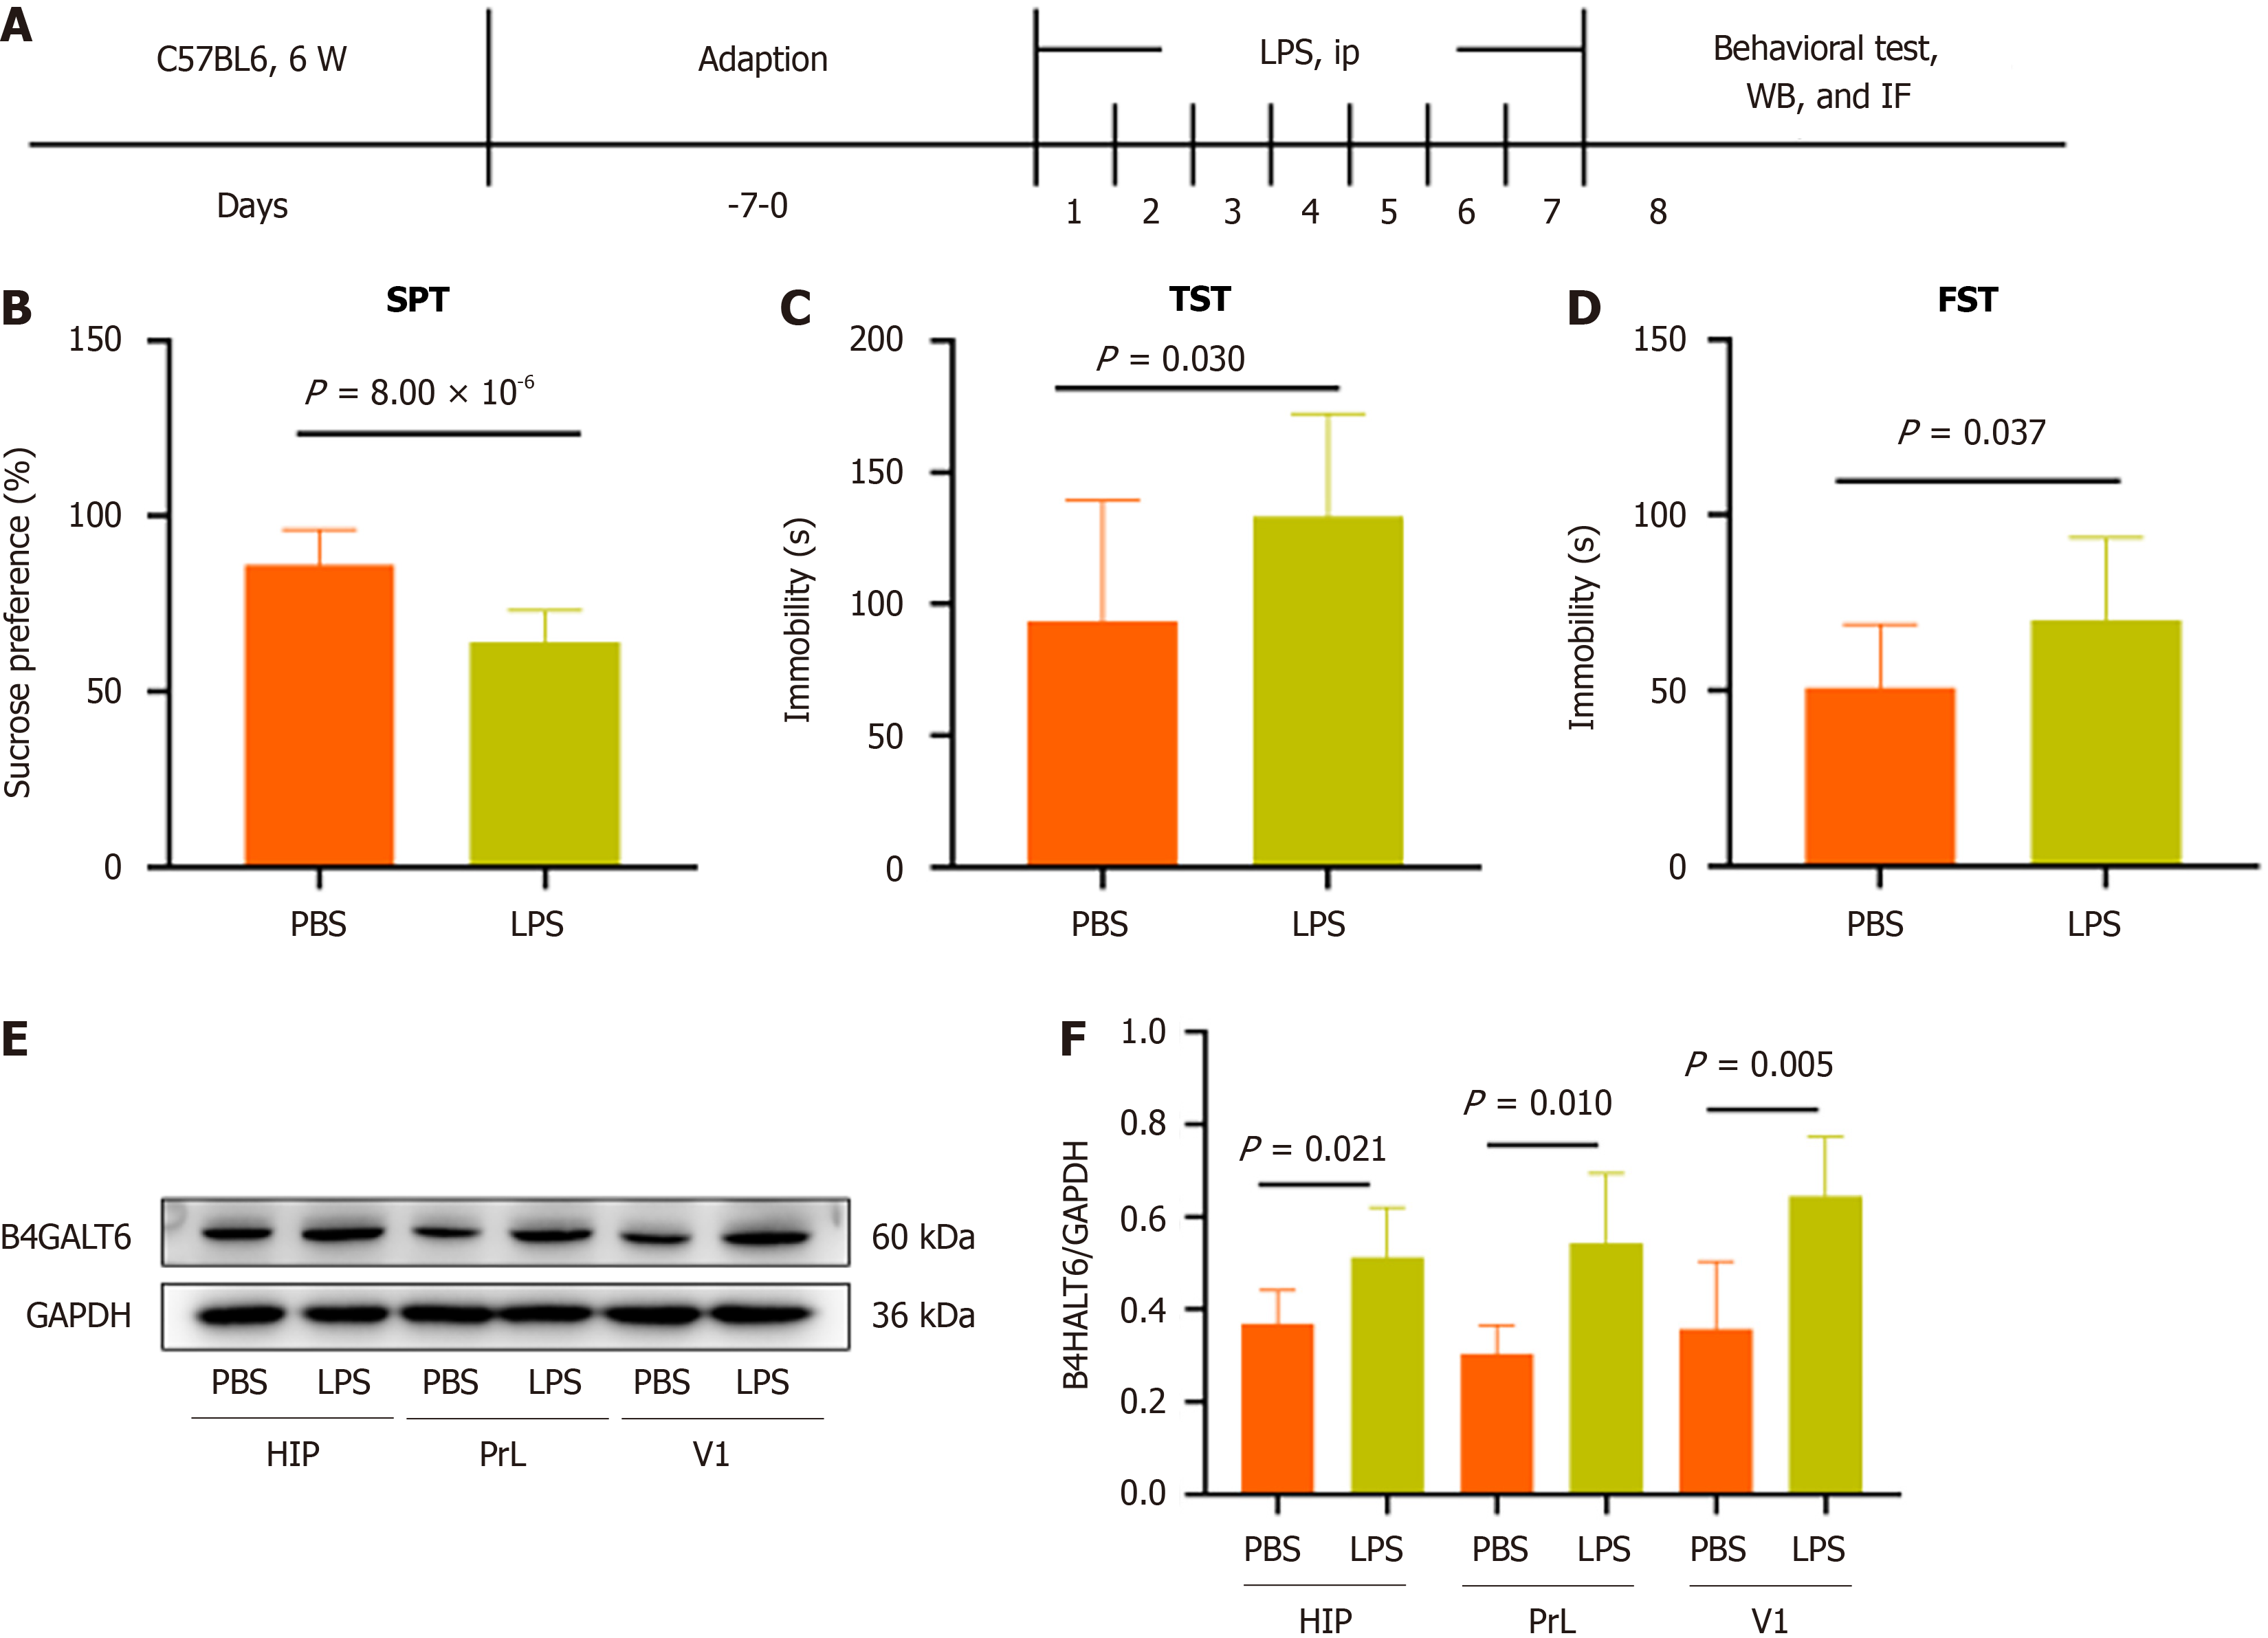
Figure 2 B4GALT6 expression in hippocampus, PrL and V1 of visual cortex increased in depressive-like behavior mice.
A: Schematic diagram of the experimental procedure; B: Sucrose preference test outcomes [phosphate-buffered saline (PBS) vs lipopolysaccharides (LPS), 86.20 ± 9.97 vs 64.14 ± 9.1, P = 8.00 × 10⁻⁶]; C: Results of the tail suspension test (PBS vs LPS, 93.42 ± 45.96 vs 133 ± 39.26, P = 0.030); D: Results of the forced swimming test (PBS vs LPS, 50.75 ± 18.14 vs 70.14 ± 23.4, P = 0.037); E: Western blot of B4GALT6 expression; F: Statistical results of Western blot for B4GALT6. FST: Forced swimming test; GAPDH: Glyceraldehyde-3-phosphate dehydrogenase; HIP: Hippocampus; IF: Immunofluorescence; LPS: Lipopolysaccharides; PBS: Phosphate-buffered saline; SPT: Sucrose preference test; TST: Tail suspension test; WB: Western blot.
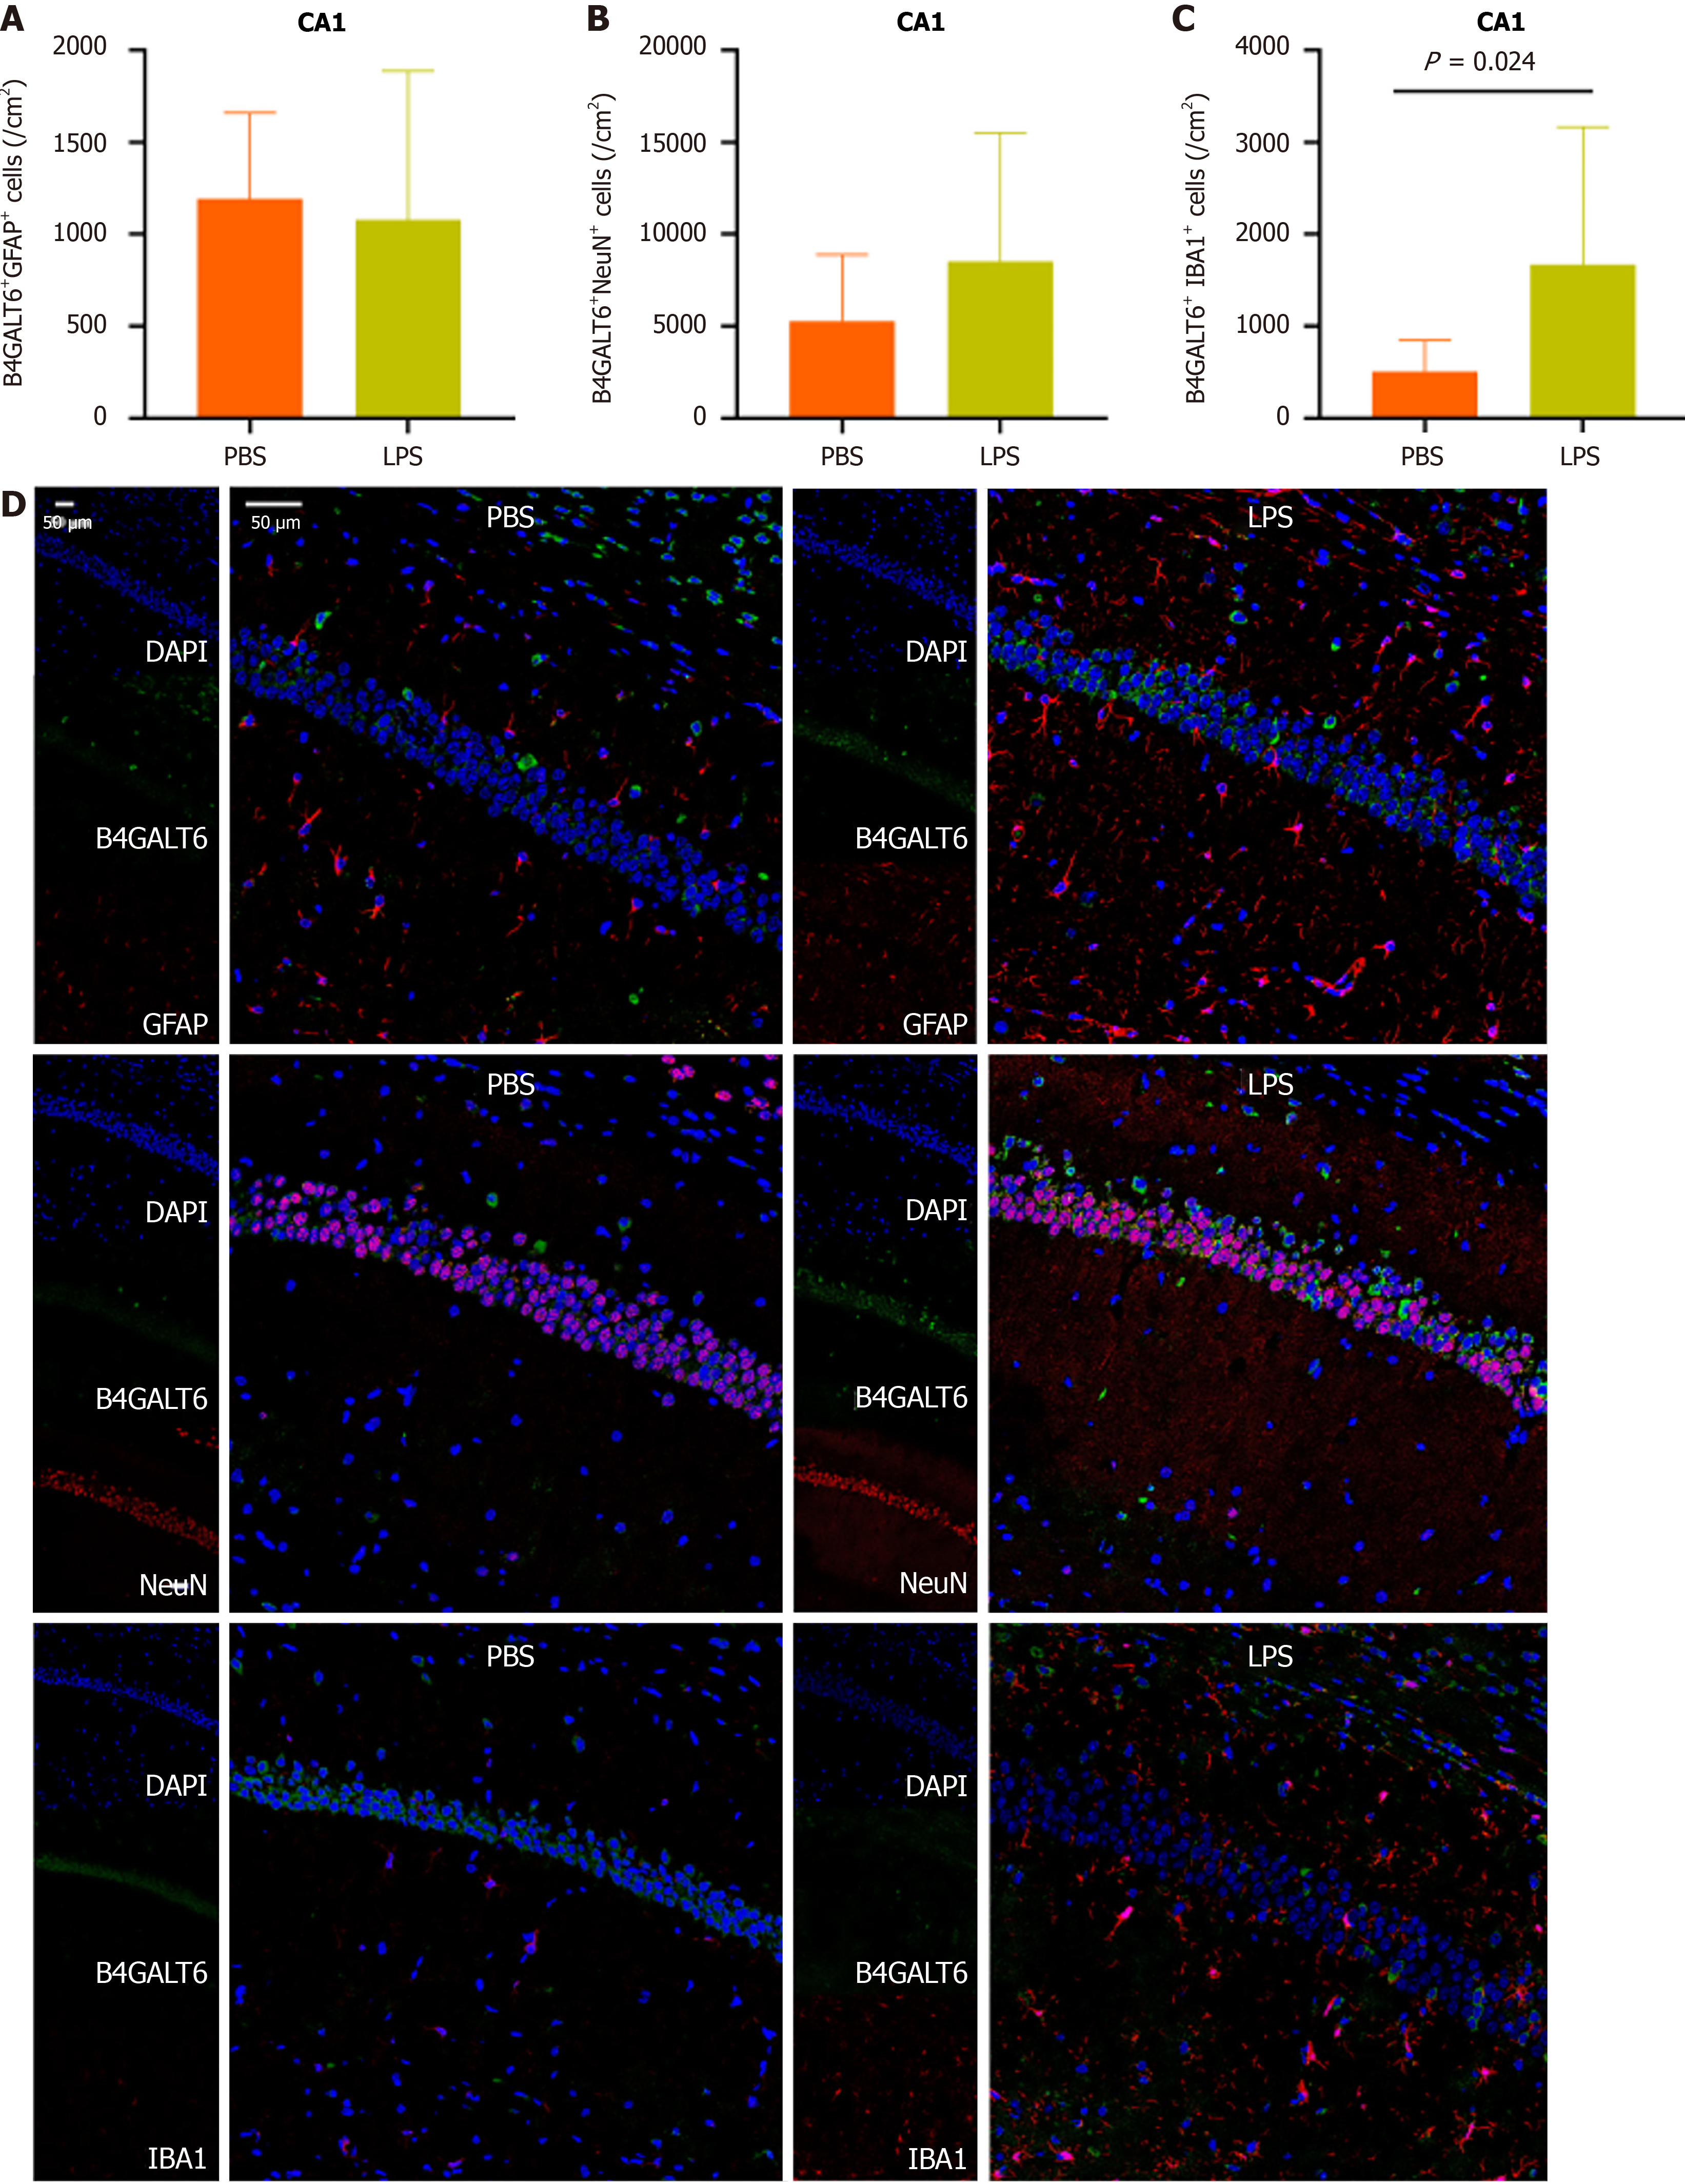
Figure 3 Brains from depressive-like mice have increased B4GALT6+IBA1+cell density within the hippocampal CA1 region.
A: Statistical results of the number of B4GALT6 and GFAP co-labeled cells (B4GALT6+GFAP+) in the hippocampal CA1 region, with no significant difference between the two groups; B: Statistical results of the number of B4GALT6 and NeuN co-labeled cells (B4GALT6+NeuN+) in the hippocampal CA1 region, with no significant difference between the two groups; C: Statistical results of the number of B4GALT6 and IBA1 co-labeled cells (B4GALT6+IBA1+) in the hippocampal CA1 region, with a significant increase in the lipopolysaccharides (LPS) group compared to the phosphate-buffered saline (PBS) group; D: Immunofluorescence co-localization images of the hippocampal CA1 region, showing the co-localization of DAPI (cell nuclei, blue), B4GALT6 (red) with IBA1 (green), GFAP (green), and NeuN (green) in the PBS group and LPS group, respectively. The number of B4GALT6+IBA1+ cells in the LPS group was increased compared to the PBS group. LPS: Lipopoly
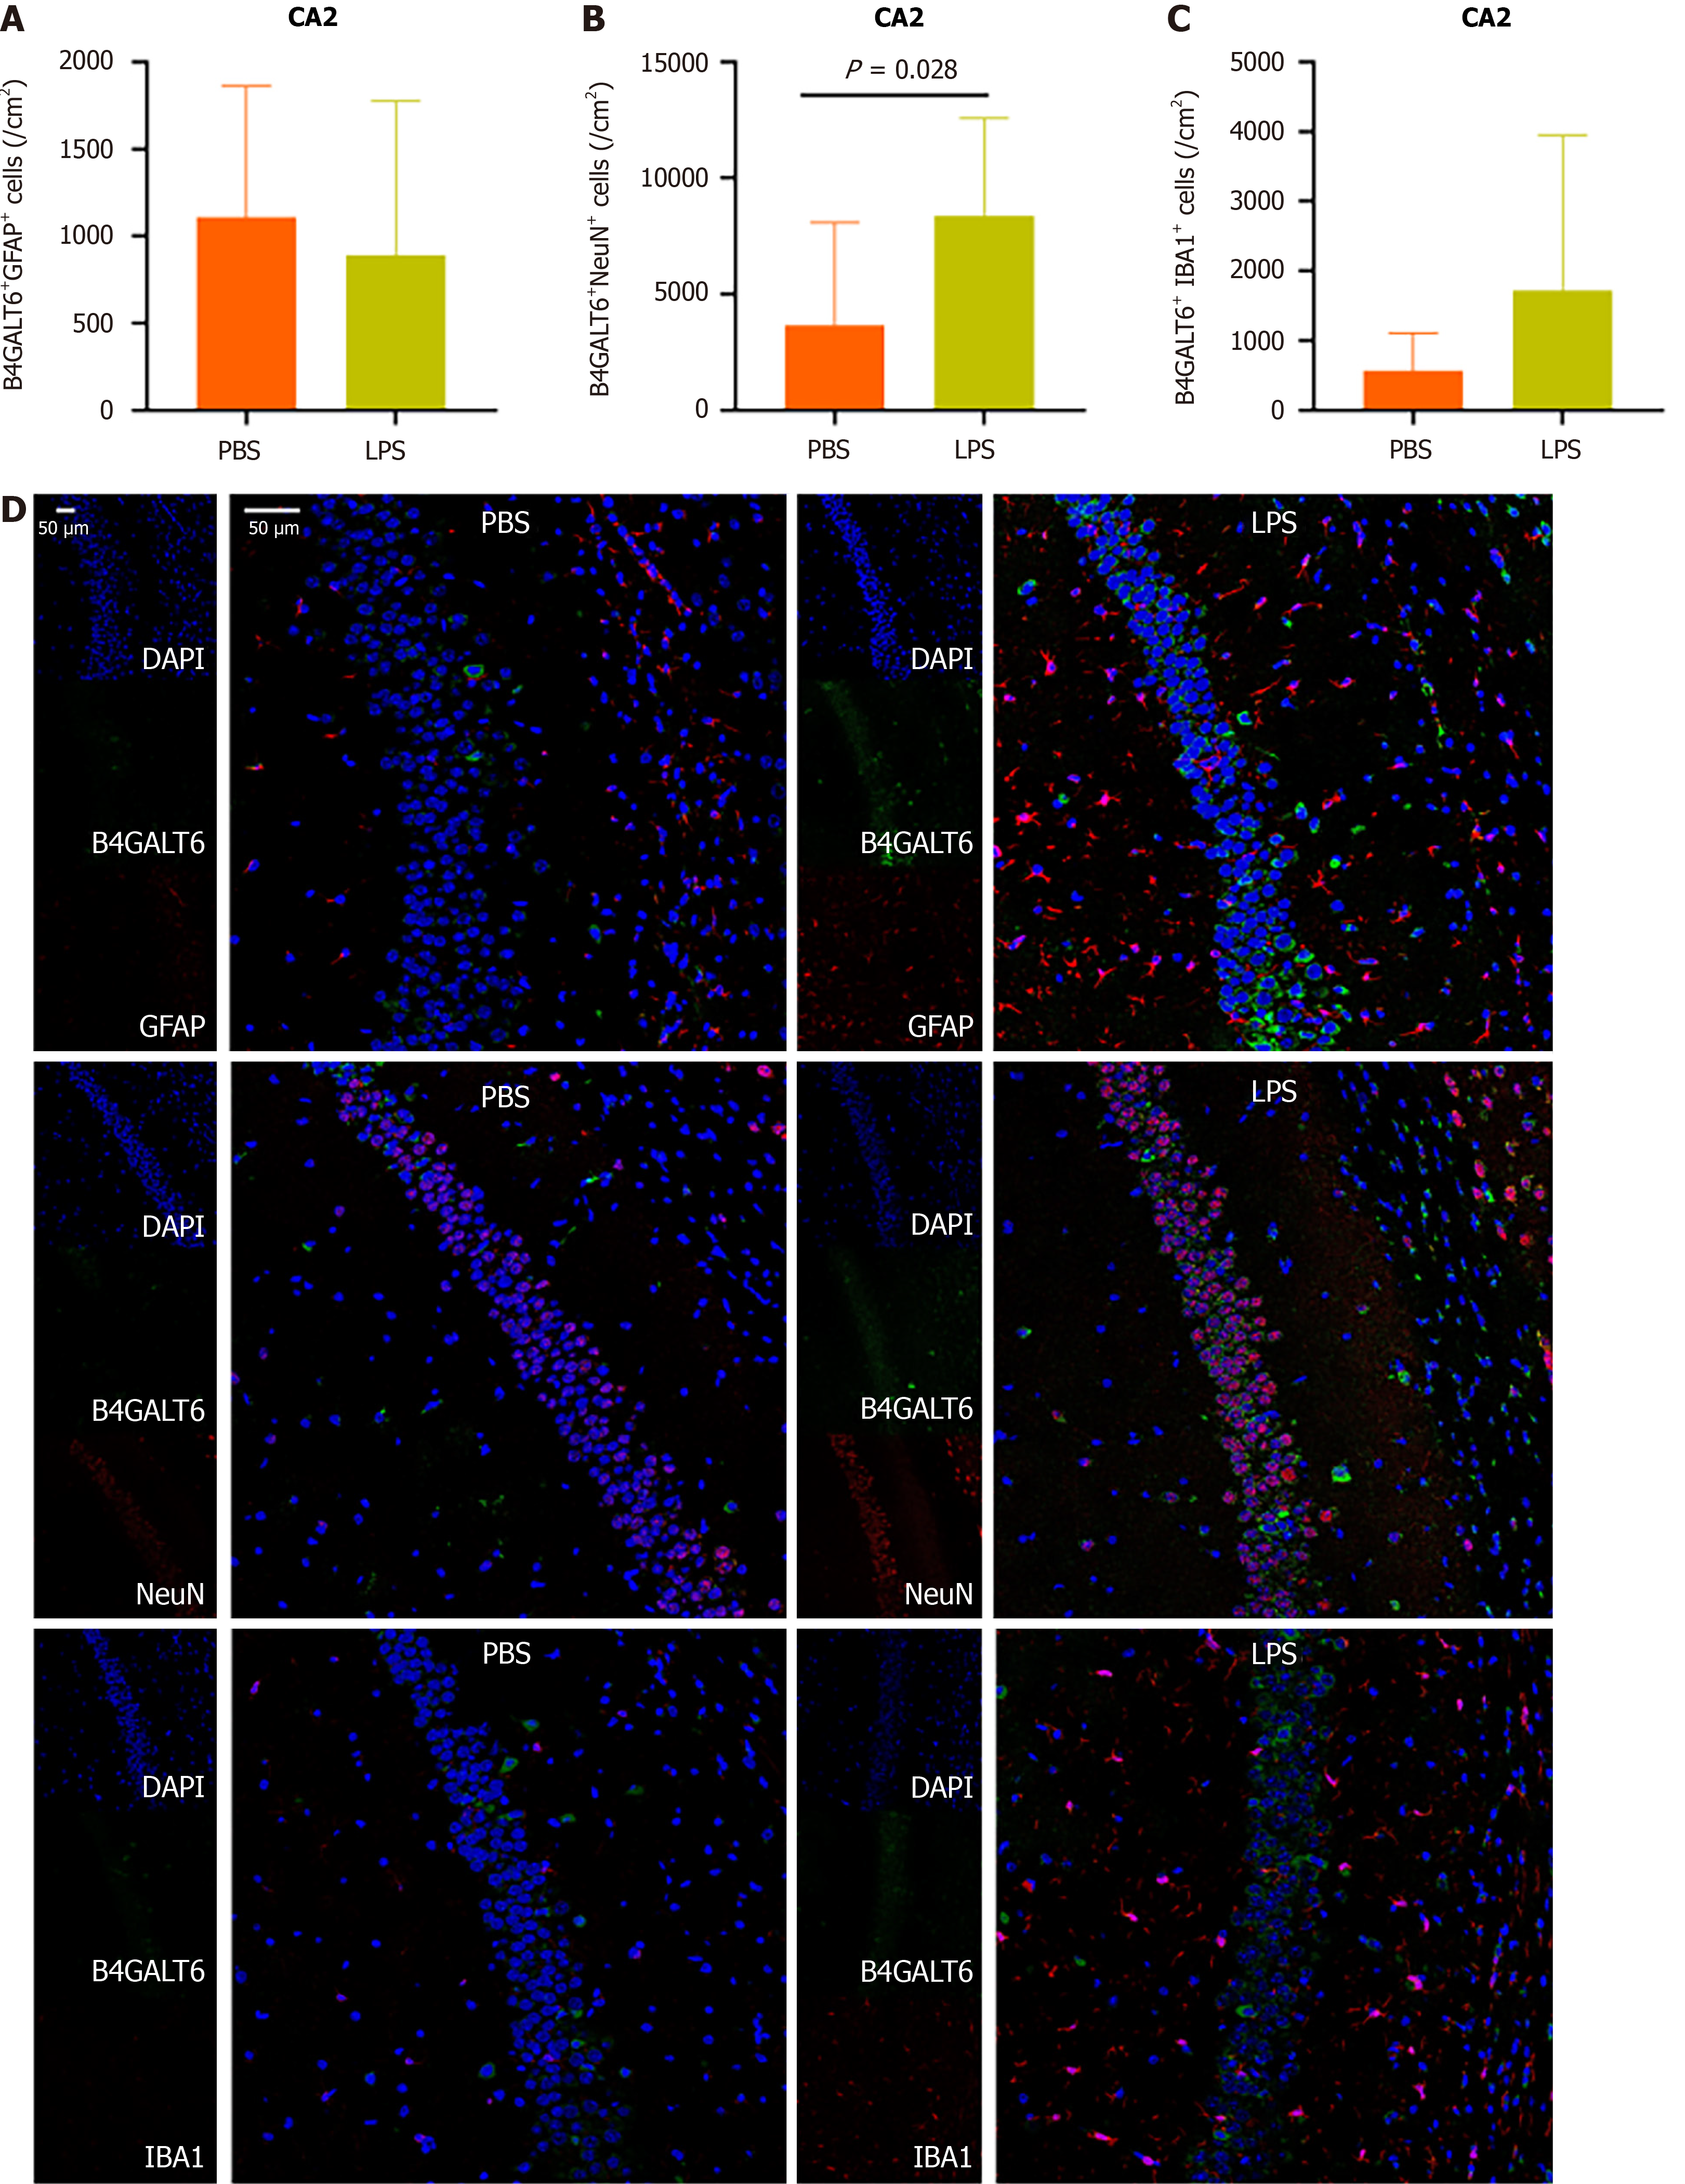
Figure 4 The hippocampal CA2 region of depressive-like mice have an increased density of B4GALT6+NeuN+ cells.
A: Statistical results of the number of B4GALT6 and GFAP co-labeled cells (B4GALT6+GFAP+) in the hippocampal CA2 region, with no significant difference between the two groups; B: Statistical results of the number of B4GALT6 and NeuN co-labeled cells (B4GALT6+NeuN+) in the hippocampal CA2 region, indicating that the number of such cells in the lipopolysaccharides (LPS) group was significantly higher than that in the phosphate-buffered saline (PBS) group; C: Statistical results of the number of B4GALT6 and IBA1 co-labeled cells (B4GALT6+IBA1+) in the hippocampal CA2 region, with no significant difference between the two groups; D: Immunofluorescence co-localization images of the hippocampal CA2 region, displaying the co-localization of DAPI (blue), B4GALT6 (red) with NeuN (green), GFAP (green), and IBA1 (green) in the PBS group and LPS group. The number of B4GALT6+NeuN+ cells was higher in the LPS group compared to the PBS group. LPS: Lipopolysaccharides; PBS: Phosphate-buffered saline.
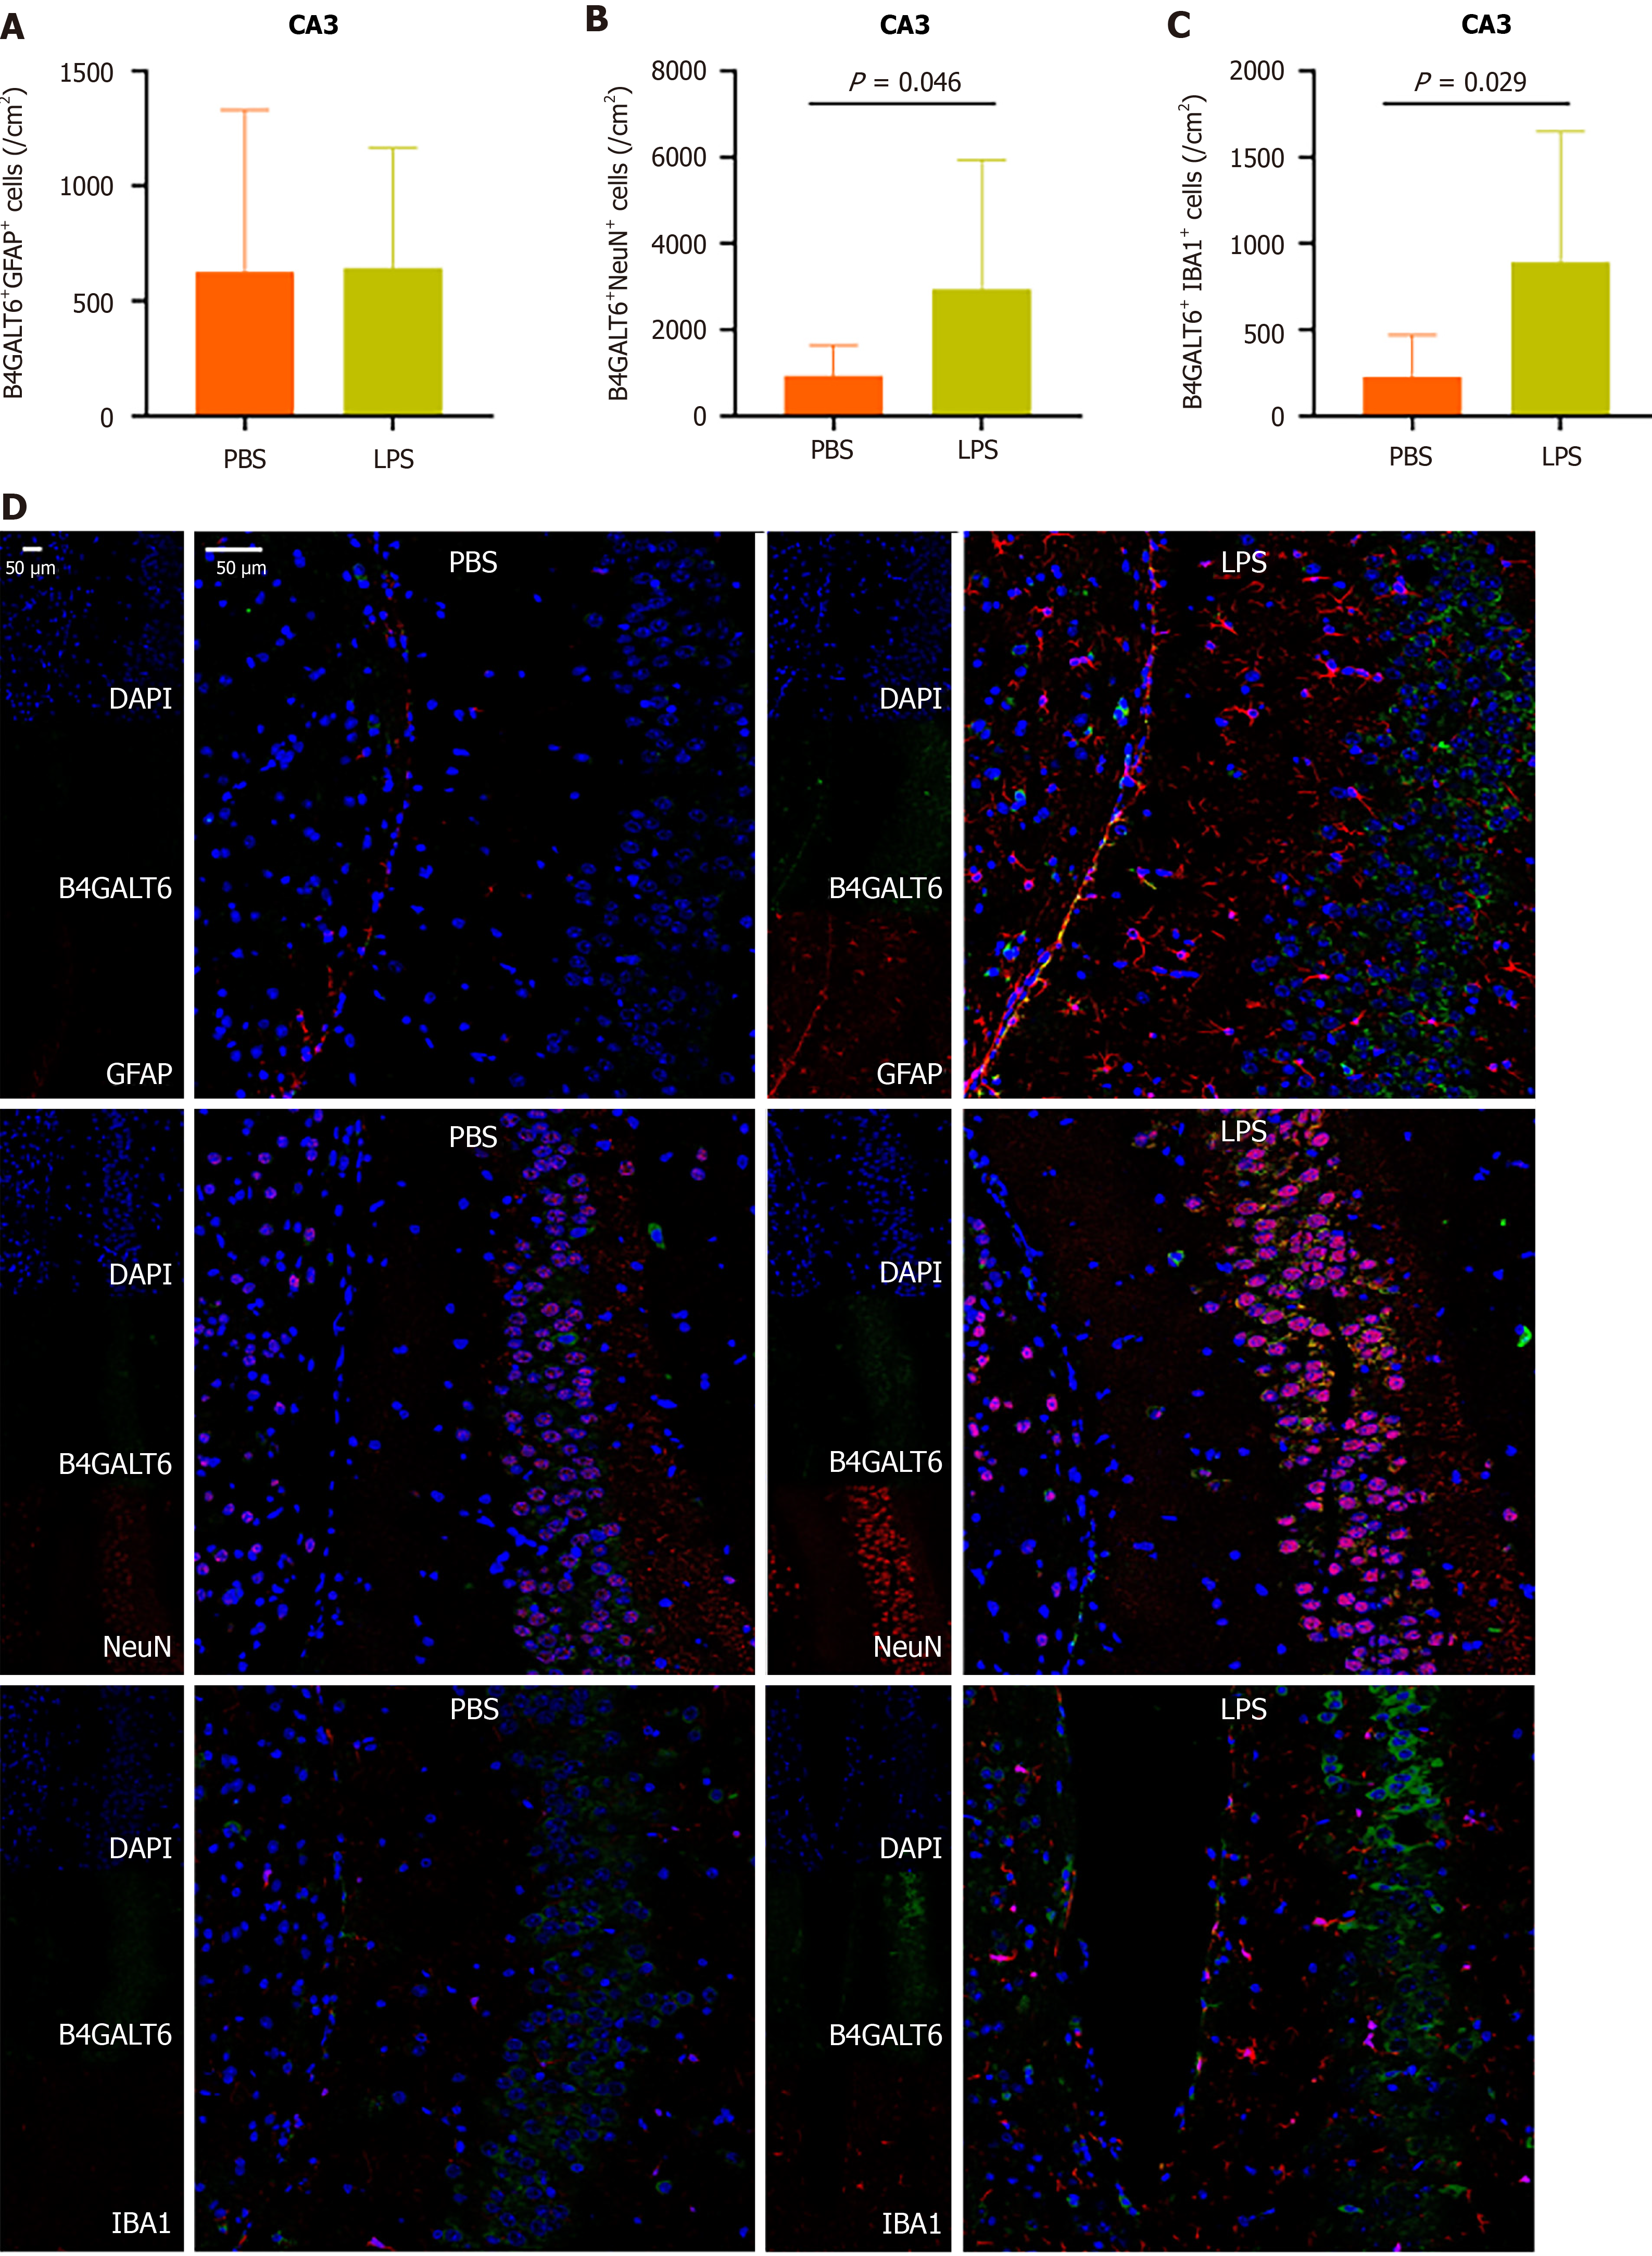
Figure 5 The main cellular differences between the phosphate buffer saline group and the lipopolysaccharides group in the hippocampal CA3 region were neurons and microglia.
A: Statistical results of the number of B4GALT6 and GFAP co-labeled cells (B4GALT6+GFAP+) in the hippocampal CA3 region, with no significant difference between the two groups; B: Statistical results of the number of B4GALT6 and NeuN co-labeled cells (B4GALT6+NeuN+) in the hippocampal CA3 region, revealing that the number of such cells in the lipopolysaccharides (LPS) group was significantly higher than that in the phosphate-buffered saline (PBS) group; C: Statistical results of the number of B4GALT6 and IBA1 co-labeled cells (B4GALT6+IBA1+) in the hippocampal CA3 region, showing that the number of such cells was significantly higher in the LPS group compared to the PBS group; D: Immunofluorescence co-localization images of the hippocampal CA3 region, presenting the co-localization of DAPI (blue), B4GALT6 (red) with NeuN (green), IBA1 (green), and GFAP (green) in the PBS group and LPS group. The numbers of positive co-labeled cells in neurons and microglia in the LPS group were both higher than those in the PBS group. LPS: Lipo
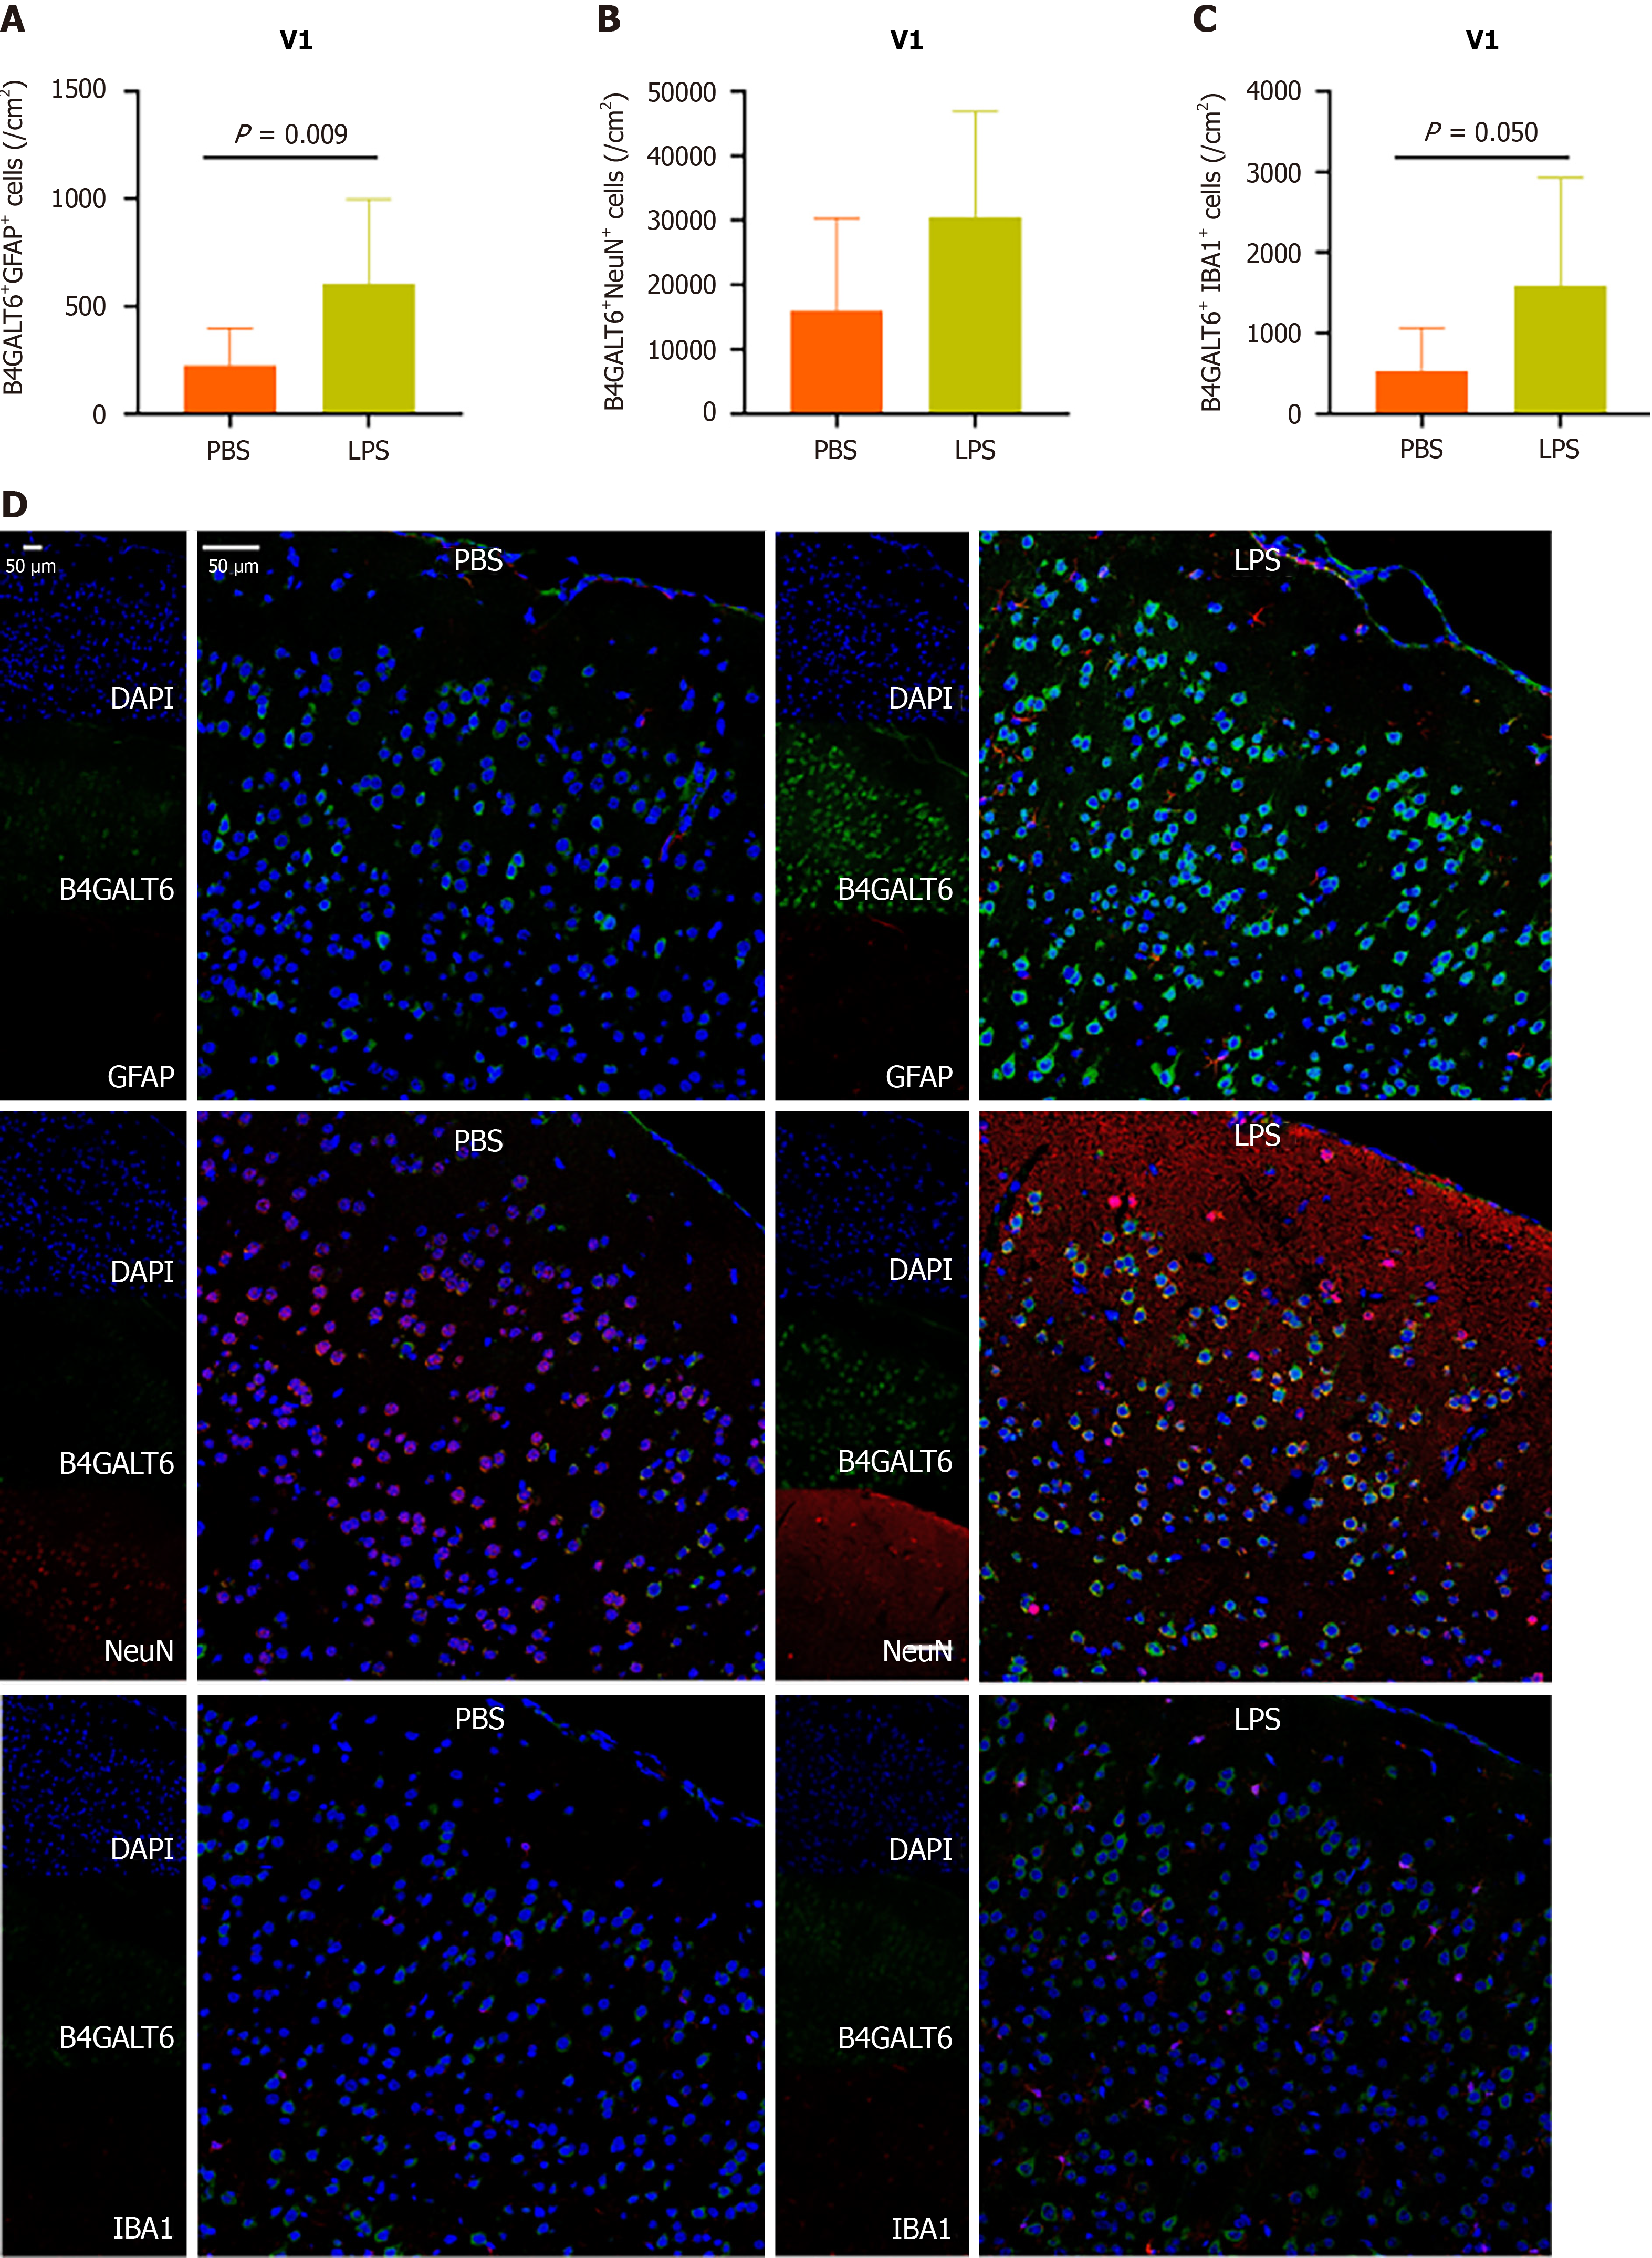
Figure 6 B4GALT6 functions in astrocytes and microglia in the V1 region of the visual cortex.
A: Statistical results of the number of B4GALT6 and GFAP co-labeled cells (B4GALT6+GFAP+) in the V1 region of the visual cortex, indicating that the number of such cells in the lipopolysaccharides (LPS) group was significantly higher than that in the phosphate-buffered saline (PBS) group; B: Statistical results of the number of B4GALT6 and NeuN co-labeled cells (B4GALT6+NeuN+) in the V1 region of the visual cortex, with no significant difference between the two groups; C: Statistical results of the number of B4GALT6 and IBA1 co-labeled cells (B4GALT6+IBA1+) in the V1 region of the visual cortex, demonstrating that the number of such cells in the LPS group was significantly higher than that in the PBS group; D: Immunofluorescence co-localization images of the V1 region of the visual cortex, showing the co-localization of DAPI (blue), B4GALT6 (red) with IBA1 (green), GFAP (green), and NeuN (green) in the PBS group and LPS group. The numbers of positive co-labeled cells in microglia and astrocytes in the LPS group were significantly higher than those in the PBS group. LPS: Lipopolysaccharides; PBS: Phosphate-buffered saline.
- Citation: Zhang SN, Luan D, Sheng BY, Xie B, Xiao L. Brain region and cell specificity of B4GALT6 in mice with depressive-like behavior: A pilot study. World J Psychiatry 2025; 15(10): 109425
- URL: https://www.wjgnet.com/2220-3206/full/v15/i10/109425.htm
- DOI: https://dx.doi.org/10.5498/wjp.v15.i10.109425


