Published online Feb 24, 2024. doi: 10.5306/wjco.v15.i2.243
Peer-review started: October 18, 2023
First decision: November 17, 2023
Revised: December 4, 2023
Accepted: January 11, 2024
Article in press: January 11, 2024
Published online: February 24, 2024
Processing time: 125 Days and 2.8 Hours
The development and progression of hepatocellular carcinoma (HCC) have been reported to be associated with immune-related genes and the tumor microenvironment. Nevertheless, there are not enough prognostic biomarkers and models available for clinical use. Based on seven prognostic genes, this study calculated overall survival in patients with HCC using a prognostic survival model and revealed the immune status of the tumor microenvironment (TME).
To develop a novel immune cell-related prognostic model of HCC and depict the basic profile of the immune response in HCC.
We obtained clinical information and gene expression data of HCC from The Cancer Genome Atlas (TCGA) and International Cancer Genome Consortium (ICGC) datasets. TCGA and ICGC datasets were used for screening prognostic genes along with developing and validating a seven-gene prognostic survival model by weighted gene coexpression network analysis and least absolute shrinkage and selection operator regression with Cox regression. The relative analysis of tumor mutation burden (TMB), TME cell infiltration, immune check
Seven prognostic genes were identified for signature construction. Survival receiver operating characteristic curve analysis showed the good performance of survival prediction. TMB could be regarded as an independent factor in HCC survival prediction. There was a significant difference in stromal score, immune score, and estimate score between the high-risk and low-risk groups stratified based on the risk score derived from the seven-gene prognostic model. Several immune checkpoints, including VTCN1 and TNFSF9, were found to be associated with the seven prognostic genes and risk score. Different combinations of checkpoint blockade targeting inhibitory CTLA4 and PD1 receptors and potential chemotherapy drugs hold great promise for specific HCC therapies. Potential pathways, such as cell cycle regulation and metabolism of some amino acids, were also identified and analyzed.
The novel seven-gene (CYTH3, ENG, HTRA3, PDZD4, SAMD14, PGF, and PLN) prognostic model showed high predictive efficiency. The TMB analysis based on the seven genes could depict the basic profile of the immune response in HCC, which might be worthy of clinical application.
Core Tip: In this work, we focused on establishing a prognostic survival model with seven prognostic genes to predict overall survival in patients with hepatocellular carcinoma (HCC) and revealing the tumor microenvironment based on intersecting genes of The Cancer Genome Atlas and The Cancer Genome Atlas datasets. In addition, potential chemotherapy drugs could provide useful insights into the potential clinical treatment of HCC.
- Citation: Li MT, Zheng KF, Qiu YE. Identification of immune cell-related prognostic genes characterized by a distinct microenvironment in hepatocellular carcinoma. World J Clin Oncol 2024; 15(2): 243-270
- URL: https://www.wjgnet.com/2218-4333/full/v15/i2/243.htm
- DOI: https://dx.doi.org/10.5306/wjco.v15.i2.243
Hepatocellular carcinoma (HCC) is a common cancer that has the highest prevalence among liver cancer subtypes. It is well known that the mortality of HCC has increased gradually and is likely to break through millions of cases[1]. Despite rapid technological and medical advances in new tests and treatments for HCC patients, their overall five-year survival rate is less than 5%[2]. In addition, since HCC has no specific clinical manifestations, patients might have been diagnosed in the late stages. In this regard, it is necessary to explore novel prognostic biomarkers and risk models to help forecast overall survival (OS) of HCC patients with greater accuracy.
The immune system and immune cells are both considered to be essential for developing various cancers, including HCC[3]. A previous study reported that an imbalance in immune regulation affected the cancer microenvironment and contributed to tumor progression and metastasis[4]. The altered crosstalk between tumor cells and the immune system repre
In this research, we first identified immune cell-related genes (ICRGs) through weighted gene coexpression network analysis (WGCNA) in The Cancer Genome Atlas (TCGA) datasets to explore the potential prognostic immune-related genes that were most enriched and correlated with HCC. After least absolute shrinkage and selection operator regression (LASSO) regression with Cox regression analysis, we identified seven ICRGs to establish and validate a well-worked prognostic model in the TCGA and International Cancer Genome Consortium (ICGC) datasets. Meanwhile, a series of bioinformatic analyses, including protein–protein interaction, immune checkpoint analysis, immune checkpoint blockade, chemotherapy drug analysis, gene set variation analysis (GSVA), and gene set enrichment analysis, were also performed to determine how all immune cell-related genes may impact HCC's TME in this study. The results of this scenario also helped determine potential biomarkers that might be novel therapeutic targets in HCC. Our study also identified biomarkers that help determine the best therapeutic strategy for each patient.
The clinical information of HCC patients and corresponding cancer tissue RNA-seq data were identified and retrieved from the TCGA (https://portal.gdc.cancer.gov/repository) for model construction and ICGC (https://dcc.icgc.org/projects/LIRI-JP/) database for validation. There were 374 HCC tissues and 50 normal tissues in the TCGA dataset, and 265 tumor samples in the ICGC dataset.
First, we identified the hub immune-cell-related genes through weighted gene coexpression network analysis (WGCNA). A co-expression network of ICRGs was built by using the R package “WGCNA v1.68”. After a topological overlapping matrix was performed to detect modules, 405 genes in black module were chosen and regarded as ICRGs. Next, we identified 338 differentially expressed ICRGs with the screening standard set as P < 0.05. In addition, String (Pro
A penalized shrunken regression method named LASSO was conducted on the β-coefficients to minimize potential overfitting. Based on the results of the Cox regression analysis, seven prognostic ICRGs were identified and used to construct a prognostic model. We calculated and obtained each patient’s risk score according to the formula below: Risk score = esum (each gene’s expression × corresponding coefficient). Then, a model for immune-cell-related prognostic indicators was developed as follows: Risk score = ∑I = 1 N (Explg*Coef). The median risk score could be used to divide HCC samples into low-risk (< median) and high-risk (≥ median) groups.
OS probability analysis and the time-dependent receiver operating characteristic (ROC) curve analysis based on the risk model and seven prognostic ICRGs were performed using the R package “survival”, “survminer”, “survivalROC”, or “timeROC”. Using the R package “survival”, we performed multivariate and univariate prognostic analyses based on the TCGA and ICGC datasets, respectively. In addition, the area under the curve (AUC) values of the seven prognostic ICRGs, the risk model, and various clinical factors for predicting the survival at 1, 3, and 5 years were calculated.
The available clinical factors, like age, gender, tumor grade, and tumor stage, were compared to assess the clinical implication of the model and depicted using the R package “ggpubr”. In order to improve the possibility of usage in clinical practice, a nomogram was constructed and the calibration curves were plotted based on the seven prognostic ICRGs with the help of the R package “rms”.
We assessed the status of TMB and somatic mutations in HCC in the two risk groups with the help of the R package “maftools”. The Kaplan-Meier curves were also obtained after HCC samples were divided into high-TMB or low-TMB groups.
Next, we further depicted the TME of HCC in the risk model by assessing the immune-related functions of immune cells through single-sample gene set enrichment analysis (ssGSEA) using the R package “gsva”. For assessing immune infiltration subtype between the high- and low-risk groups, we performed two-way ANOVA. The relationship between tumor stemness and risk score was assessed by Spearman correlation analysis. ESTIMATE algorithm was used to explore the levels of cell infiltration by calculating the immune and stromal scores.
Immune checkpoint (ICP) analysis was conducted to determine and visualise the correlations among genes related to ICPs, the seven ICRGs, and risk scores by using the R packages “limma”, “BiocManager”, “reshape2”, and “ggplot2”. The immunophenoscore (IPS) of HCC samples was collected from the cancer-immune group atlas (https://tcia.at/home). The higher the IPS score, the higher the positive correlation with increased immunogenicity. The tumor immune dysfunction and exclusion (TIDE) algorithm (http://tide.dfci.harvard.edu) was used to predict the response to immune checkpoint blockade (ICB) treatment in the two risk groups.
To predict the half-maximal inhibitory concentration (IC50) of chemotherapeutic agents for each patient in the two risk groups, the R package “pRRophetic” (https://github.com/paulgeeleher/pRRophetic) was used. However, based on the risk model, a great number of chemotherapeutic drug were found. In order to conduct further research on HCC, we selected four commonly used drugs that had been used in clinical trials.
Meanwhile, data of NCI-60 human cancer cell lines from a publicly available dataset from CellMiner project page (https://discover.nci.nih.gov/cellminer) were also downloaded to determine the connection between the seven ICRGs and drug sensitivity.
We determined the potential functional pathways that might play an essential role in HCC progression and TME regulation by GSVA and gene set enrichment analysis (GSEA) with the help of the R packages “BiocManager”, “limma”, “GSEABase”, and “GSEV”.
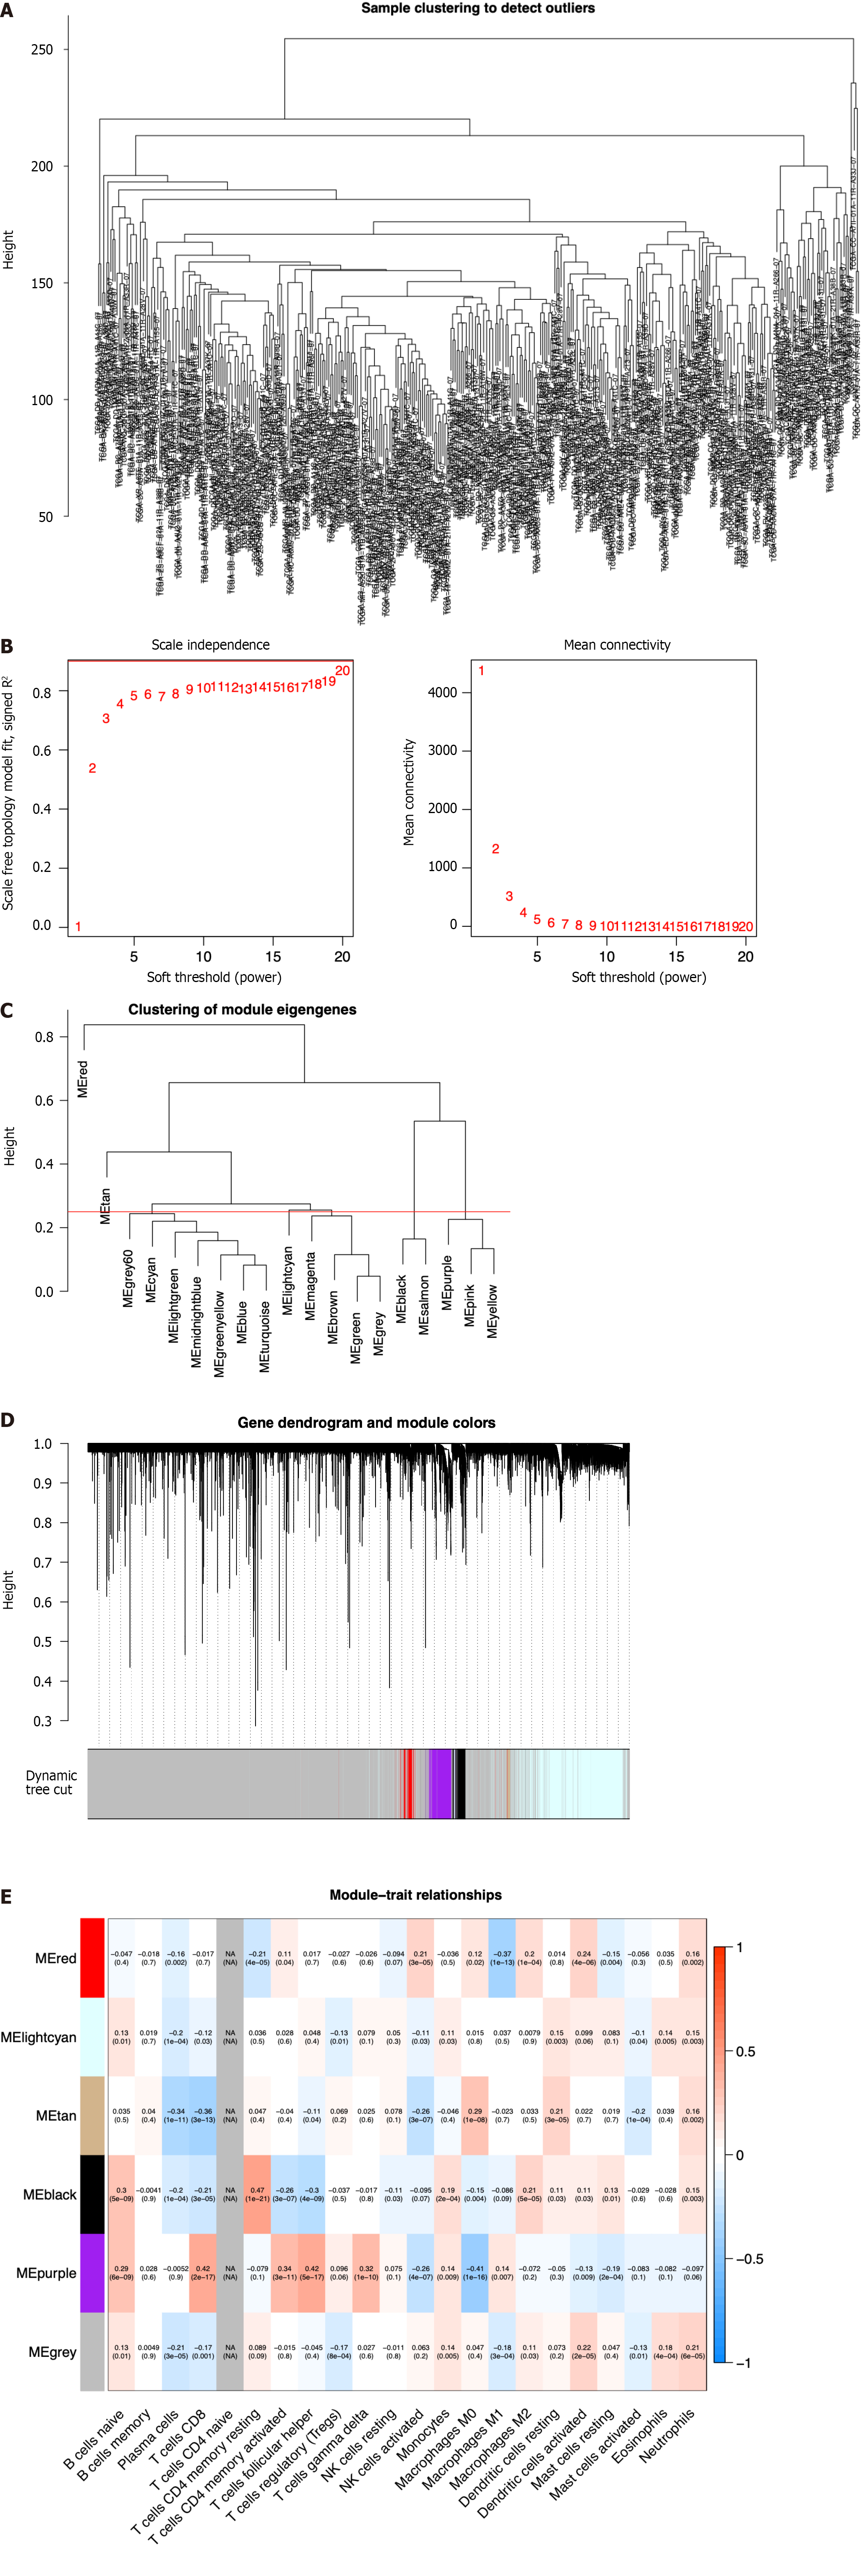
To screen the hub genes related to the TME characteristic index in HCC patients, the RNA-seq data and relevant clinical data of samples (normal:tumor = 50:374) were downloaded from TCGA. The samples were used to identify outliers with the help of hierarchical clustering analysis and no samples were found to be outliers (Figure 1A). Next, we set the β-value to 20 to ensure that the network was scale-free (Figure 1B). After the method of dynamic cutting was implemented, separate gene co-expression modules were divided. Similar modules with a difference < 25% were combined (Figure 1C and D). Modules of similar sizes were screened and merged using the height parameter of 0.25, deep split parameter of 4, and minModuleSize parameter of 60. As a result of WGCNA, we were able to obtain six modules for further research (Figure 1E). In order to ascertain the hub modules, a Pearson test (P < 0.05) was employed to compute the correlation between the characteristic genes of said module and immune-infiltrated cells. Then, based on the criteria of correlation > 0.1 and P < 0.05, we calculated the numbers of immune cells in each module to ascertain the appropriate immune-related module. The 405 genes in the black module were selected for the subsequent research because they had 13 immune cells that met the criteria, compared with 10 in red, 8 in lightcyan, 8 in tan, 11 in purple, and 12 in gray.
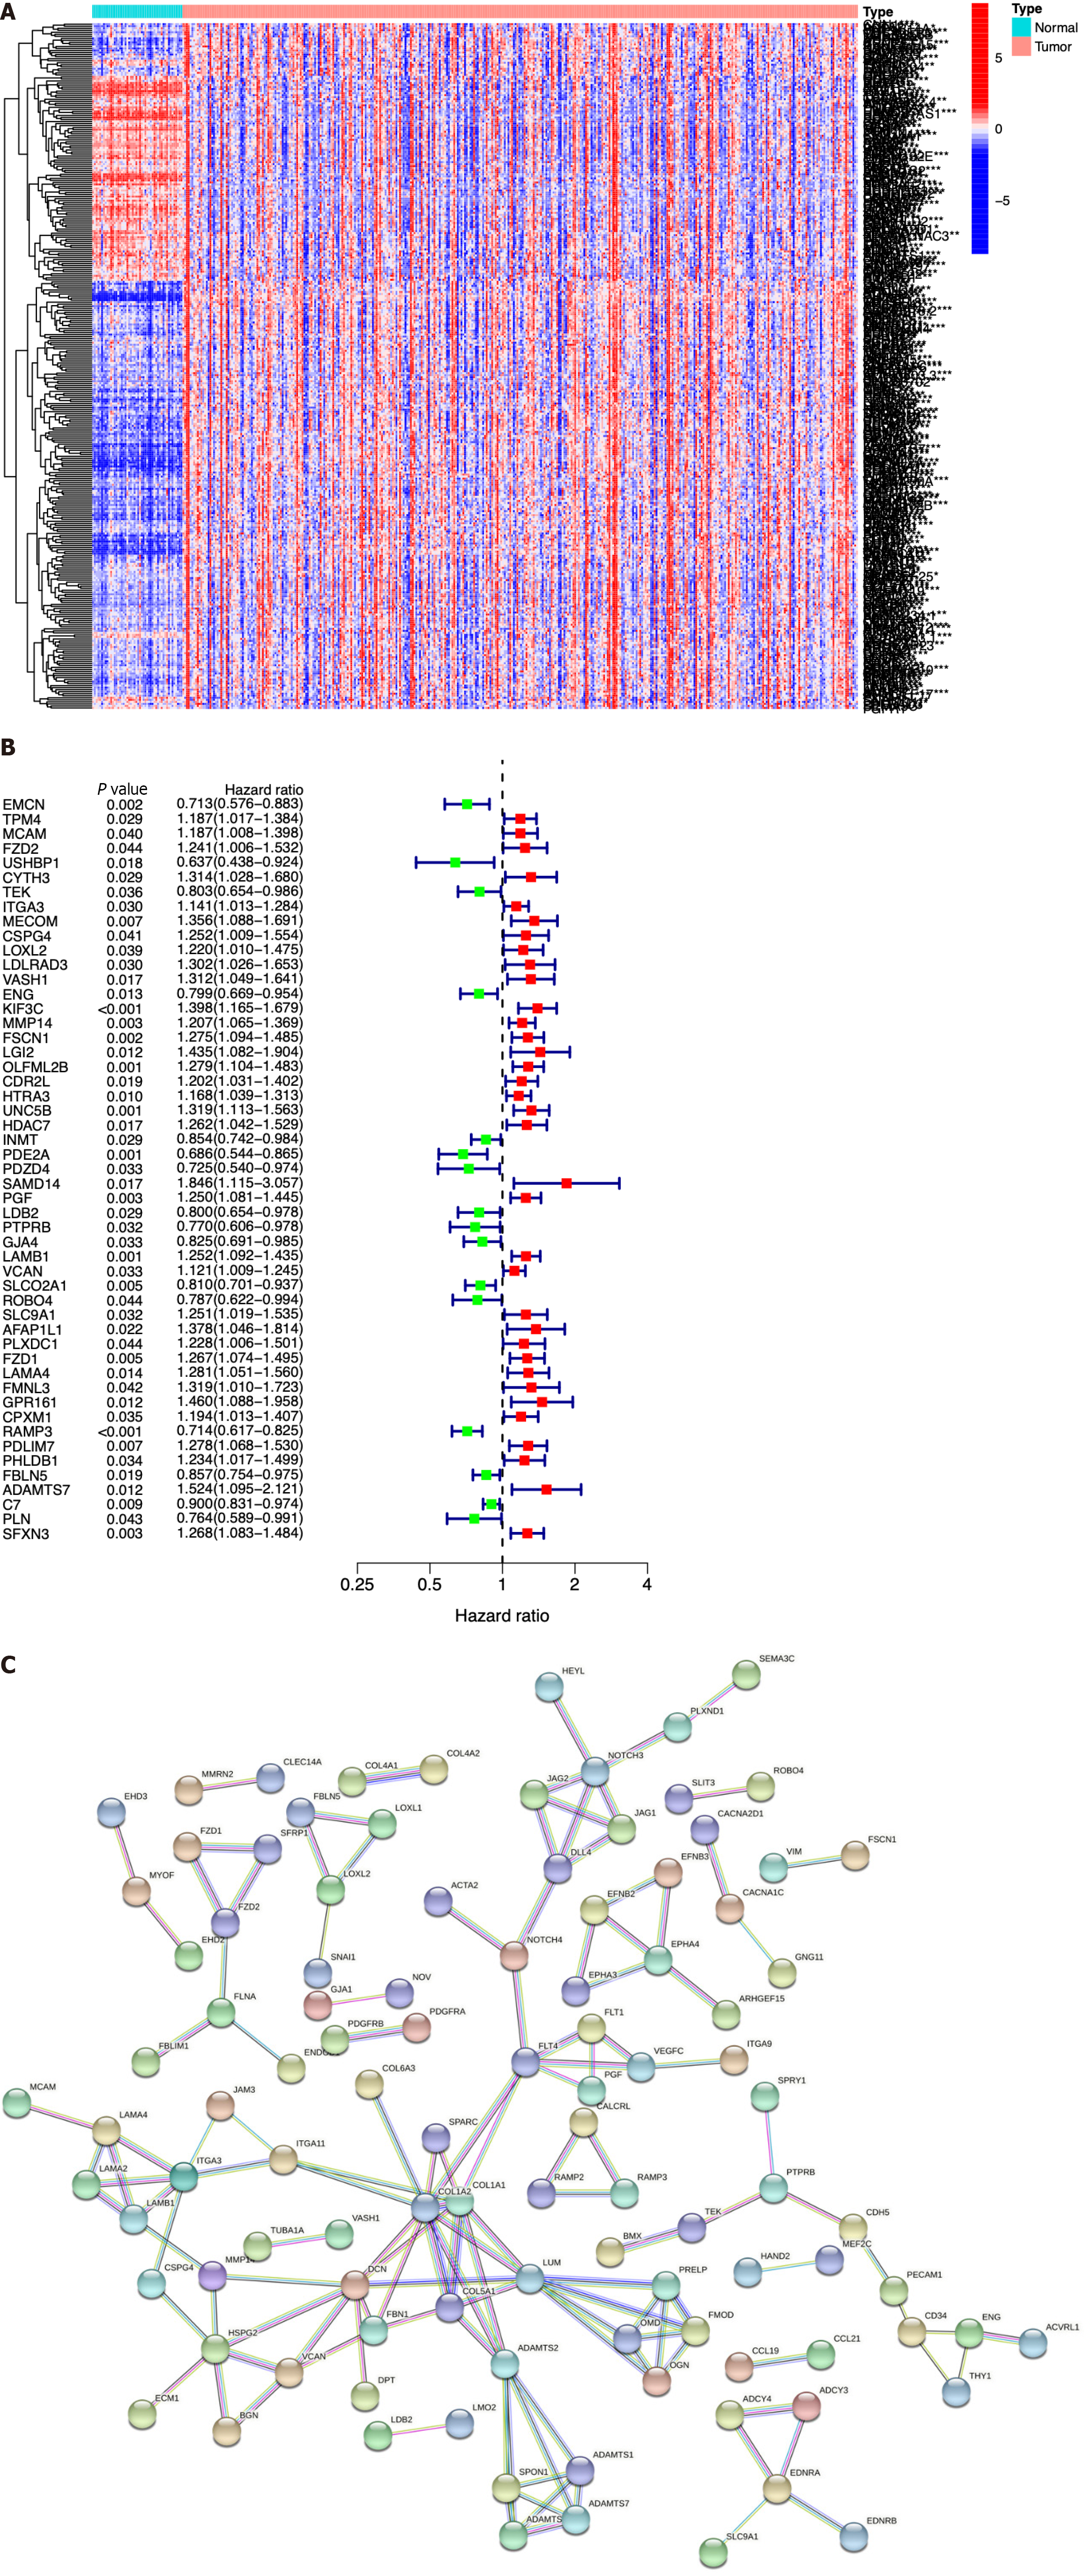
We next identified ICRGs from the 405 genes in the black module. A total of 338 ICRGs were identified and expressed differentially between normal and HCC tissues (Figure 2A). A protein-protein interaction network was constructed to show that the genes could be roughly divided into four categories: Laminin family members, collagen family members, ADAMTS family members, and the Notch signaling network (Figure 2B). Then, we used univariate Cox regression to identify the hub ICRGs that played an essential role in model construction, and 51 hub ICRGs were obtained (Figure 2C).
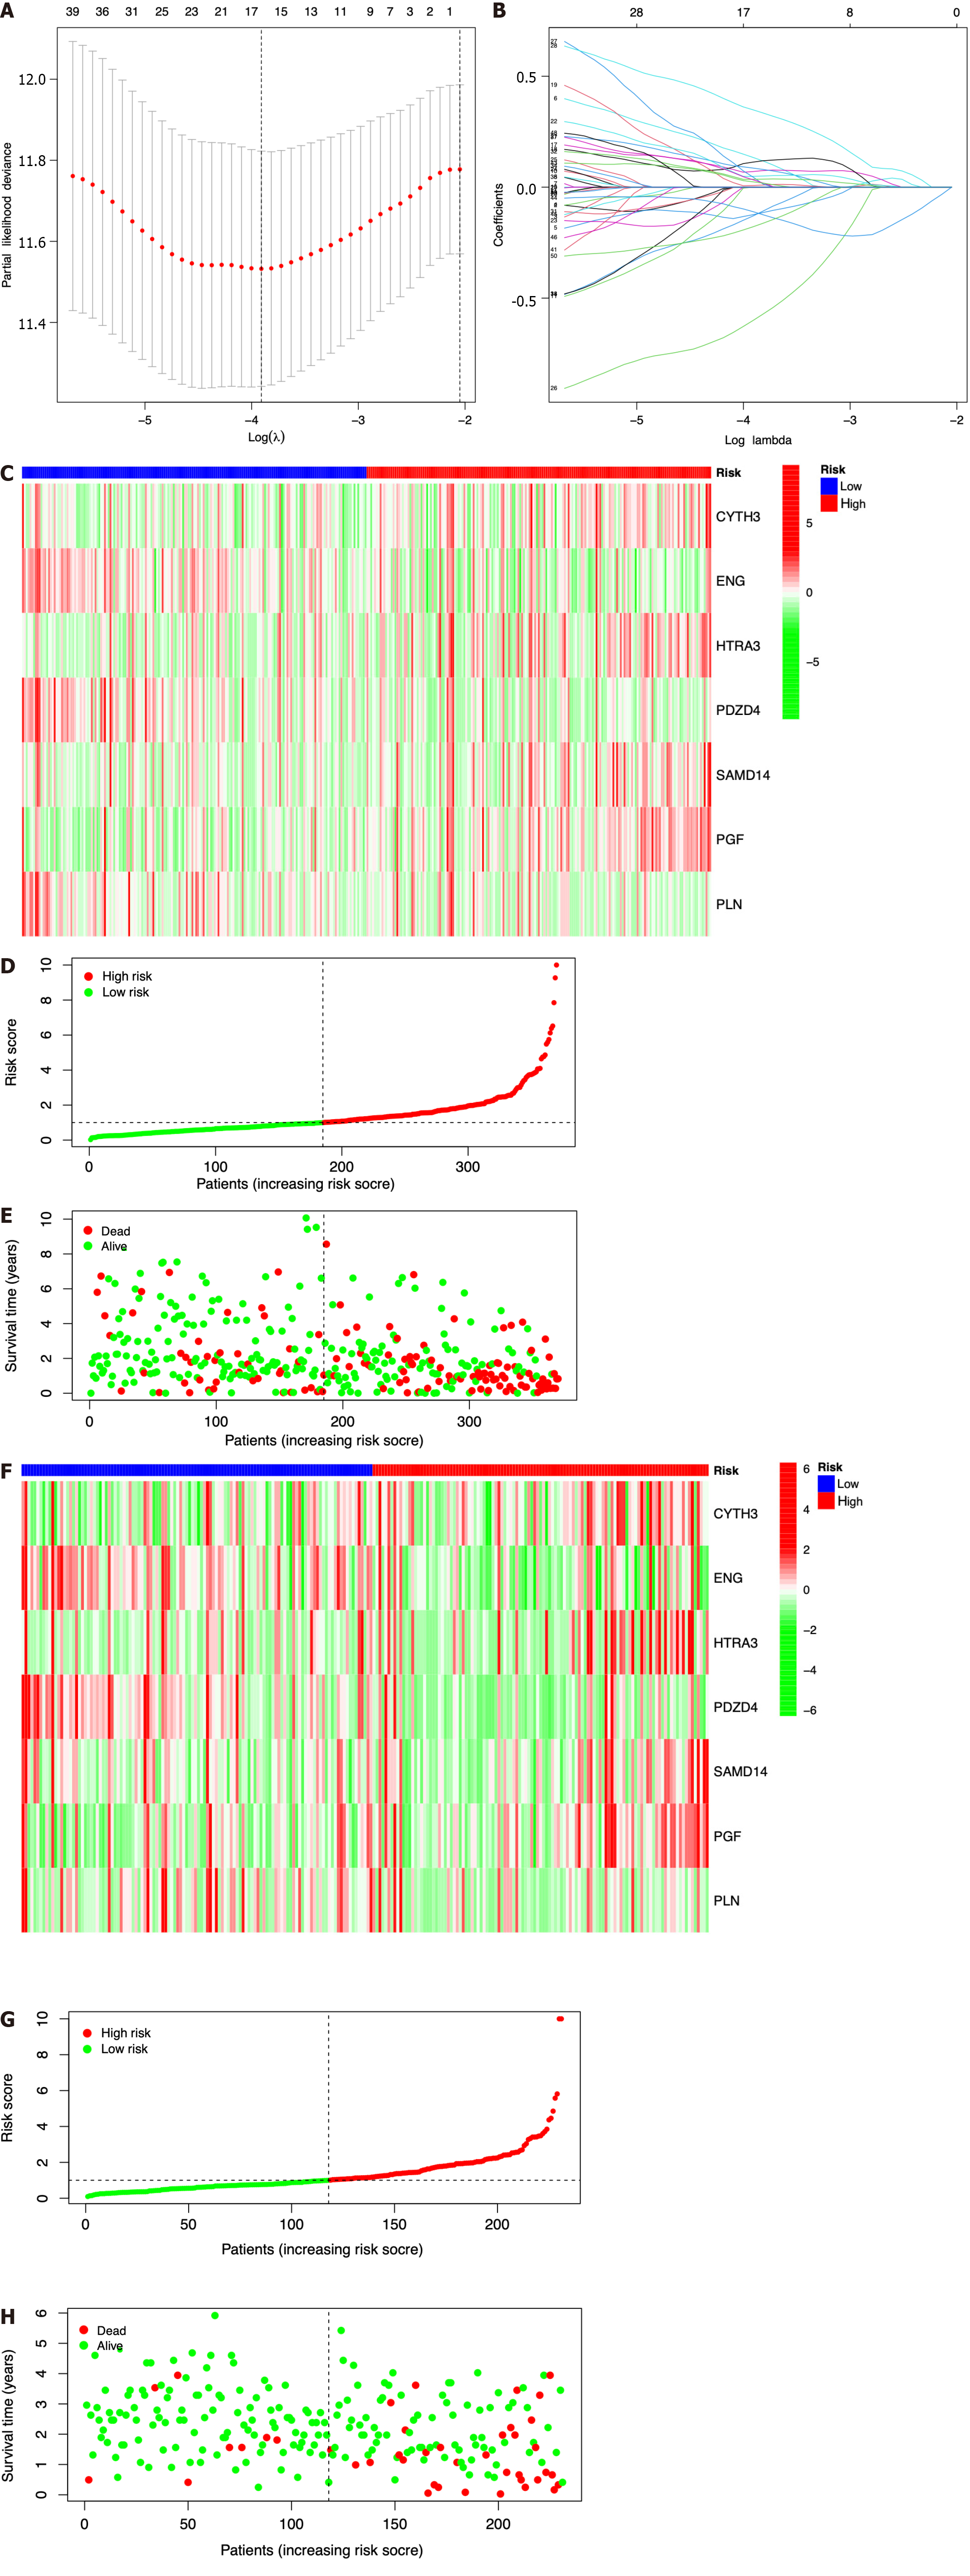
Seven prognostic ICRGs (CYTH3, ENG, HTRA3, PDZD4, SAMD14, PGF, and PLN) were screened out to develop a prognostic signature through the utilization of LASSO Cox regression analysis (Figure 3A and B). According to the formula of risk score = 0.369451059941312 * CYTH3 + -0.287762938289728 * ENG + 0.221566259099006 * HTRA3 + -1.00820639333083 * PDZD4 + 0.542684310219352 * SAMD14 + 0.526196082946206 * PGF + -0.393399578080273 * PLN, the risk score of each patient was calculated. All patients could be divided into high- and low-risk groups based on the seven prognostic ICRGs in the two datasets (Figure 3C and F). Using the median cutoff value of risk scores for patents in the TCGA and ICGC datasets, two groups with high-risk and low-risk scores were also classified (Figure 3D and G). Moreover, as supported by the higher density of red dots observed in the high-risk area within both cohorts, the patients who belonged to the high-risk group might have a worse outcome (Figure 3E and H).
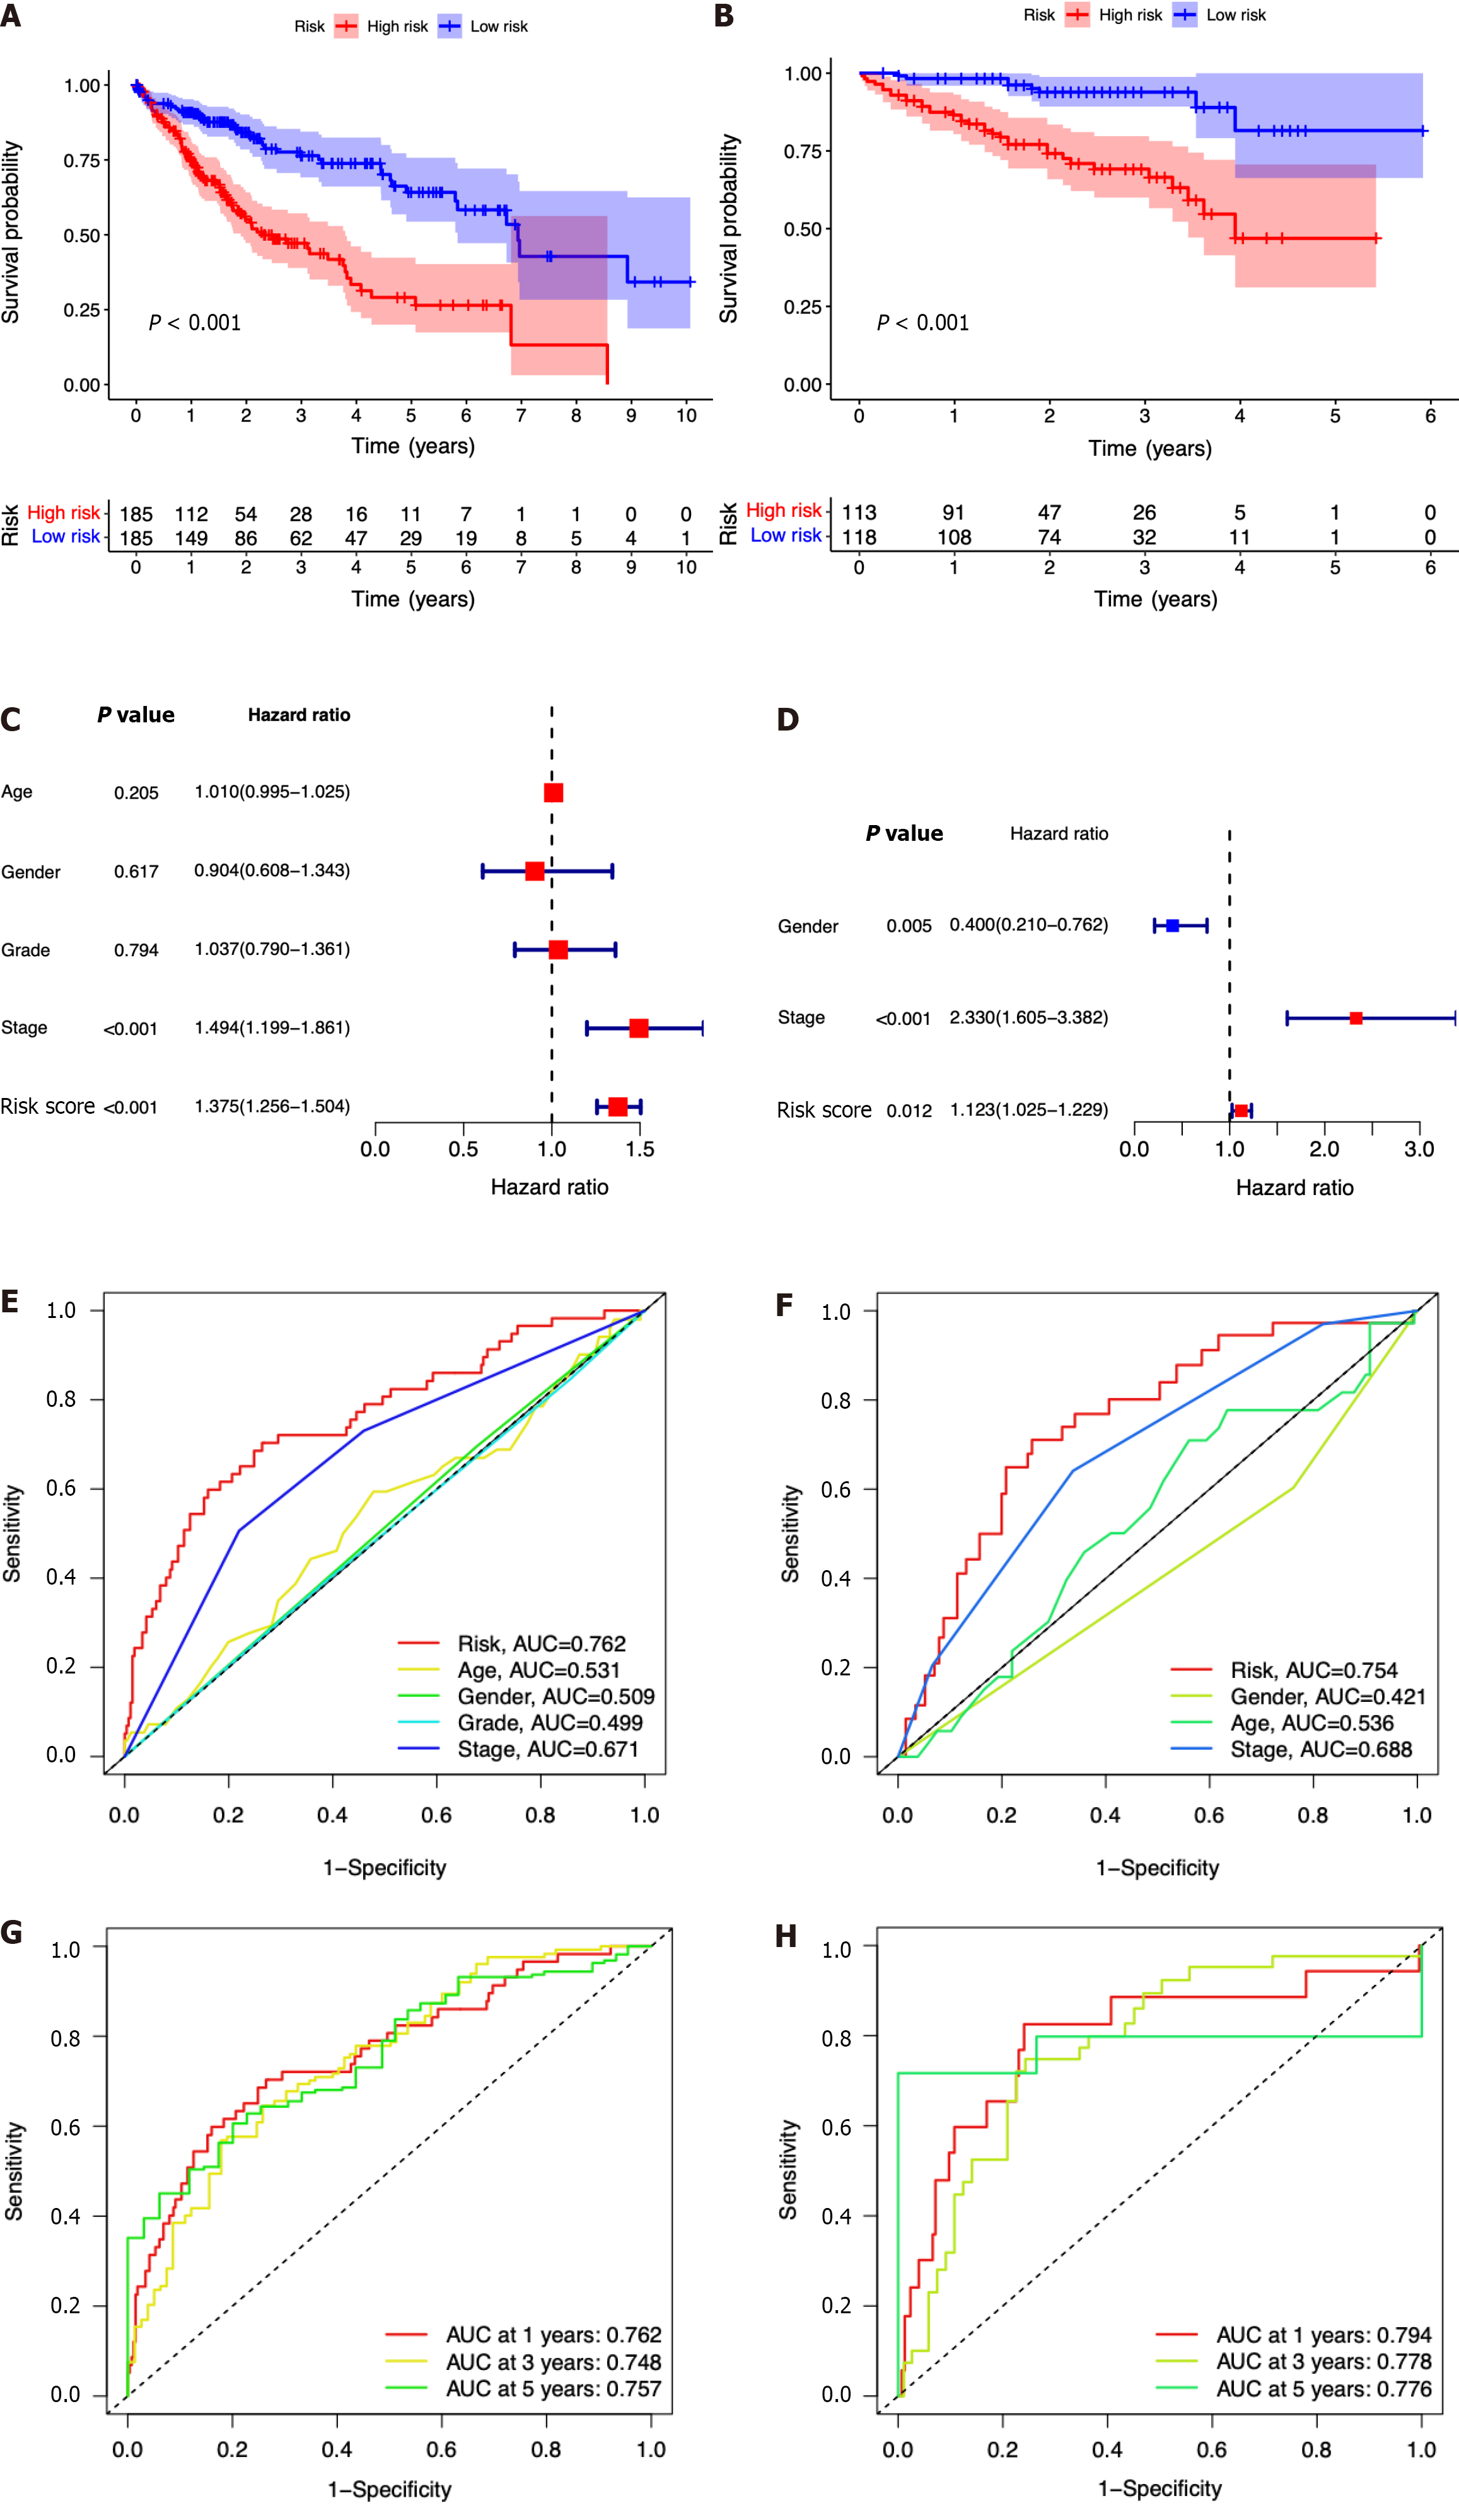
In comparison to those with lower risk scores, patients with higher risk scores exhibited a notably diminished OS in the TCGA dataset, which was further verified in the ICGC dataset (Figure 4A and B). Simultaneously, the potential significance of the risk score as a variable factor in prognostic prediction was also confirmed through univariate Cox regression analysis. In this study, we conducted multivariate survival analyses in both TCGA and ICGC datasets to demonstrate the efficacy of the model. The results revealed a hazard ratio (HR) of 1.375 [95% confidence interval (CI): 1.256-1.504; P < 0.001] in TCGA and an HR of 1.123 (95%CI: 1.025-1.229; P = 0.012) in ICGC (Figure 4C and D). The AUC values demonstrated that the seven-ICRG prognostic model had the highest predictable value in TCGA (AUC = 0.762) and ICGC (AUC = 0.754) compared to other traditional features such as tumor stage, age, sex, and tumor grade (Figure 4E and F). The AUC values obtained from the time-dependent ROC analysis were 0.762, 0.748, and 0.757 at time points of 1, 3, and 5 years in TCGA and 0.794, 0.778, and 0.776 in ICGC, respectively (Figure 4G and H).
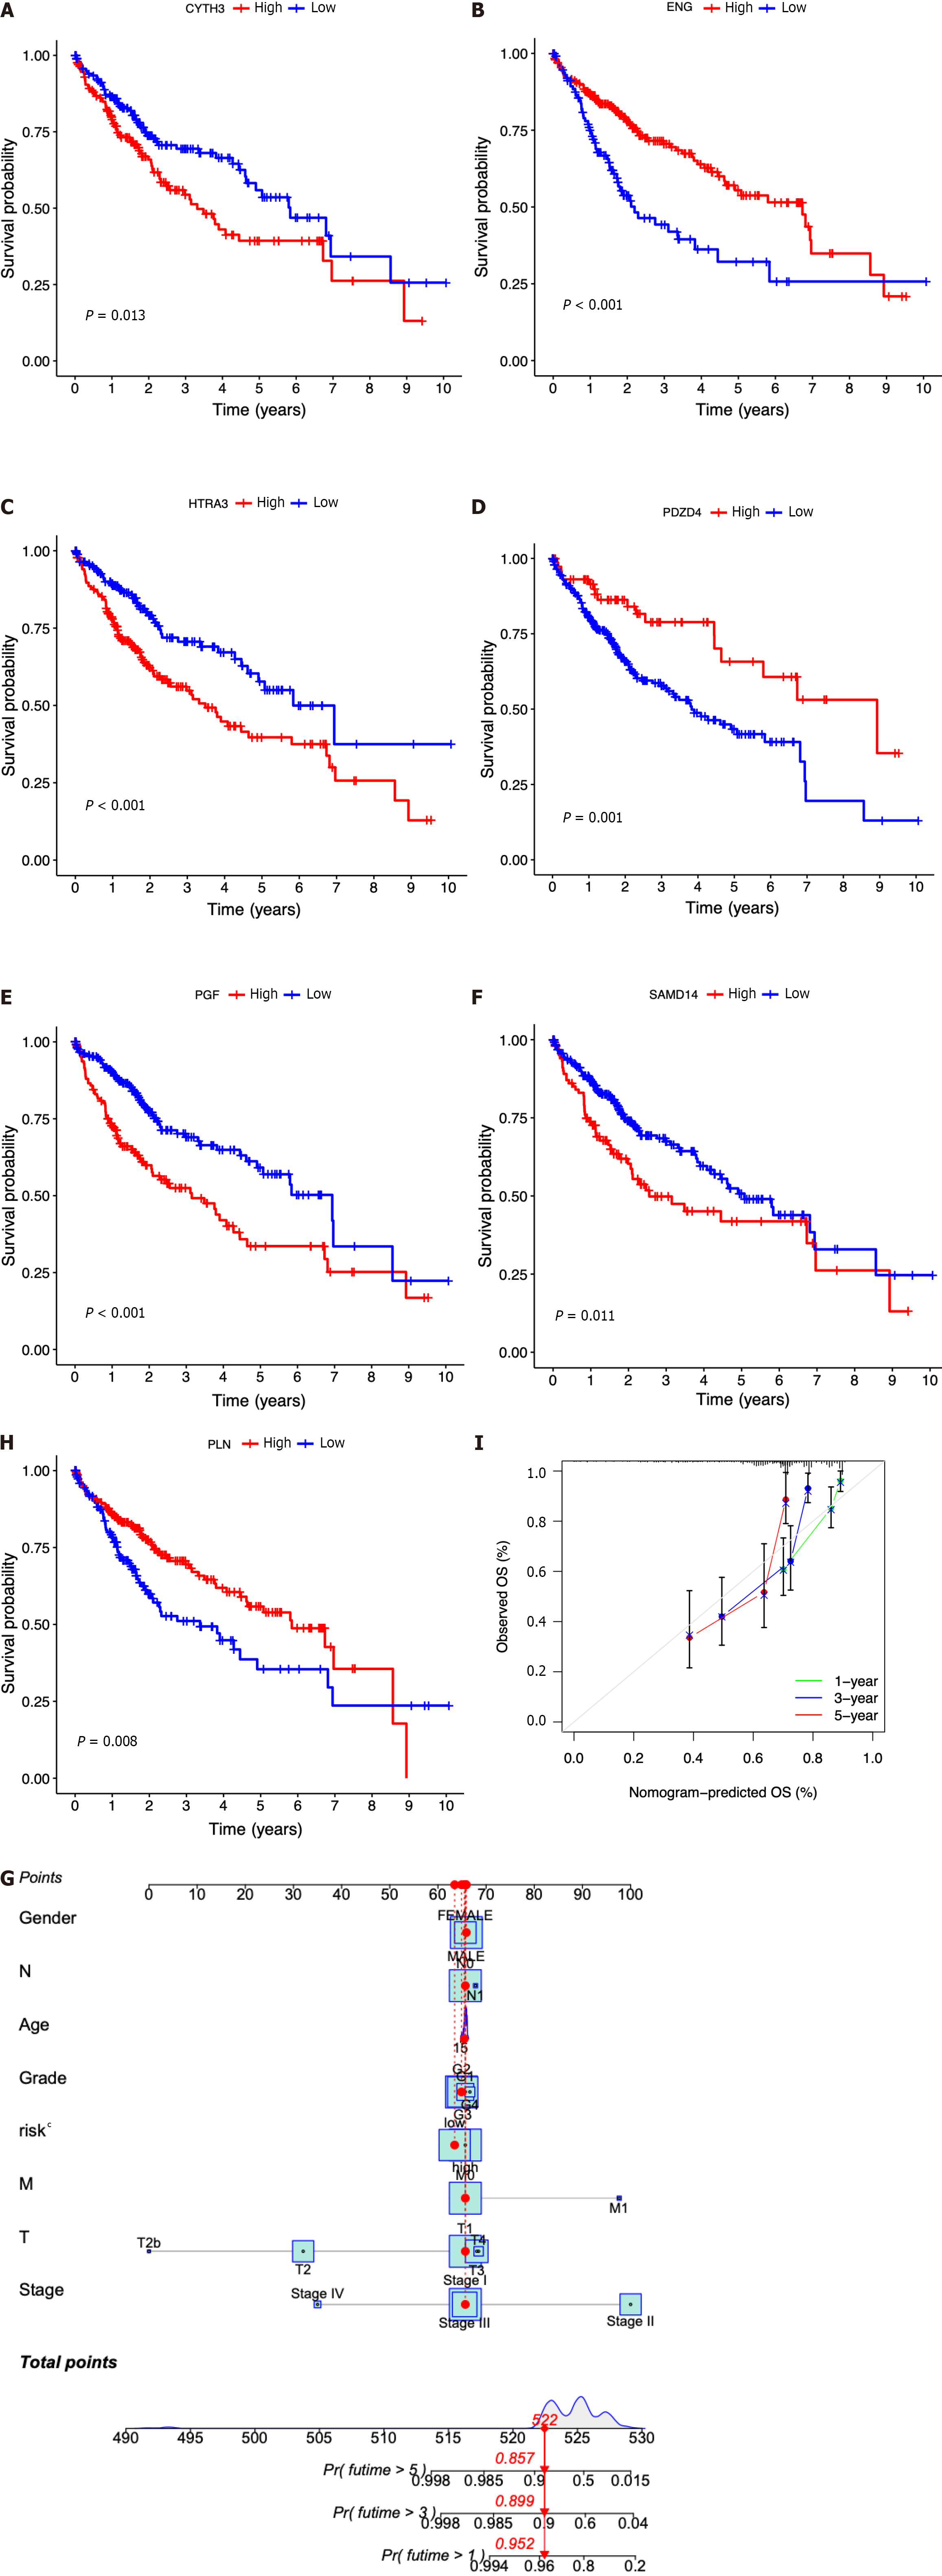
Then, the patients diagnosed with HCC were categorized into separate subgroups based on the seven ICRGs to conduct a more comprehensive investigation into the prognostic significance of individual genes within the signature. We found that the survival probabilities associated with CYTH3, HTRA3, PGF, and SAMD14 were significantly lower in the high-risk group compared to the low-risk group, while ENG, PDZD4, and PLN showed the opposite trend (Figure 5A-G).
In addition, according to the fundamental prognostic variables from the multivariate Cox regression analysis, we developed a nomogram to accurately forecast the OS rates for HCC patients over a span of 1 year, 3 years, and 5 years. Initially, patients have the opportunity to accrue points by summing the values of all variables within the nomogram. Subsequently, the cumulative points for each patient can be computed to derive the 1-, 3-, and 5-year OS rates, employing a vertical line extending from the prognostic factor axis to the points axis (Figure 5H). Figure 5I exhibits a notable level of accuracy of the nomogram in predicting the OS of HCC patients at the time of 1 year, 3 years, and 5 years.
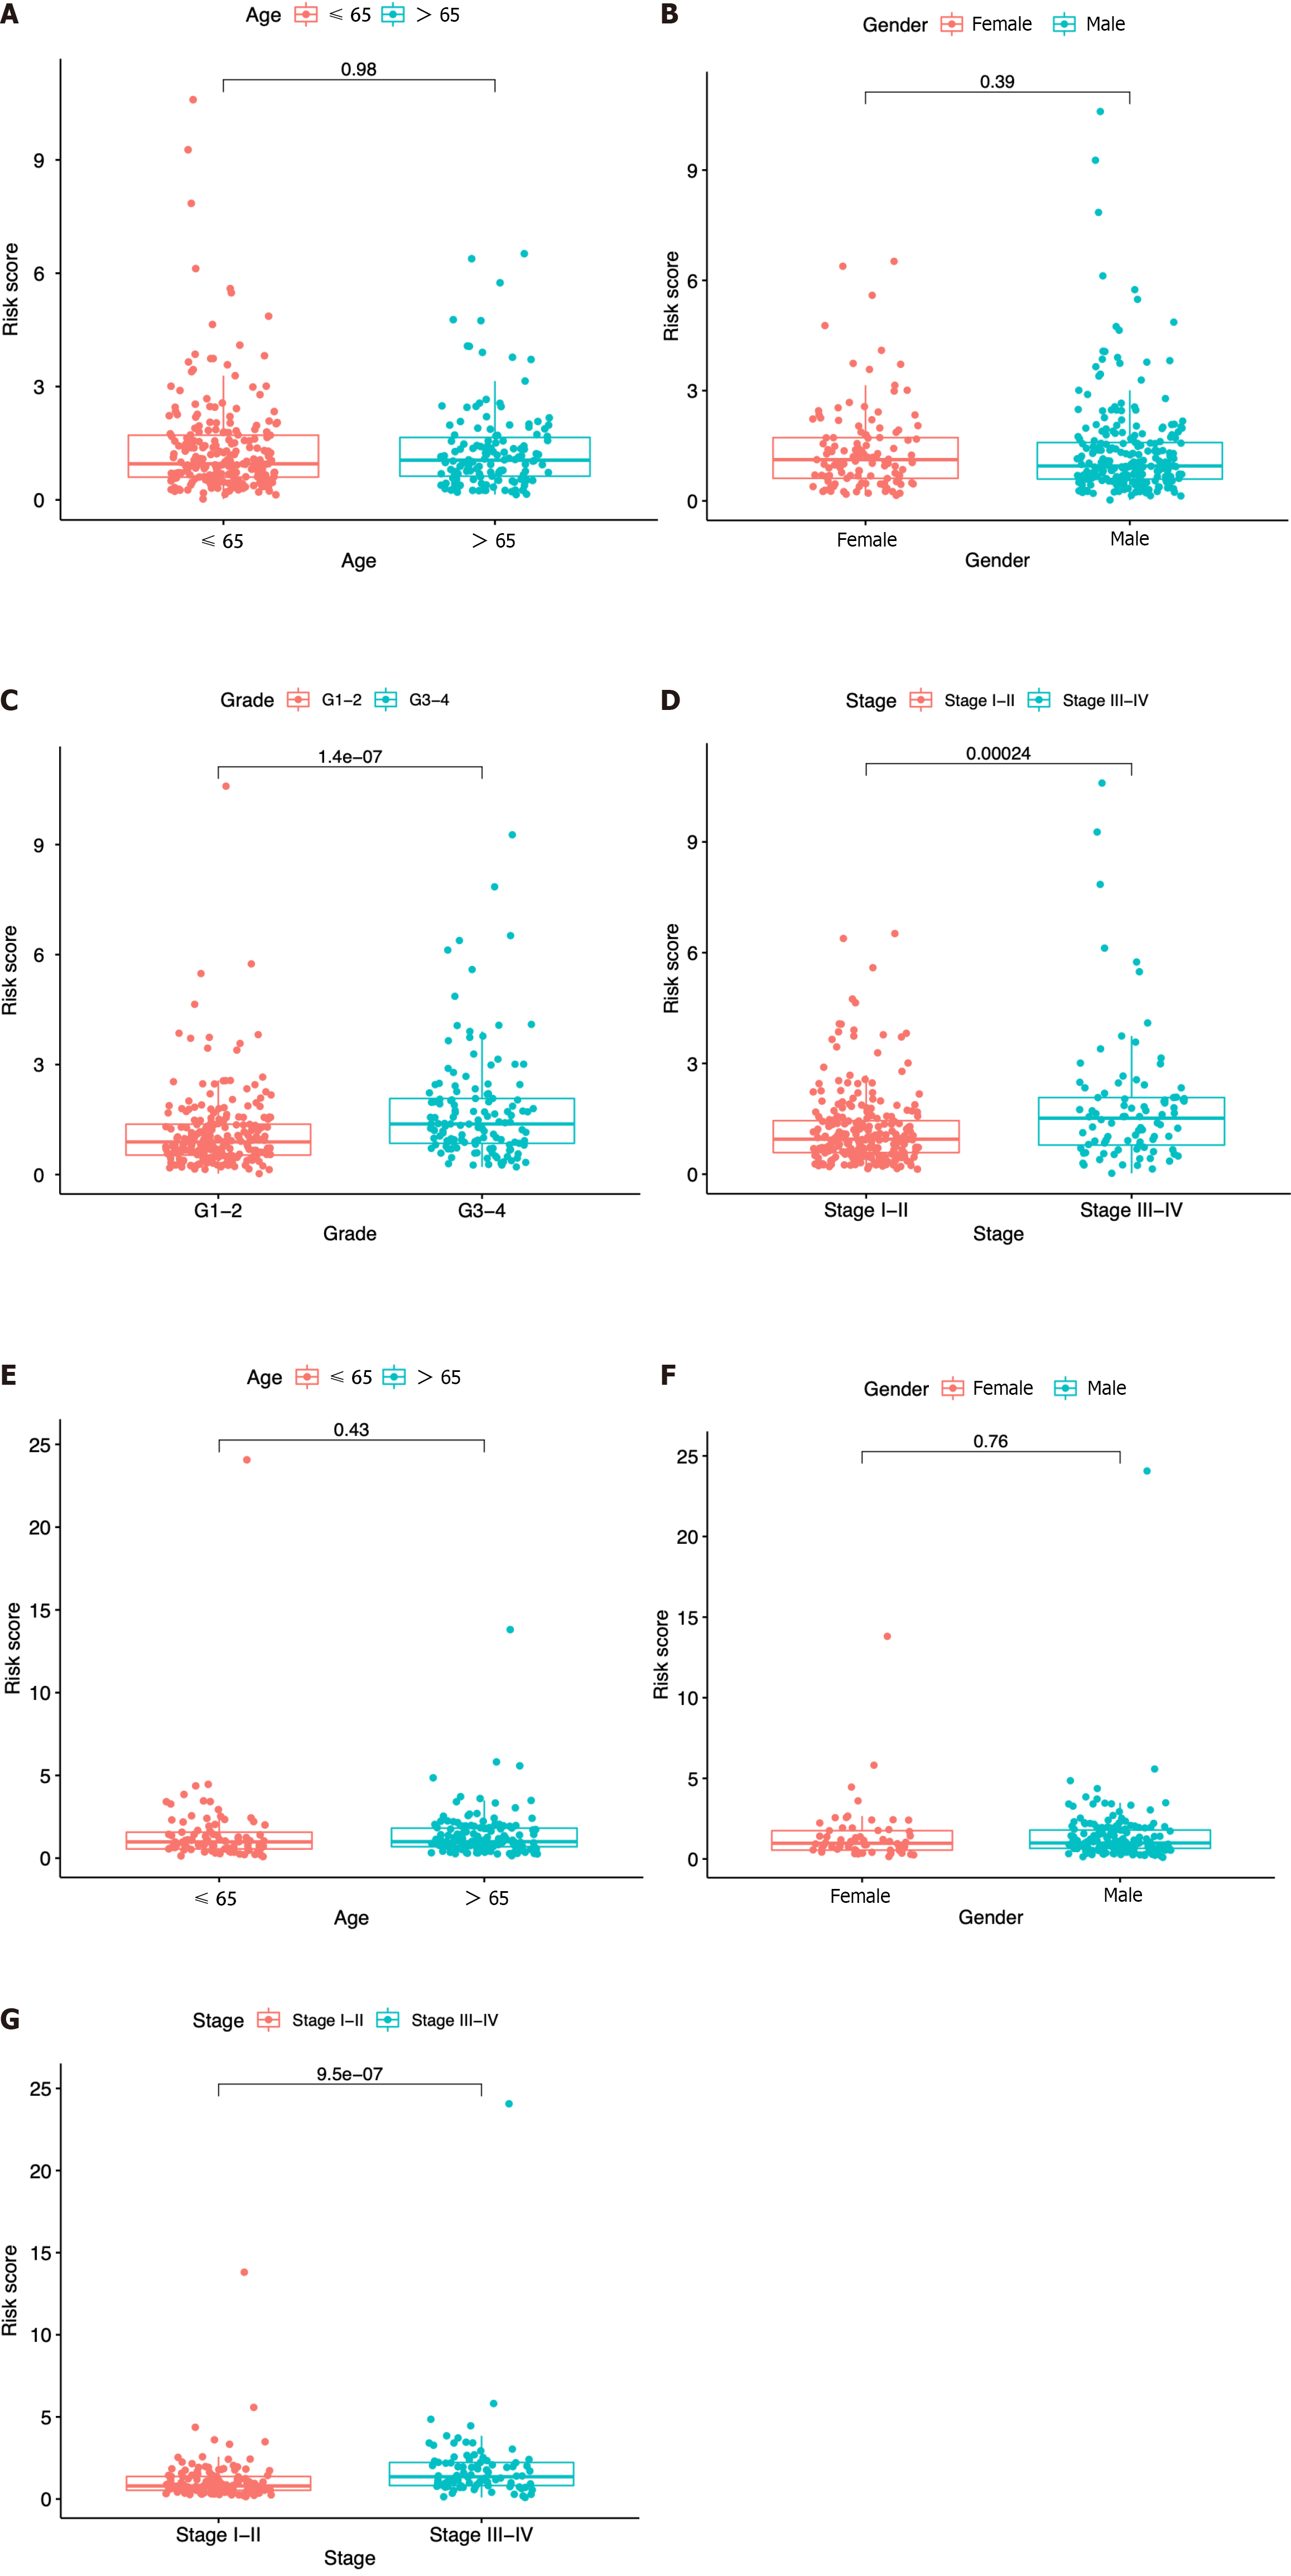
In each dataset, we evaluated the clinical implications of clinical factors such as age, sex, tumor grade, and tumor stage as explanatory variables in the seven-ICRG prognostic model. We noticed that patients with high tumor grade and stage III−IV were more likely to have a higher risk score in TCGA, and a similar trend occurred in stage III−IV in ICGC datasets (Figure 6C, D, and G). However, no significant differences were observed in age or sex (Figure 6A, B, E, and F).
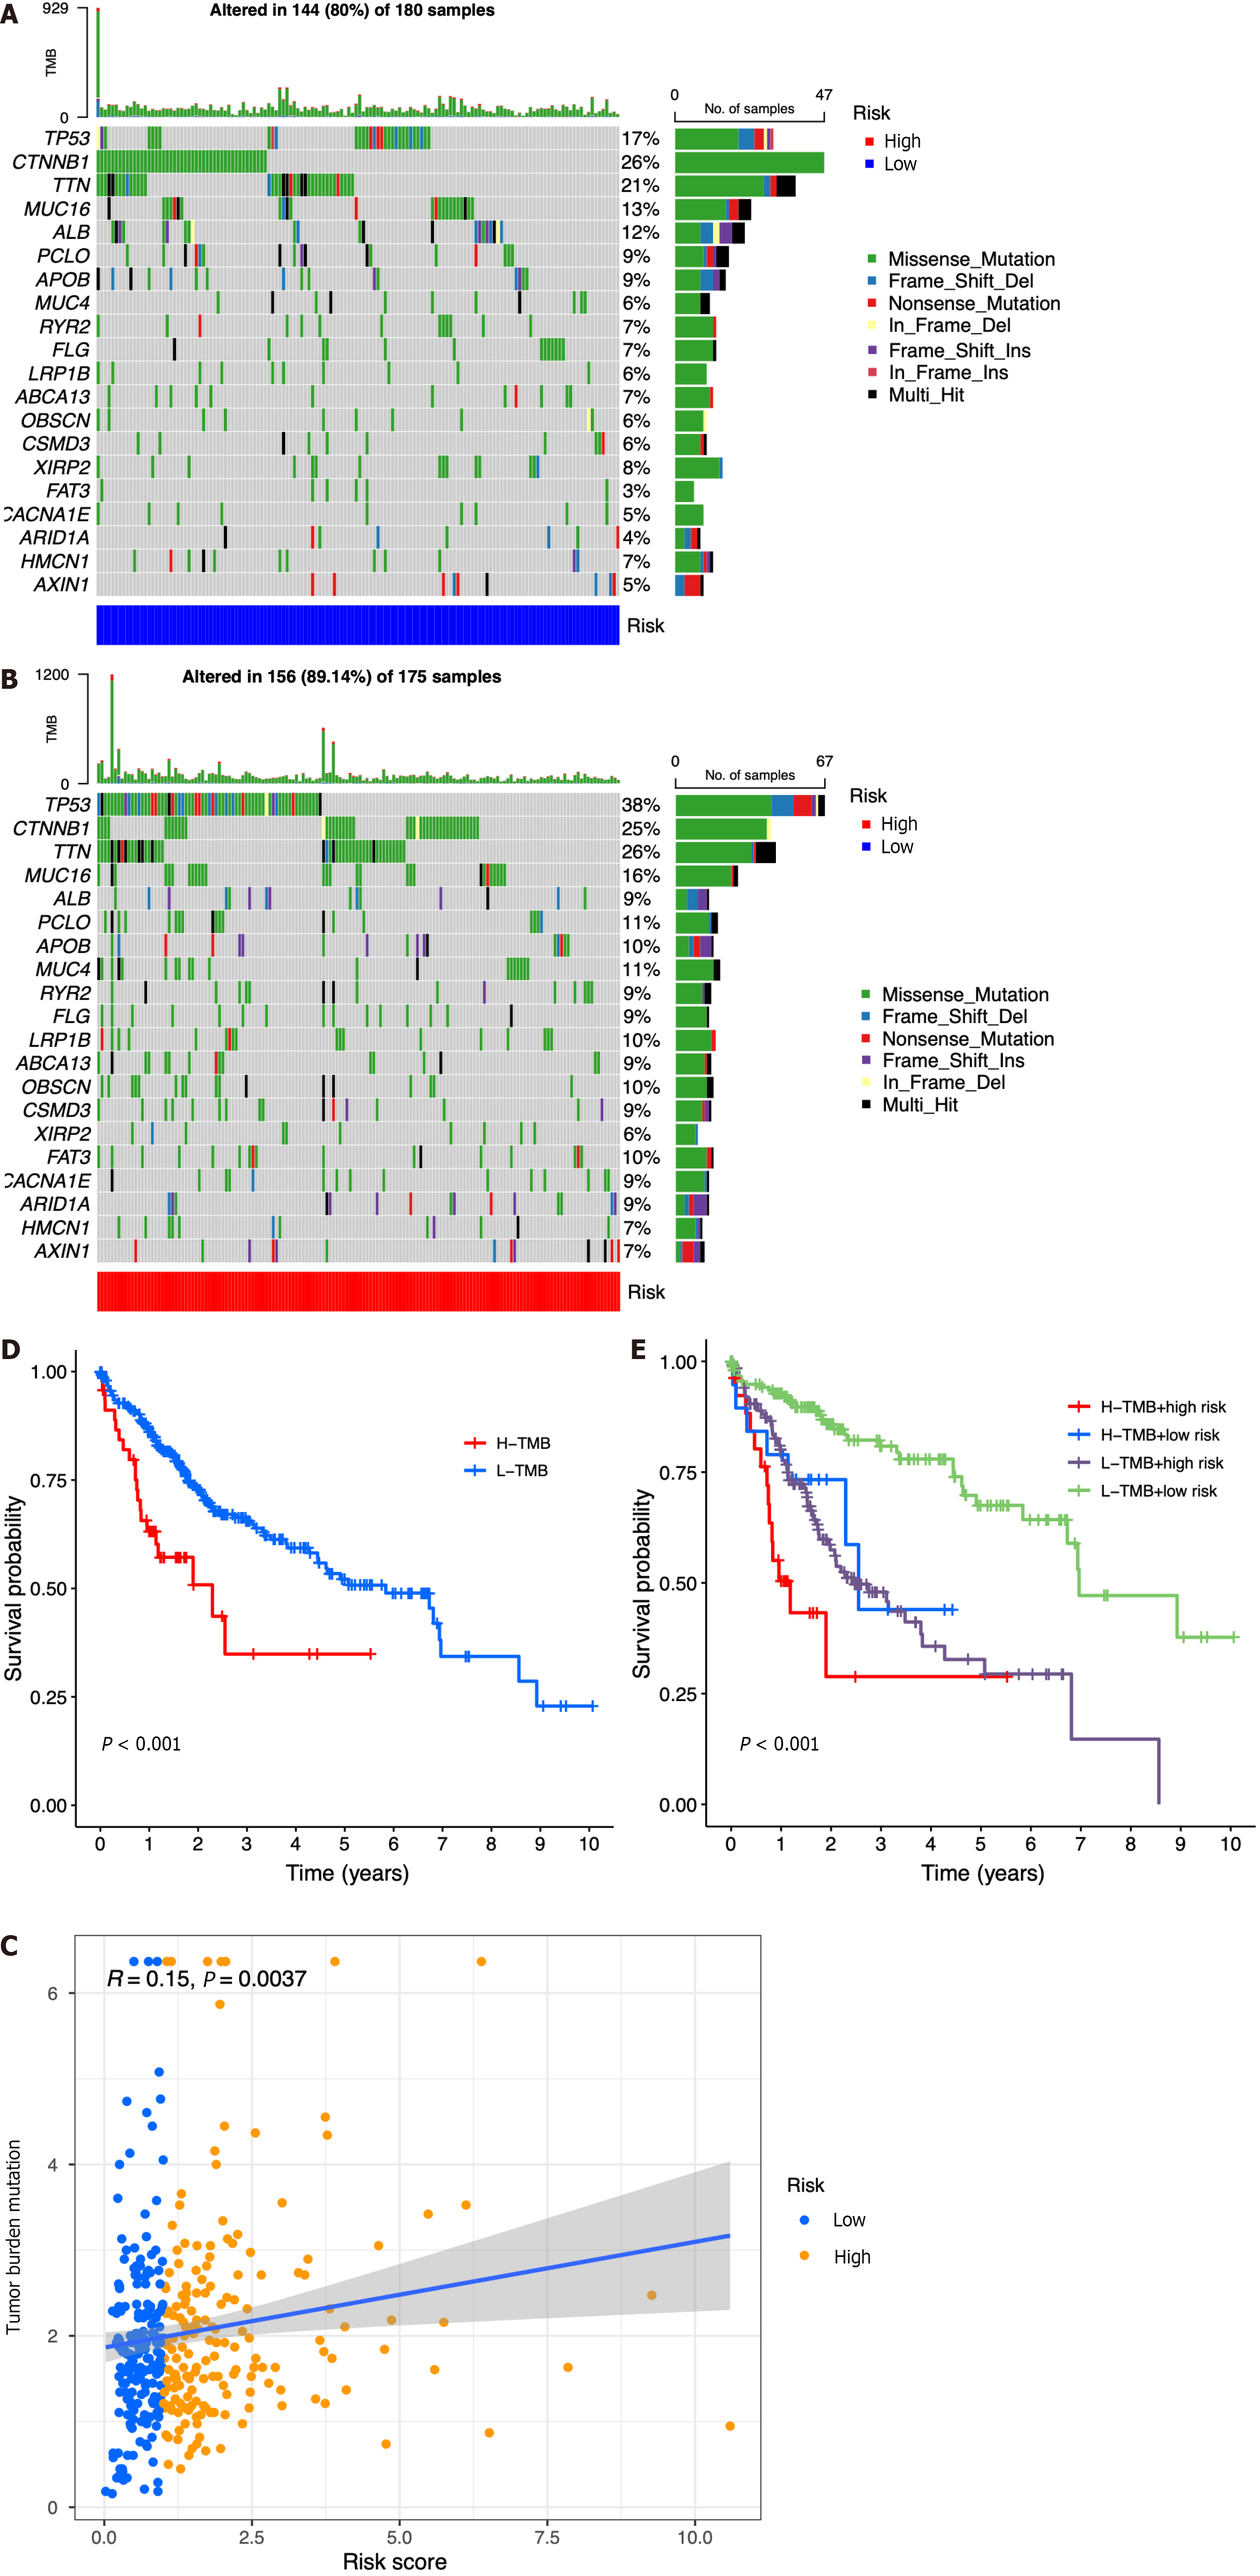
According to the results of somatic mutation analysis, in the low-risk group, mutations in CTNNB1 (26%), TTN (21%), TP53 (17%), and MUC16 (13%) were highly enriched. Concurrently, the high-risk group exhibited a significant enrichment of mutations in TP53 (38%), TTN (26%), CTNNB1 (25%), and MUC16 (16%). Missense mutation was the main type of genetic variation (Figure 7A and B). As the risk score increased, we also observed increased tumor mutation burden (TMB) in tumor samples (Figure 7C). The data presented in Figure 7D indicated that patients belonging to the low-TMB group exhibited a significantly elevated probability of survival, while patients in the high-TMB group displayed a notably diminished probability of survival (P < 0.001). When combining risk and TMB classification, the lowest survival probability occurred in patients in the high-risk + high-TMB group, while the highest survival probability occurred in the low-risk + low-TMB group (P < 0.001, Figure 7E).
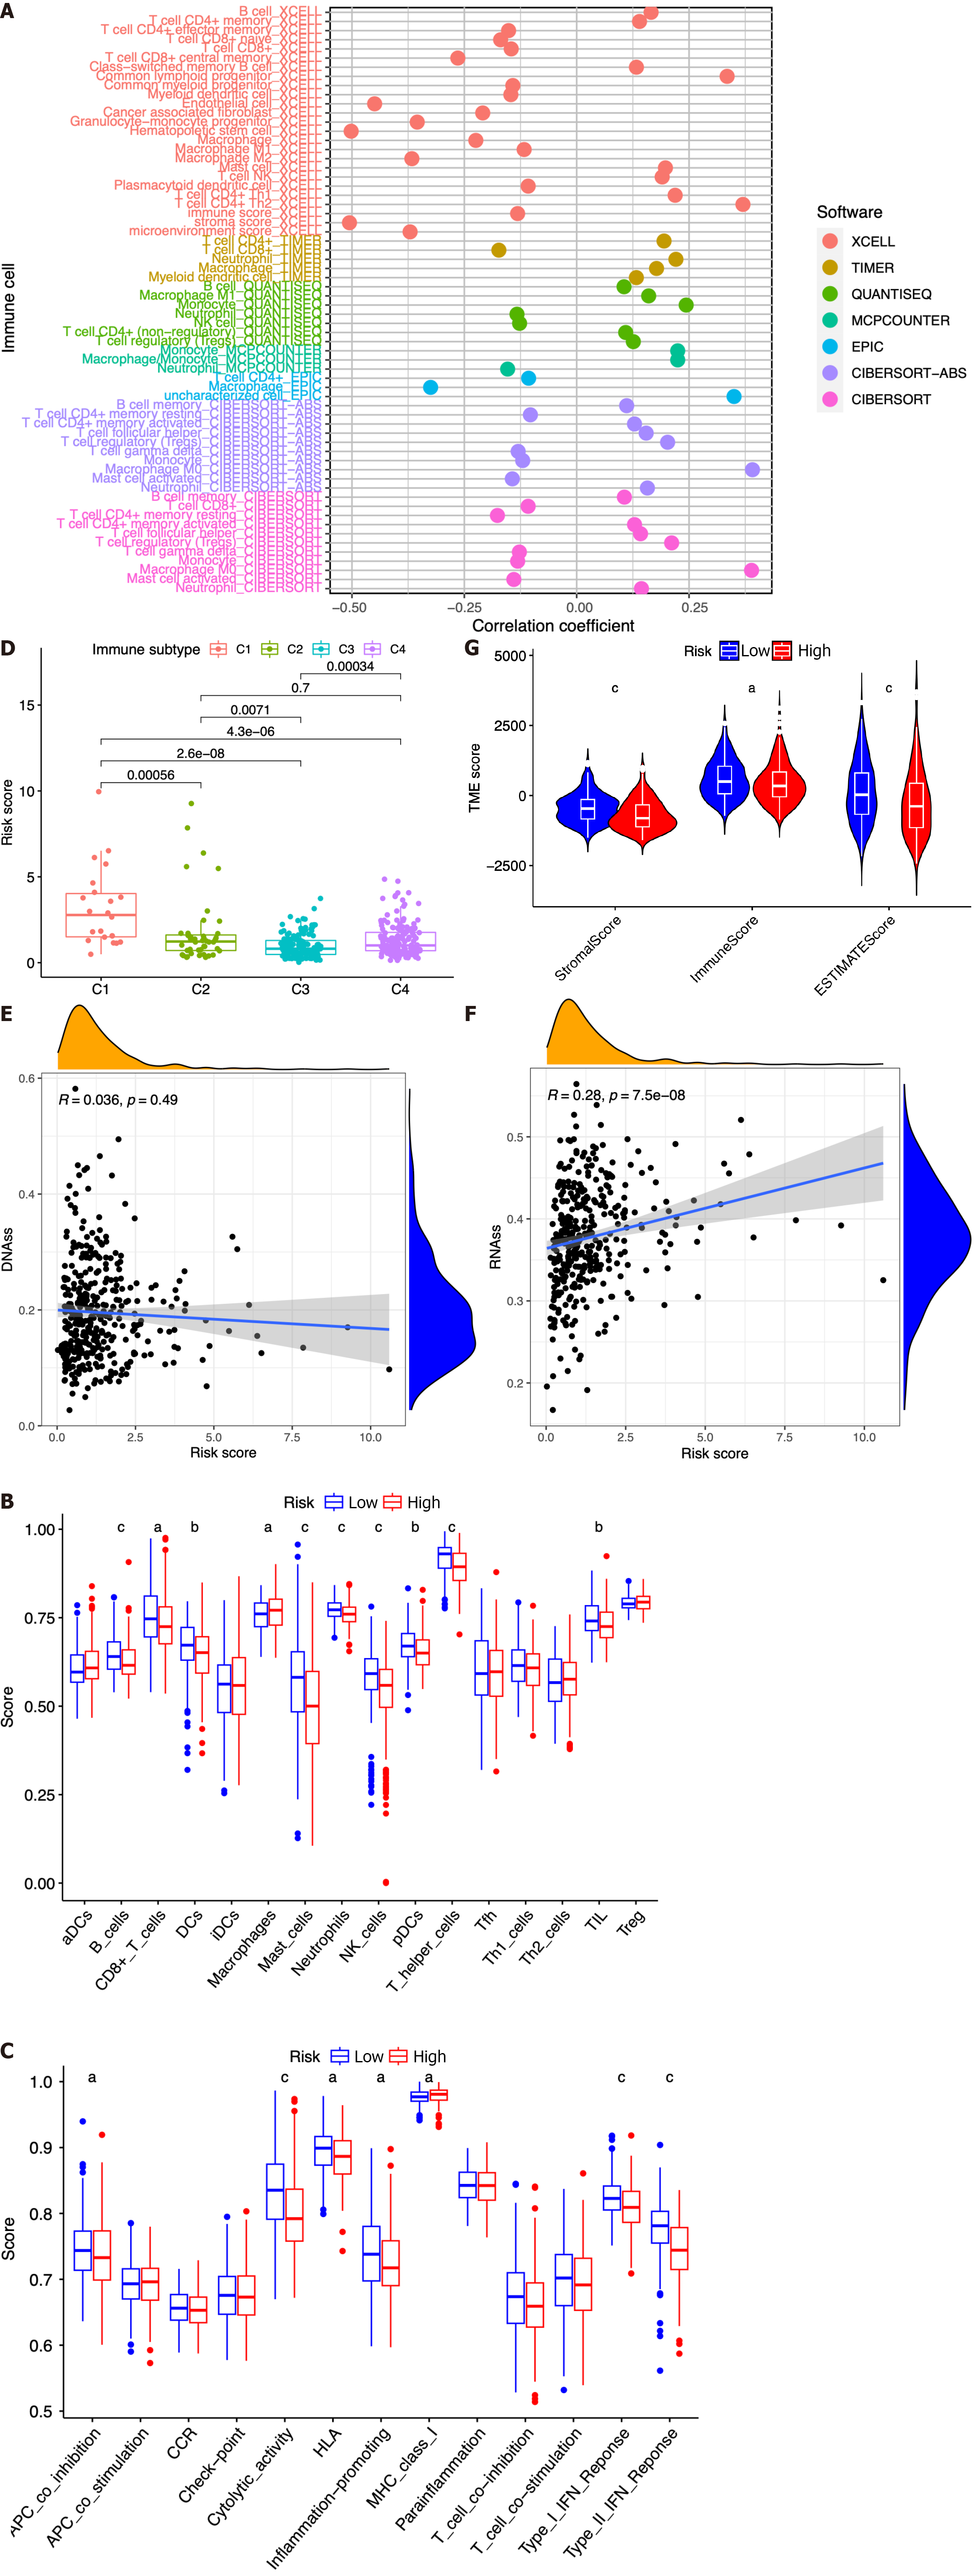
In this study, we investigated the potential correlation between different immune cell types and the risk scores of patients in the TCGA dataset. Based on the outcomes of the analyses conducted using seven software applications (XCELL, TIMER, QUANTISEQ, MCPCOUNTER, EPIC, CIBERSORT-ABS, and CIBERSORT), our observations were that CD8+ T cells, mast cells, etc. were related with the decrease in patient risk, while CD4+ T cells, B cells, M0 macrophages, and regulatory T cells (Tregs) were associated with the increase in patient risk scores (Figure 8A). Subsequently, we performed ssGSEA to assess and compare the ssGSEA scores across distinct risk groups, thereby elucidating the disparities in immune infiltration between the high- and low-risk cohorts. It was observed that macrophages exhibited a more pronounced association with the high-risk group, whereas B cells, CD8+ T cells, dendritic cells, mast cells, neutrophils, natural killer cells, plasmacytoid dendritic cells, T helper cells, and tumor infiltrating lymphocytes were found to be linked with the low-risk group (Figure 8B, P < 0.05). Then, we conducted a comparative analysis of the immune functions in the two groups in order to investigate the potential involvement of immune pathways in their differentiation. Our research revealed that the high-risk group exhibited greater activity of major histocompatibility complex class I, while antigen presenting cell coinhibition, cytolytic activity, human leukocyte antigen, inflammation promotion, and type I and type II IFN responses in the low-risk group exhibited higher levels of activity (Figure 8C, P < 0.05).
Next, we introduced four distinct immune infiltration types, namely, wound healing (C1), interferon gamma (IFN-γ) dominant (C2), inflammatory (C3), and lymphocyte depleted (C4), in order to ascertain their association with the signature. The findings revealed a strong correlation between C1 and high-risk patients, whereas C2, C3, and C4 were more likely to manifest in individuals with low-risk scores (Figure 8D).
Then, the RNA stemness score (RNAs) and DNA methylation pattern (DNAss) were used to evaluate tumor stemness. As presented in Figure 8E-F, no significant correlation was observed between the DNAss and risk score, while a more positive association was identified between the RNAss and risk score (r = 0.24, P < 0.05). In addition, the risk score was significantly associated with the stromal score, immune score, and estimate score of patients with HCC in the low-risk group, implying a more essential role of the TME in the low-risk group than in the high-risk group (Figure 8G).
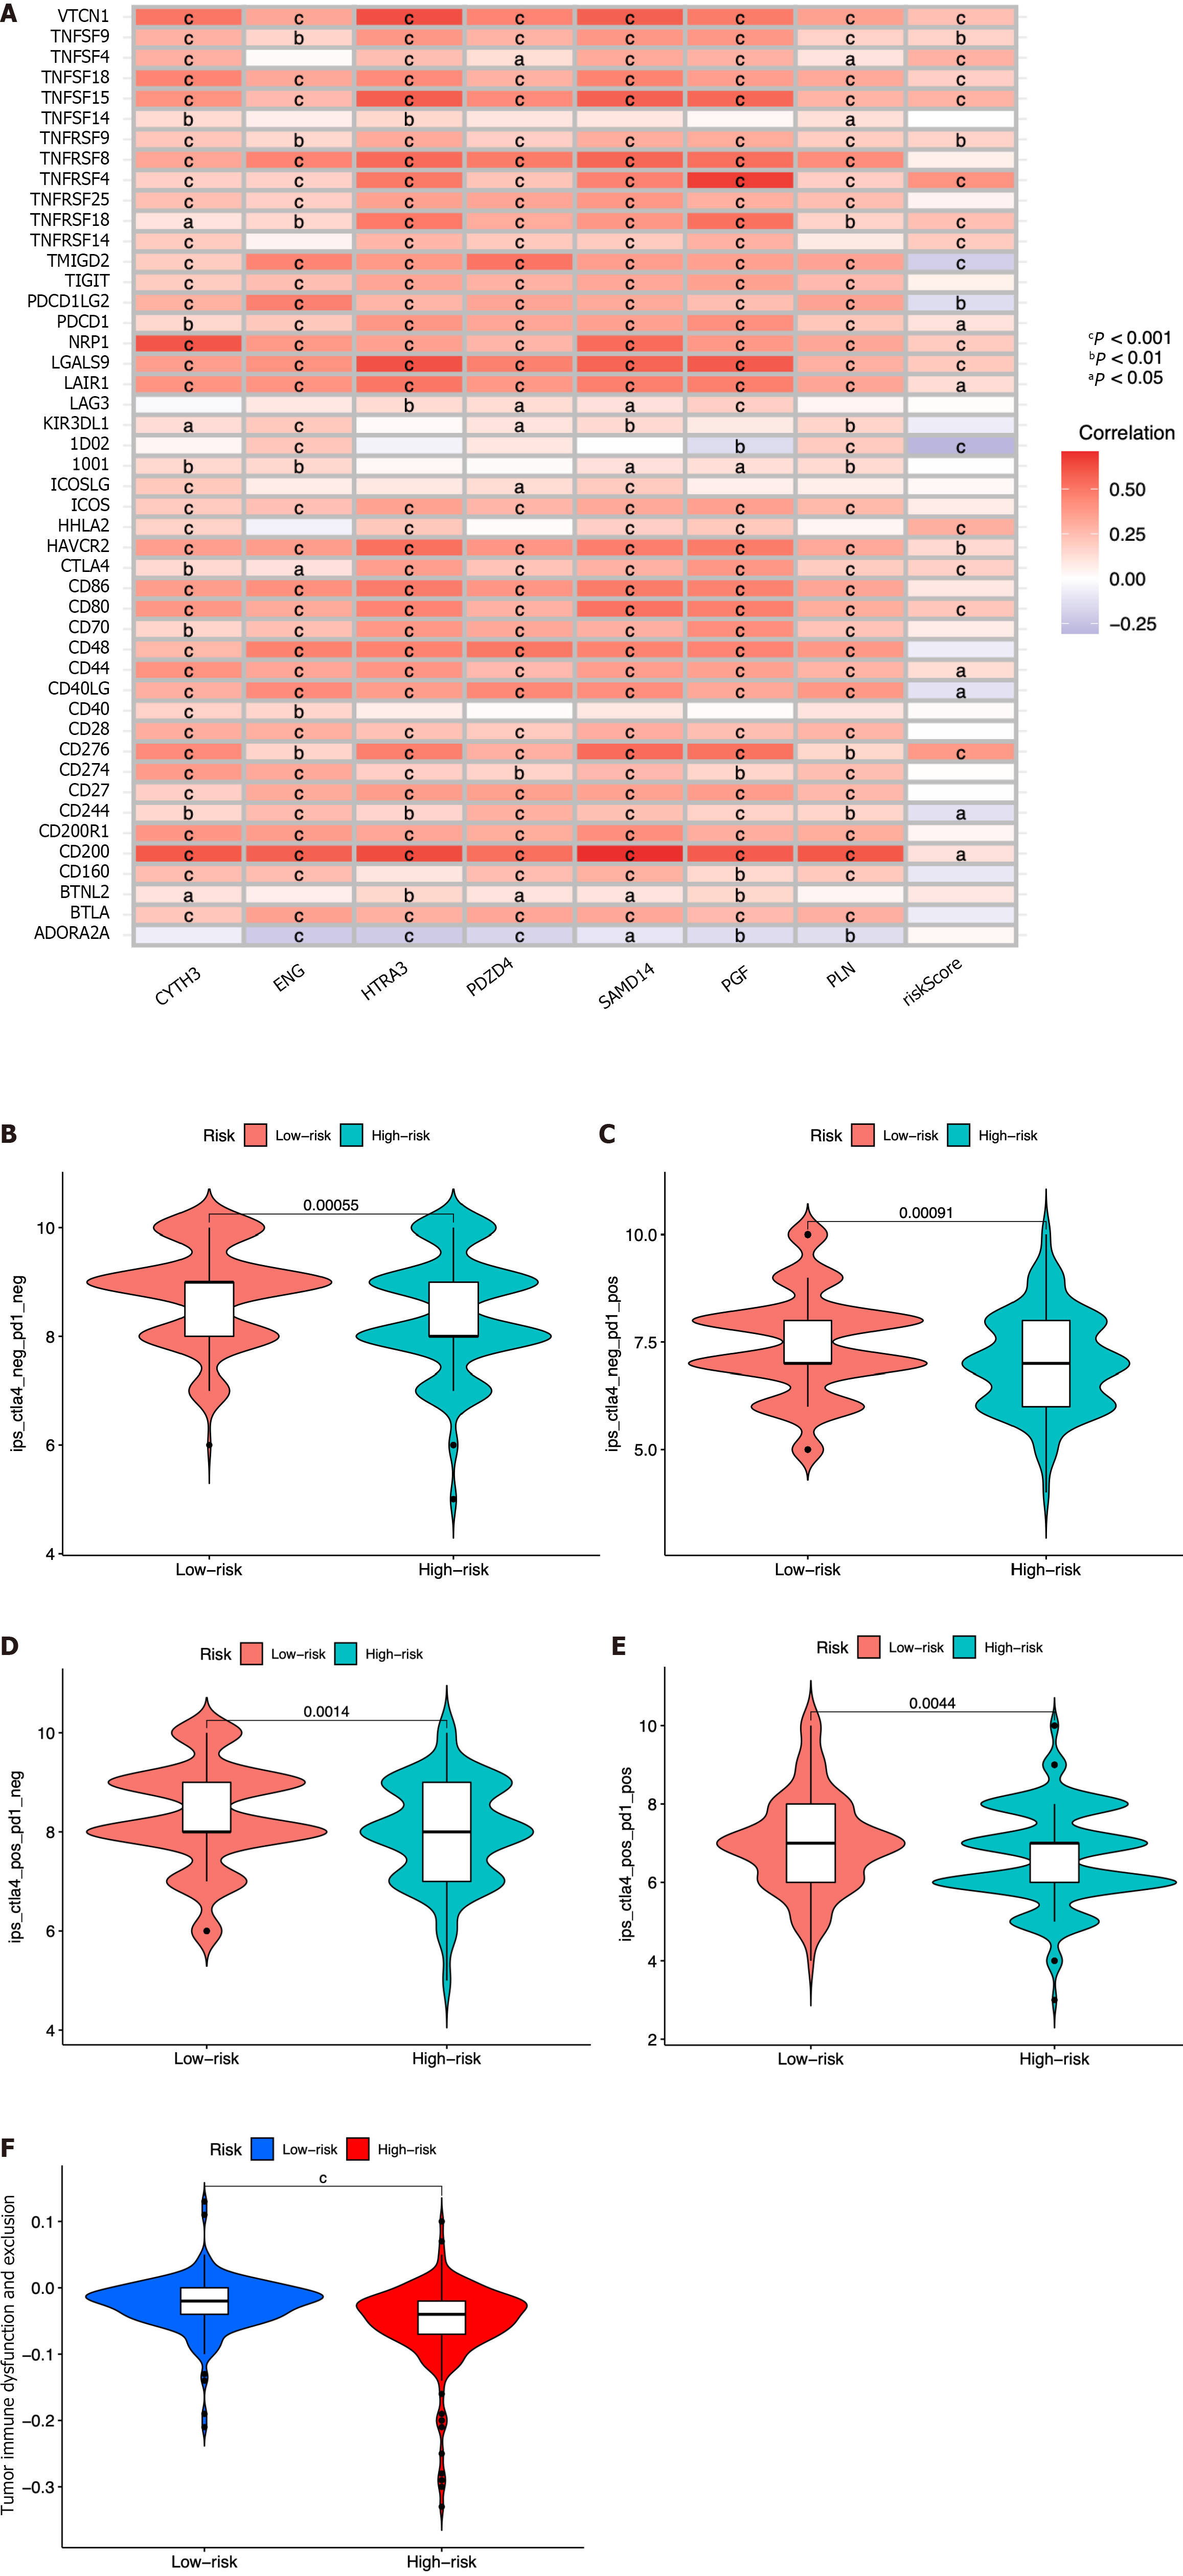
The expression association between 47 immune checkpoints and the risk score or the seven ICRGs was also studied. The results showed that the levels of most immune checkpoints, such as VTCN1, TNFSF9, TNFSF4, TNFSF18, TNFSF15, TNFRSF9, TNFRSF4, and TNFRSF18, were positively related to the risk score. However, TMIGD2, PDCD1LG2, and IDO2 were negatively correlated with the risk score (Figure 9A). IPS analysis was also conducted for the prediction of patient responsiveness to CTLA-4 and PD-1. The results showed that the IPS, IPS-CTLA4, IPS-PD1, and IPS-PD1-CTLA4 scores were higher in the low-risk group (P < 0.05, Figure 9B-E).
In order to conduct a comprehensive assessment of the efficacy the risk score as a prognostic indicator for patients undergoing ICB therapy, a TIDE analysis was conducted on HCC patients from the TCGA dataset. It was observed that patients classified within the high-risk group exhibited lower TIDE scores, indicating a potential heightened responsiveness to ICB therapy in comparison to the low-risk group (Figure 9F).
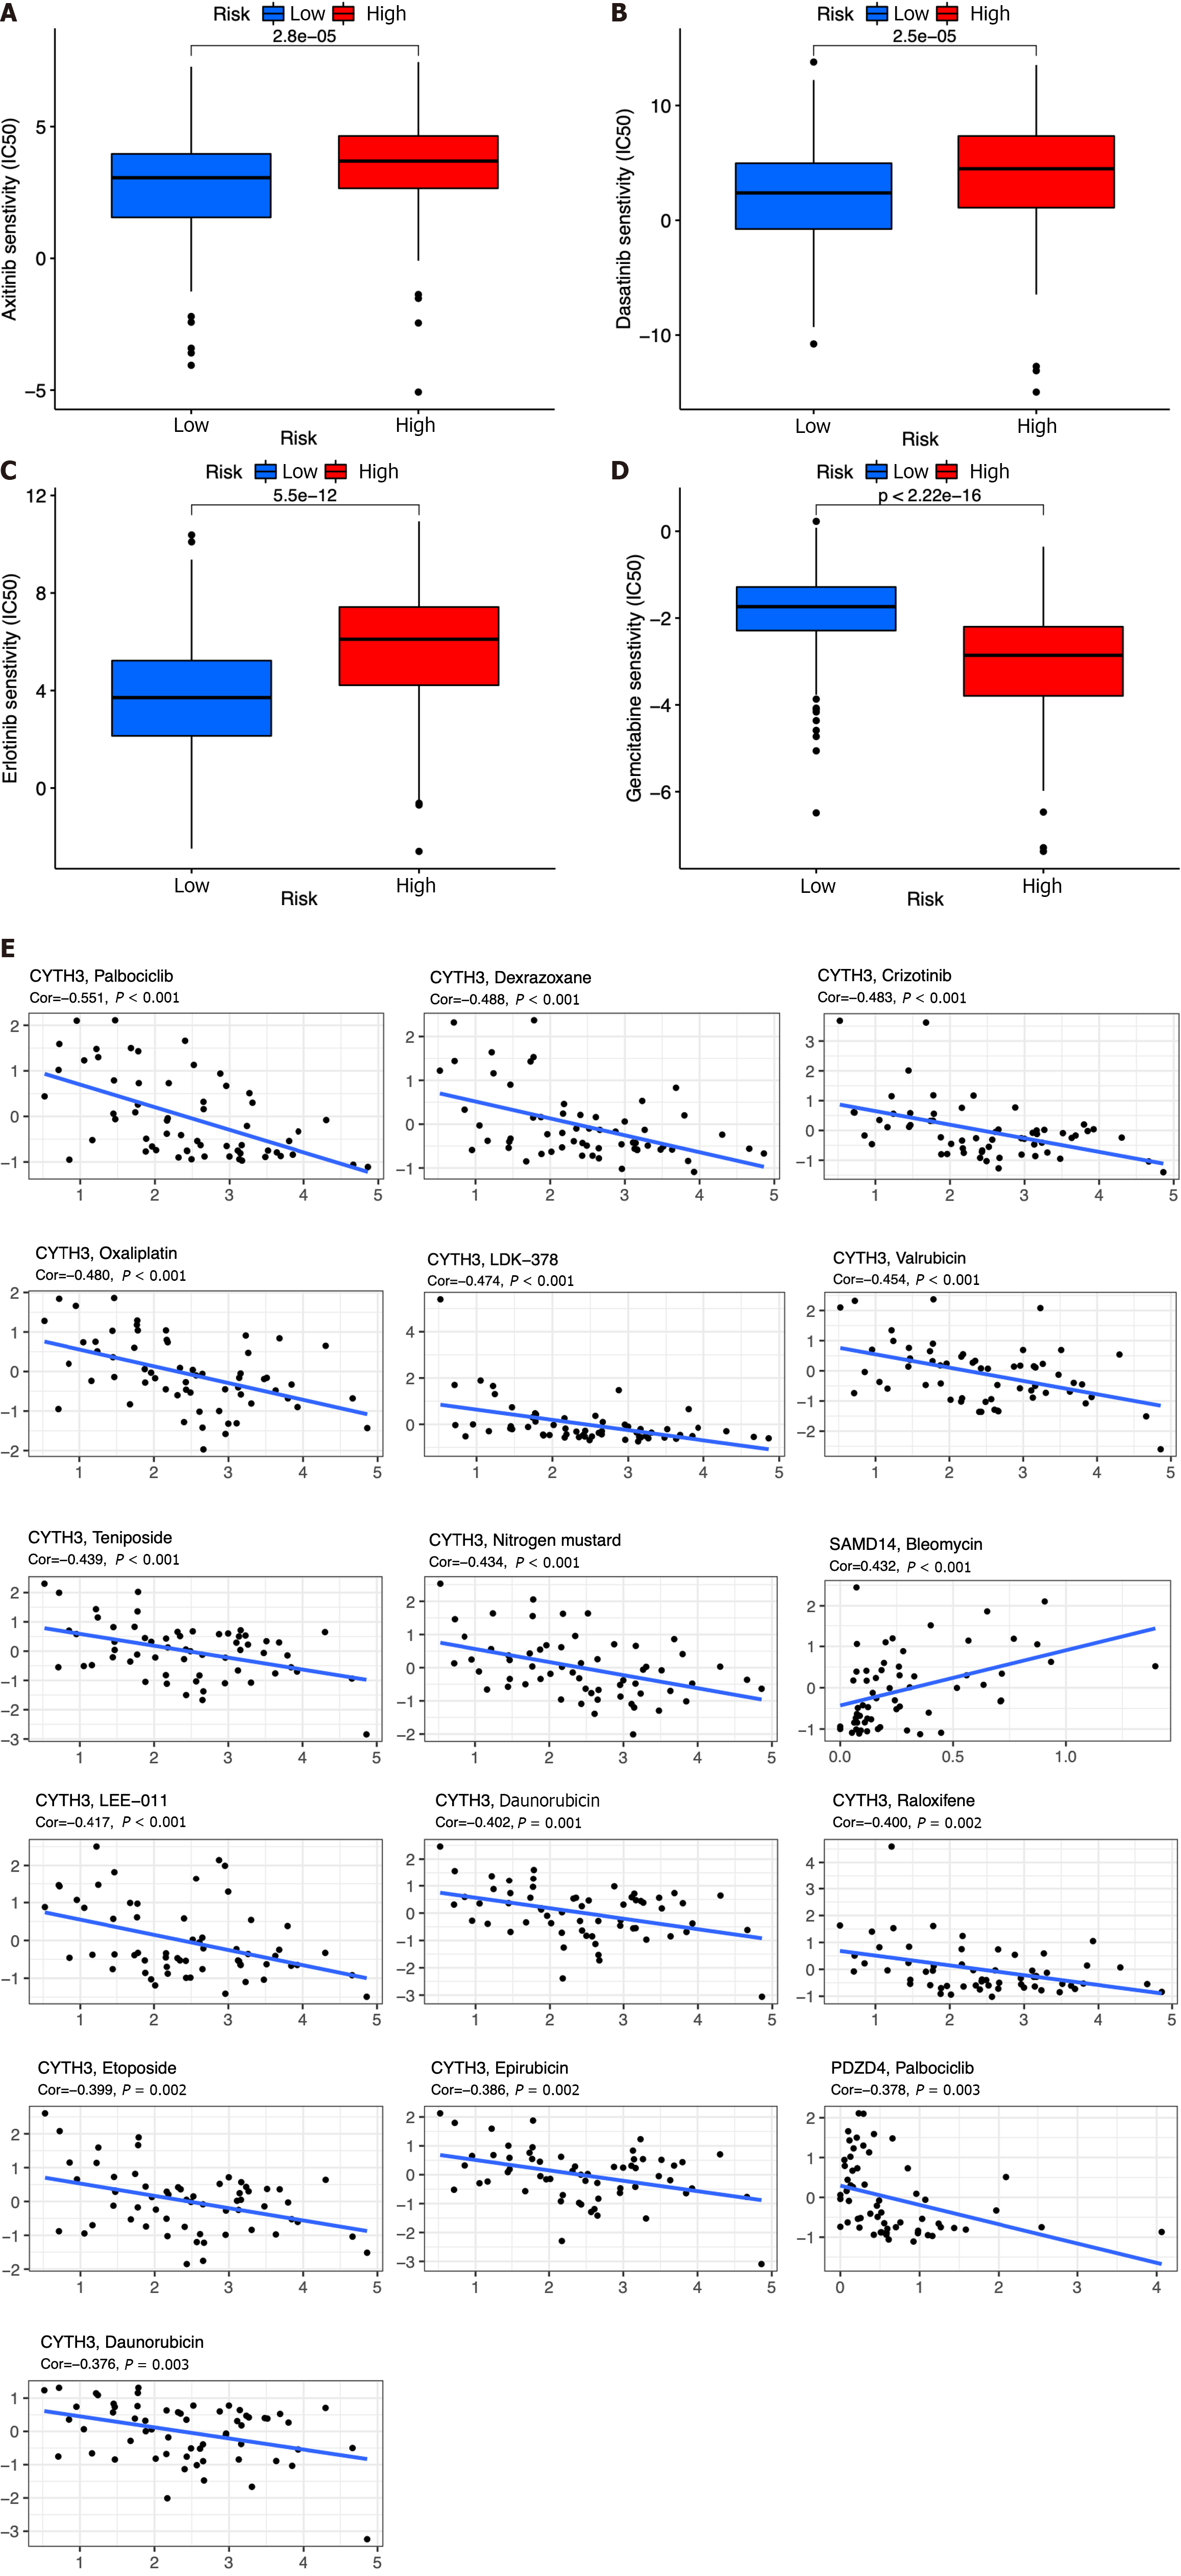
By using the R package “pRRophetic”, the IC50 analysis of four relatively frequently used chemotherapeutic drugs for HCC was conducted in the two groups. Axitinib, dasatinib, and erlotinib were observed to have significant differences in estimated IC50 between the two groups. In addition, we noticed that patients in the high-risk group had higher IC50 values, implying that patients in the low-risk group were more sensitive to these three drugs (Figure 10A-C). Meanwhile, the IC50 value of gemcitabine was found to be higher in the low-risk group compared to the high-risk group, indicating a greater likelihood of gemcitabine sensitivity among patients in the high-risk group (Figure 10D).
We also explored the top 16 correlation analyses between prognostic genes and drug sensitivity according to NCI-60. Figure 10E demonstrates that patients with SAMD14 expression were sensitive to bleomycin. However, patients with CYTH3 expression were insensitive to palbociclib, dexrazoxane, crizotinib, oxaliplatin, LDK−37, valrubicin, teniposide, nitrogen mustard, LEE−011, DAUNORUBICIN, raloxifene, etoposide, epirubicin, and daunorubicin. In addition, patients with expression of PDZD4 were insensitive to palbociclib (Figure 10E).
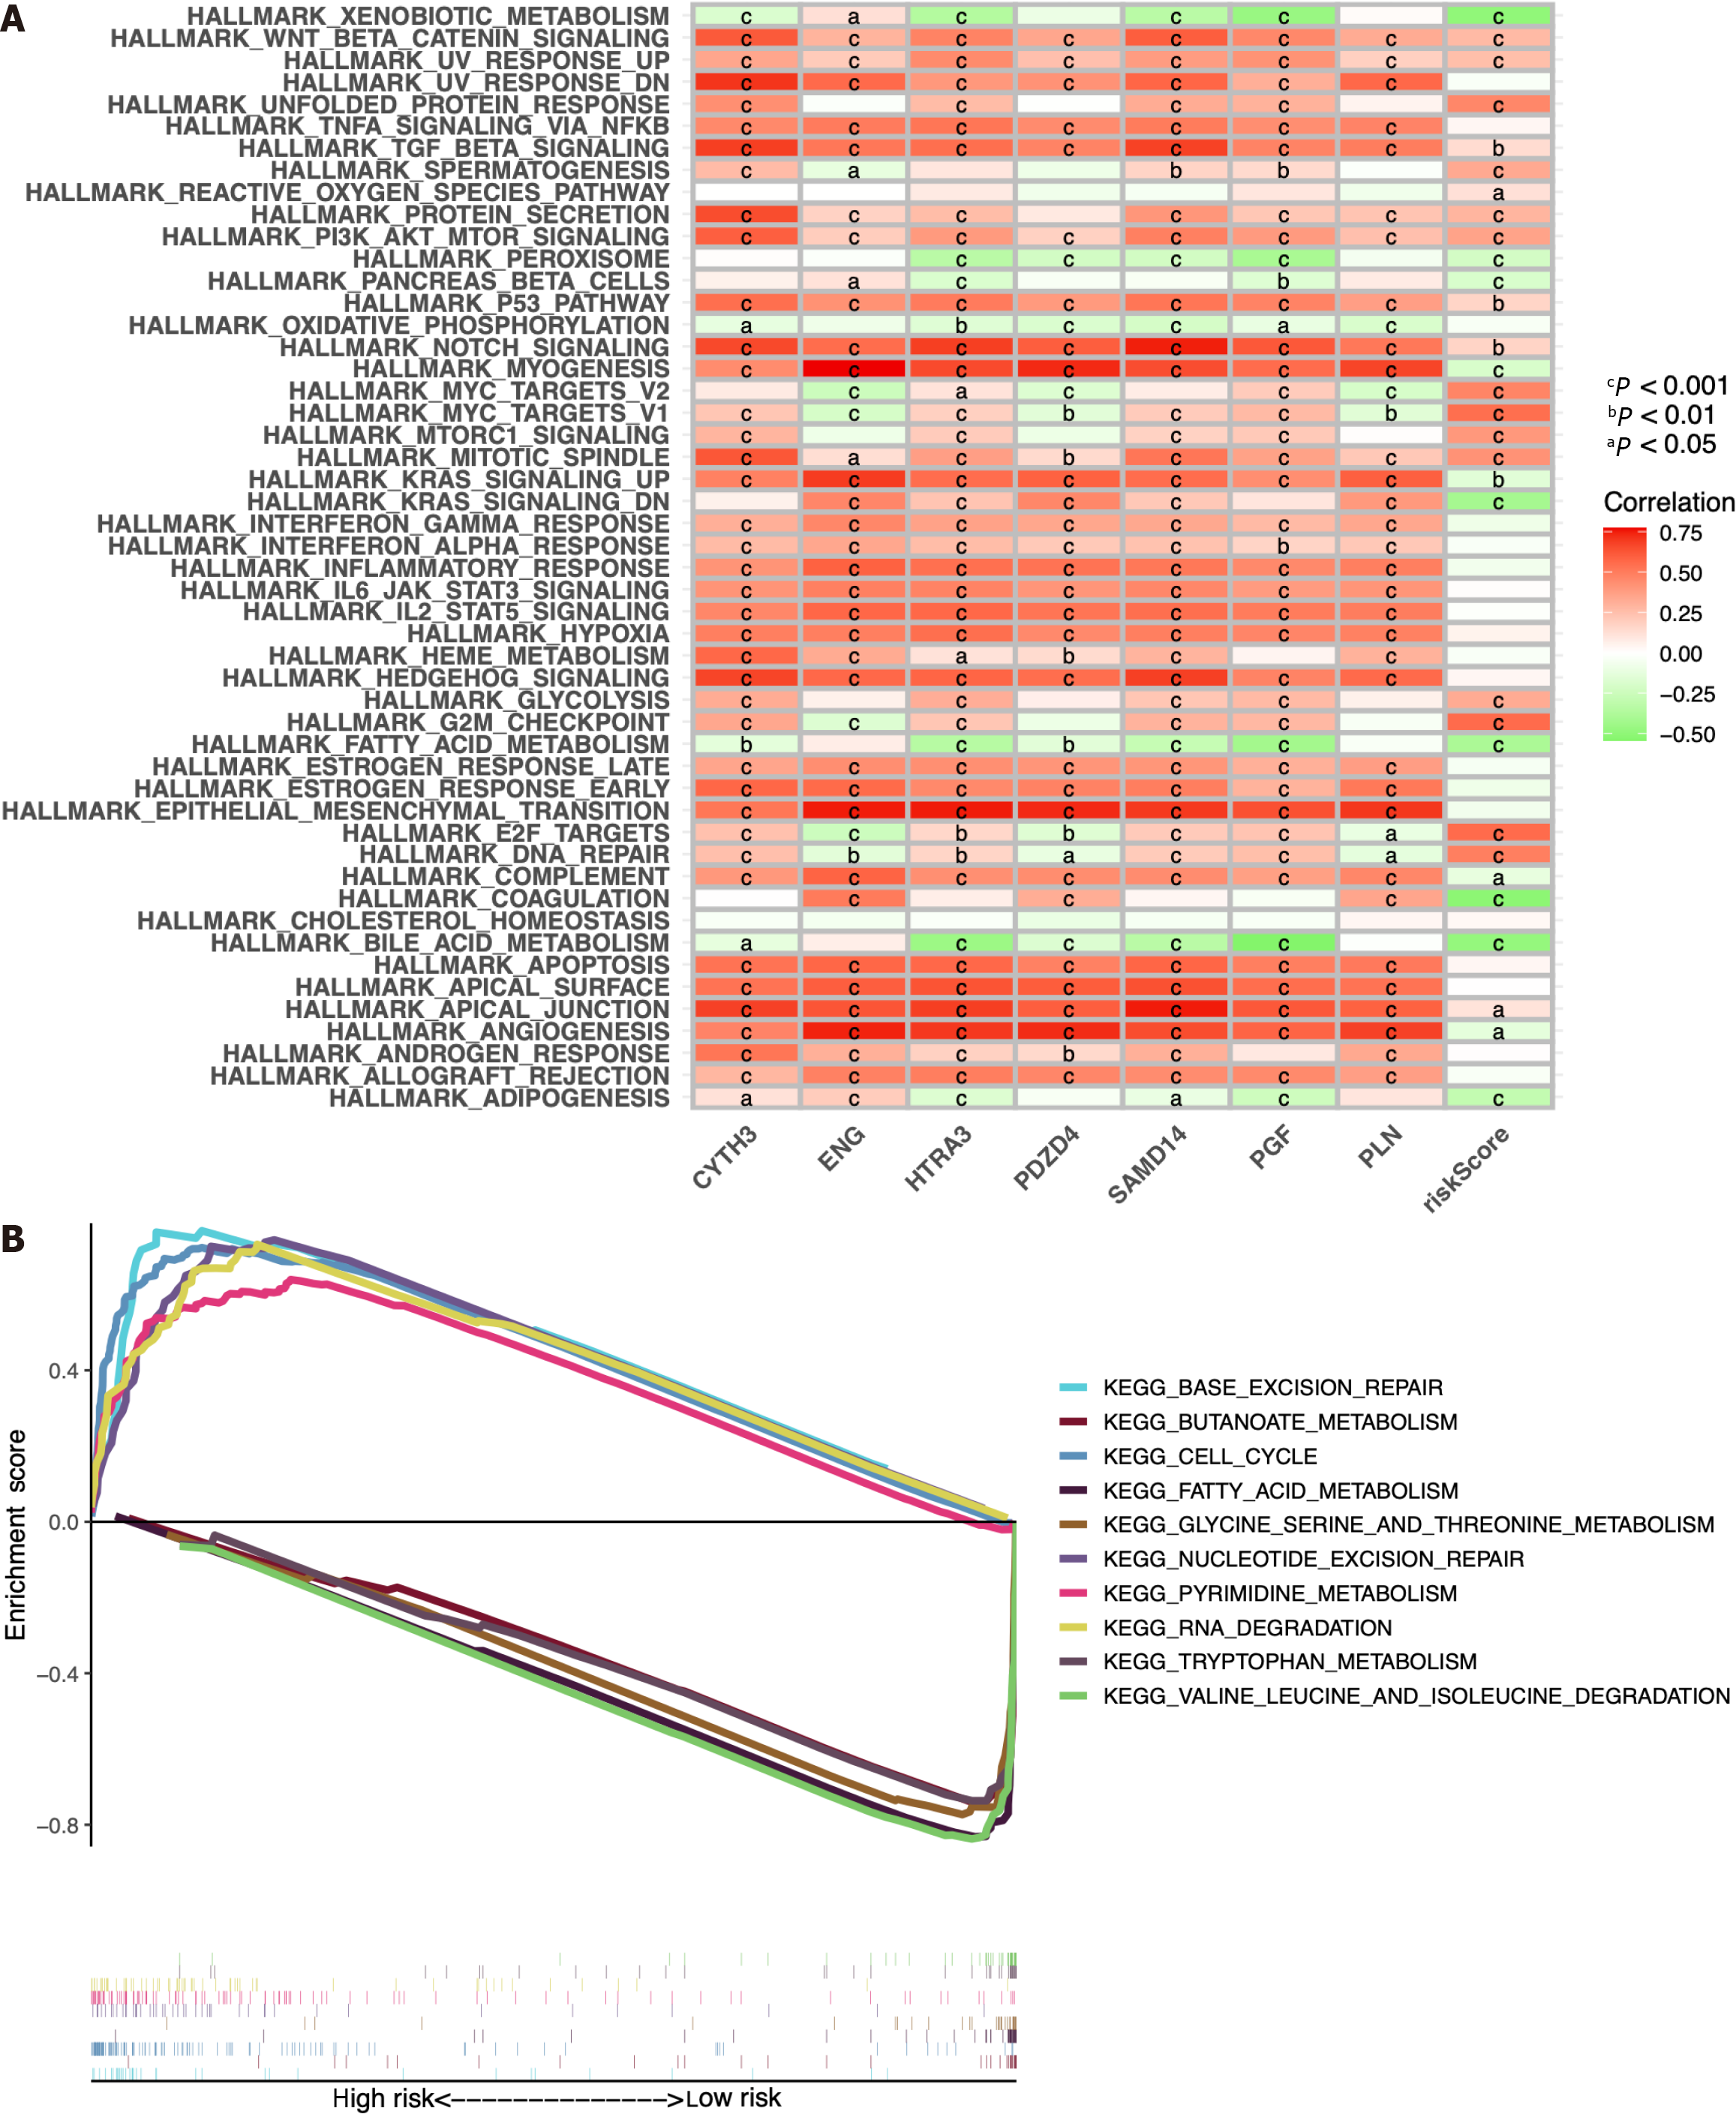
The predictive ability of the seven ICRGs and the risk score can be attributed to their key roles in tumorigenesis and metastasis. Thus, we further explored the richness differences by GSVA on the seven ICRGs and risk score. As GSEA enrichment depicted in Figure 11A, we observed that several pathways that are correlated with tumorigenesis and T cells were positively related to the risk score, including WNT_BETA_CATENIN_SIGNALING, TGF_BETA_SIGNALING, PI3K_AKT_MTOR_SIGNALING, MYC_TARGETS, MTORC1_SIGNALING, MITOTIC_SPINDLE, GLYCOLYSIS, G2M_CHECKPOINT, E2F_TARGETS, and DNA_REPAIR. Some pathways were negatively related to the risk score, such as XENOBIOTIC_METABOLISM, PEROXISOME, and KRAS_SIGNALING.
Meanwhile, GSEA method was employed to investigate the potential involvement of signaling pathways in HCC patients of the two groups. We selected the ten pathways with the highest enrichment scores, and the findings indicated that PYRIMIDINE_METABOLISM, BASE_EXCISION_REPAIR, RNA_DEGRADATION, NUCLEOTIDE_ EXCI
In this study, we identified seven prognostic ICRGs from all the immune cell-related genes in the TCGA database and established and validated a well-worked prognostic model for HCC patients based on the TCGA and ICGC datasets. To the best of our knowledge, this was the first time that the prognostic genes of HCC were screened from all the immune cell-related genes by WGCNA. To date, plenty of research has explored the associations between specific subtypes of immune cells and HCC to construct a prognostic model based on them. For example, a four-gene signature and nomo
With this conjecture, we screened seven prognostic genes in the black module, namely, CYTH3, ENG, HTRA3, PDZD4, SAMD14, PGF, and PLN, from the entire immune cell gene pool through WGCNA, LASSO regression, and Cox regression analysis. Interestingly, what we found proved the correctness of our conjecture. Here, we observed that the prognostic model based on the seven ICRGs had a good predictive ability in the TCGA and ICGC datasets, which was verified by the finding that patients with higher risk scores had a shorter OS. The AUC values of the various clinical features indicated that the risk score exhibited the highest level of predictability. Through time-dependent ROC analysis, the AUC values were determined to be 0.762, 0.748, and 0.757 at 1, 3, and 5 years based on the TCGA dataset, and they were 0.794, 0.778, and 0.776 at 1, 3 and 5 years based on the ICGC dataset, respectively, which all indicated that the signature worked well in the prediction of HCC patients’ survival. Then, we noticed that the seven ICRGs in the black module had a strong correlation with the T-cell population, which consisted of CD8+ T cells, resting memory CD4+ T cells, activated memory CD4+ T cells, follicular helper T cells, and regulatory T cells (Tregs) in HCC[15]. Thus, we mainly focused on the subtypes of T cells here. After a thorough literature search, it was found that the expression of ENG, HTRA3, PDZD4, PGF, and PLN was reported to be associated with HCC, while HTRA3, PDZD4, and PLN were only reported to be included in the prognostic model of HCC[16,17]. High endoglin (ENG) expression in endothelial cells might activate HCC cell adhesion and endothelial functions[18]. ENG is also regarded as a mediator that stimulates T-cell activation, proliferation, and Th1 cytokine secretion to promote T-cell-mediated cytolysis in cancer treatment[19]. PGF (placental growth factor) produced by cancer-associated fibroblasts facilitates neoangiogenesis in HCC[20]. PGF can be secreted by the Th17 subset of helper T cells to promote angiogenesis and thus participate in Th17 differentiation in inflammation[21]. For CYTH3 and PDZD4, there have been no reports on their association with either HCC or any subtype of T cells until now.
Next, the genomic features of the seven-ICRG prognostic model were explored. Wang et al[22] found that TP53 and CTNNB1 are two of the most commonly mutated genes in Chinese HCC patients. In our research, we found that CTNNB1 (26%) was most enriched in the low-risk group, while TP53 (38%) was the most enriched. CTNNB1 activation promoted immune escape by impairing T-cell activity in HCC[23]. Somatic mutations in CTNNB1 were found to antagonize increasing levels of T-cell cytotoxicity or immunological shifts toward cytotoxic CD8+ T cells, leading to the failure of chemotherapy for HCC[24]. TP53, encoded by the most commonly mutated cancer driver gene, might cooperate with EGF domain-specific O-linked N-acetylglucosamine transferase (EOGT) to reduce the proportion of CD8+ T cells and impair regulatory T-cell differentiation in HCC[25]. Here, we noticed that the lowest survival probability occurred in patients in the high-risk and high-TMB group, which indicated that that TMB has the potential to serve as a standalone variable in survival analysis, owing to its capacity to modulate immune status.
Then, the TME of HCC was analyzed based on the risk model. CD8+ T cells were more related to a decrease in patient risk, while CD4+ T cells and Tregs were associated with higher risk scores. It is well known that elevated levels of cytotoxic CD8+ T cells are associated with stronger antitumor effects, and low levels of CD8+ T cells are correlated with poor HCC outcomes[26]. The presence of CD4+ T cells promotes the proliferation and activation of CD8+ T cells to avoid CD8+ T-cell exhaustion. CD4+ T cells are indispensable for the secondary expansion and memory of CD8+ T lymphocytes[27]. In fact, CD4+ T cells often become exhausted as HCC progresses. Furthermore, we conducted ssGSEA and found that CD8+ T cells and cytolytic activity were enriched in the low-risk group. No significant difference was observed between the two risk groups in CD4+ T cells, which suggested that the collapse of CD8+ T cells might contribute to insufficient CD4+ T cells. In addition, a further detailed analysis of the immune infiltration of HCC was performed to identify the role of the risk score in immune infiltration. The results showed that the enrichment of C1 (wound healing) mainly occurred in patients belonging to the high-risk group in the analysis of the TME. As previously reported, the wound-healing response could participate in promoting the development of HCC[28]. T cells coordinate with other proinflammatory cytokines and chemokines to participate in hepatic fibrosis, which is regarded as a wound-healing response in HCC[29]. In addition, significant differences were detected between the two risk groups with regard to stromal score, immune score, estimate score, and RNAss, which again emphasized that the seven ICRG-related TME might facilitate the development of HCC and that RNAss could be involved.
A comparison between the risk score and ICPs or ICB therapy was conducted to identify beneficial targets for immunotherapy and evaluate the efficacy of immunotherapy. Immune checkpoints, such as VTCN1, TNFSF9, TNFSF4, TNFSF18, TNFSF15, TNFRSF9, TNFRSF4, and TNFRSF18, were positively related to the risk score, which suggests that targeted and specific treatments should be carried out for the two risk groups. Moreover, the IPS, IPS-CTLA4, IPS-PD1, and IPS-PD1-CTLA4 immune checkpoint scores were higher in the low-risk group, suggesting that patients in the low-risk group might have a better response to immunotherapy. PD-1 and CTLA-4, checkpoint receptors that can be targeted to relieve the exhaustion of CD8+ T cells, were enriched in the low-risk group[30]. PD1 inhibitors might directly act on CD8+ T-cell cells to enhance the antitumor effect in this risk group.
In recent studies, immune checkpoint inhibitors (ICIs) plus tyrosine kinase inhibitors (TKIs), which are antiangiogenic drugs, seemed more effective in antitumor therapy, especially in reversing the immunosuppressive profile of the TME and improving the efficacy, OS, and safety profile[31]. We must be more cautious in the utilization of ICIs for HCC treatment, given the escalating incidence of HCC cases attributed to "metabolic" and "metabolic + alcohol" etiologies, as well as the intricate interplay between liver metabolism and immune system regulation[32,33]. In addition, Tregs are the most prevalent suppressor cells in the TME and express immune checkpoints such as PD-1 and CTLA-4, showing a potential therapeutic role of targeting Tregs in HCC treatment[34]. In our research, we observed an association between Tregs and patients at higher risk, suggesting that PD-1 and CTLA-4 might have the potential to alleviate patients by specifically targeting Tregs. Furthermore, the utilization of transarterial chemoembolization (TACE) has the potential to stimulate the generation of antigen-specific CD4+ and CD8+ T cells in patients with HCC, thus rendering the combination of TACE and ICI treatment highly promising in terms of its application prospects[35]. Radiogenomics research associated with TME heterogeneity has also made progress in recent years. Wang et al[36] established a CT-derived radiomics signature based on seven hub genes and revealed infiltration of CD4+ T cells, plasma cells, and macrophages among different risk groups. It is noteworthy that an Austrian team had devised an ART score for assessing the potential efficacy of repeated TACE treatments in patients, although this score had not yet undergone clinical validation[37]. These results suggest that additional clinical validation is needed for the exploration of the TME and ICIs in our research.
HCC exhibits significant resistance to various chemotherapy agents, whether administered as monotherapy or in combination. Therefore, it is imperative to select suitable chemotherapy medications that have obtained approval from the Food and Drug Administration for patients at varying levels of risk. In our investigation, it was observed that patients classified in the high-risk category exhibited heightened sensitivity to gemcitabine, whereas axitinib, dasatinib, and erlotinib may potentially yield more favorable outcomes in low-risk patients. Then, the data from a total of 60 distinct cell lines was scrutinized in order to identify additional chemotherapy agents that could augment the efficacy of gene-targeted drugs while mitigating the risk of drug resistance. For instance, increased expression of SAMD14 gene was observed to render cancer cells more susceptible to bleomycin. Based on the aforementioned findings, it is possible that future advancements in precision strategies could unveil novel directions for drug treatment in HCC.
In the final analysis, we hoped to identify some representative functional pathways involved in the immune-related progression of HCC, especially those on T-cell regulation. Several pathways, such as the Wnt/β-catenin pathway and the TGF-β signaling pathway, have been reported to correlate with T-cell regulation in the TME of HCC. Inhibition of the Wnt/β-catenin pathway has been reported to boost the infiltration and IFN-γ production of TIL CD8+ T cells and reduce the number of Tregs[38]. Inhibition of TGF-β promoted the activity of CD8+ T cells and reduced the action of CD4+ Treg cells by interrupting the differentiation of M2-type macrophages in HCC[39]. Tregs were induced under stimulation with lactate, via the PI3K/Akt/mTOR signaling pathway, to establish immunosuppression in HCC[40]. Meanwhile, GSEA between the high- and low-risk groups showed that cell cycle regulation (PYRIMIDINE_METABOLISM, BASE_EXCISION_REPAIR, RNA_DEGRADATION, NUCLEOTIDE_EXCISION_REPAIR and CELL_CYCLE) might be an important pathway in the TME of HCC. Although T-cell proliferation rarely occurred in infiltration analysis of HCC in this study, other studies have observed that Tregs were elevated and proliferated to fight against the antitumor immunity of HCC patients[41,42]. The metabolism of some amino acids (tryptophan, alanine, leucine, glycine, threonine, etc.) was related to the low-risk group. The metabolism of various amino acids in shaping tumor immunity and therapeutic efficacy in patients with cancer has long been investigated[43]. For example, alanine deprivation delays naive and memory T-cell activation to impact the TME[44]. By adding tryptophan, IDO(+) MΦ-suppressed T-cell responses could be reversed in the TME of HCC[45]. T cells showed a defective response to antigen stimulation in SLC7A5-deficient mice because of leucine transportation failure[46]. Targeting the metabolism of various amino acids might be worthy of clinical application in the treatment of HCC.
In conclusion, we identified seven prognostic genes that are closely related to the immune-related TME in HCC. A novel prognostic model based on the seven ICRGs was constructed to predict the OS and prognosis of HCC patients. The related potential functional information and TME profile of the seven ICRGs were explored and depicted in HCC as well. The established prognostic model and several potential chemotherapy drugs identified could provide useful insights into the potential clinical treatment of HCC.
Hepatocellular carcinoma (HCC) is a common cancer that has the highest prevalence among liver cancer subtypes. The overall five-year survival rate of HCC is less than 5%. Thus, it is necessary to explore novel prognostic biomarkers and risk models for this malignancy.
To investigate the relationship between immune cells and HCC, and establish a prognostic model.
To develop a novel immune cell-related prognostic model of HCC and depict the basic profile of the immune response in HCC.
Clinical information and gene expression data of HCC were obtained from The Cancer Genome Atlas (TCGA) and International Cancer Genome Consortium (ICGC) datasets. TCGA and ICGC datasets were used for screening prognostic genes along with developing and validating a seven-gene prognostic survival model by weighted gene coexpression network analysis and least absolute shrinkage and selection operator regression with Cox regression. Based on the prognostic genes identified, we further performed the relative analysis of tumor mutation burden, tumor microenvironment cell infiltration, immune checkpoints, immune therapy, and functional pathways.
Seven prognostic genes were identified for signature construction, which showed a good performance for survival prediction. A significant difference was observed in stromal score, immune score, and estimate score between he high-risk and low-risk groups stratified based on the risk score derived from the seven-gene prognostic model.. Several immune checkpoints were found to be associated with the seven prognostic genes and risk score. Targeting CTLA4 and PD1 receptors and potential chemotherapy drugs might be helpful for specific HCC therapies. Cell cycle regulation and metabolism of some amino acids were also identified as special signaling pathways.
A novel seven-gene (CYTH3, ENG, HTRA3, PDZD4, SAMD14, PGF, and PLN) prognostic model was successfully established and showed high predictive efficiency. The basic profile of the immune response in HCC might be worthy of clinical application.
The novel seven-gene immune-cell related prognostic model might be useful for revealing the basic profile of immune response in HCC. Potential chemotherapy drugs could provide useful insights into the potential clinical treatment of HCC.
Provenance and peer review: Unsolicited article; Externally peer reviewed.
Peer-review model: Single blind
Specialty type: Biology
Country/Territory of origin: China
Peer-review report’s scientific quality classification
Grade A (Excellent): 0
Grade B (Very good): B
Grade C (Good): C
Grade D (Fair): 0
Grade E (Poor): 0
P-Reviewer: Elshimi E, Egypt; Granito A, Italy S-Editor: Liu JH L-Editor: Wang TQ P-Editor: Zhang XD
| 1. | Bray F, Ferlay J, Soerjomataram I, Siegel RL, Torre LA, Jemal A. Global cancer statistics 2018: GLOBOCAN estimates of incidence and mortality worldwide for 36 cancers in 185 countries. CA Cancer J Clin. 2018;68:394-424. [RCA] [PubMed] [DOI] [Full Text] [Cited by in Crossref: 53206] [Cited by in RCA: 56553] [Article Influence: 7069.1] [Reference Citation Analysis (134)] |
| 2. | Allemani C, Weir HK, Carreira H, Harewood R, Spika D, Wang XS, Bannon F, Ahn JV, Johnson CJ, Bonaventure A, Marcos-Gragera R, Stiller C, Azevedo e Silva G, Chen WQ, Ogunbiyi OJ, Rachet B, Soeberg MJ, You H, Matsuda T, Bielska-Lasota M, Storm H, Tucker TC, Coleman MP; CONCORD Working Group. Global surveillance of cancer survival 1995-2009: analysis of individual data for 25,676,887 patients from 279 population-based registries in 67 countries (CONCORD-2). Lancet. 2015;385:977-1010. [RCA] [PubMed] [DOI] [Full Text] [Cited by in Crossref: 1738] [Cited by in RCA: 1776] [Article Influence: 161.5] [Reference Citation Analysis (0)] |
| 3. | Gentles AJ, Newman AM, Liu CL, Bratman SV, Feng W, Kim D, Nair VS, Xu Y, Khuong A, Hoang CD, Diehn M, West RB, Plevritis SK, Alizadeh AA. The prognostic landscape of genes and infiltrating immune cells across human cancers. Nat Med. 2015;21:938-945. [RCA] [PubMed] [DOI] [Full Text] [Cited by in Crossref: 2244] [Cited by in RCA: 2439] [Article Influence: 221.7] [Reference Citation Analysis (0)] |
| 4. | Ge P, Wang W, Li L, Zhang G, Gao Z, Tang Z, Dang X, Wu Y. Profiles of immune cell infiltration and immune-related genes in the tumor microenvironment of colorectal cancer. Biomed Pharmacother. 2019;118:109228. [RCA] [PubMed] [DOI] [Full Text] [Cited by in Crossref: 103] [Cited by in RCA: 175] [Article Influence: 25.0] [Reference Citation Analysis (0)] |
| 5. | Ye L, Li Y, Tang H, Liu W, Chen Y, Dai T, Liang R, Shi M, Yi S, Chen G, Yang Y. CD8+CXCR5+T cells infiltrating hepatocellular carcinomas are activated and predictive of a better prognosis. Aging (Albany NY). 2019;11:8879-8891. [RCA] [PubMed] [DOI] [Full Text] [Full Text (PDF)] [Cited by in Crossref: 20] [Cited by in RCA: 36] [Article Influence: 5.1] [Reference Citation Analysis (0)] |
| 6. | Lin CY, Lin CJ, Chen KH, Wu JC, Huang SH, Wang SM. Macrophage activation increases the invasive properties of hepatoma cells by destabilization of the adherens junction. FEBS Lett. 2006;580:3042-3050. [RCA] [PubMed] [DOI] [Full Text] [Cited by in Crossref: 54] [Cited by in RCA: 60] [Article Influence: 3.0] [Reference Citation Analysis (0)] |
| 7. | Cai XY, Gao Q, Qiu SJ, Ye SL, Wu ZQ, Fan J, Tang ZY. Dendritic cell infiltration and prognosis of human hepatocellular carcinoma. J Cancer Res Clin Oncol. 2006;132:293-301. [RCA] [PubMed] [DOI] [Full Text] [Full Text (PDF)] [Cited by in Crossref: 81] [Cited by in RCA: 74] [Article Influence: 3.7] [Reference Citation Analysis (0)] |
| 8. | Chen M, Wu GB, Hua S, Zhao ZF, Li HJ, Luo M. Identification and validation of a prognostic model of necroptosis-related lncRNAs in hepatocellular carcinoma. Front Genet. 2022;13:907859. [RCA] [PubMed] [DOI] [Full Text] [Full Text (PDF)] [Cited by in RCA: 13] [Reference Citation Analysis (0)] |
| 9. | Chen M, Wu GB, Xie ZW, Shi DL, Luo M. A novel diagnostic four-gene signature for hepatocellular carcinoma based on artificial neural network: Development, validation, and drug screening. Front Genet. 2022;13:942166. [RCA] [PubMed] [DOI] [Full Text] [Full Text (PDF)] [Cited by in RCA: 5] [Reference Citation Analysis (0)] |
| 10. | Yang Z, Zi Q, Xu K, Wang C, Chi Q. Development of a macrophages-related 4-gene signature and nomogram for the overall survival prediction of hepatocellular carcinoma based on WGCNA and LASSO algorithm. Int Immunopharmacol. 2021;90:107238. [RCA] [PubMed] [DOI] [Full Text] [Cited by in Crossref: 17] [Cited by in RCA: 54] [Article Influence: 9.0] [Reference Citation Analysis (0)] |
| 11. | Ding H, Hu H, Tian F, Liang H. A dual immune signature of CD8+ T cells and MMP9 improves the survival of patients with hepatocellular carcinoma. Biosci Rep. 2021;41. [RCA] [PubMed] [DOI] [Full Text] [Full Text (PDF)] [Cited by in Crossref: 1] [Cited by in RCA: 11] [Article Influence: 2.2] [Reference Citation Analysis (0)] |
| 12. | Hong GQ, Cai D, Gong JP, Lai X. Innate immune cells and their interaction with T cells in hepatocellular carcinoma. Oncol Lett. 2021;21:57. [RCA] [PubMed] [DOI] [Full Text] [Full Text (PDF)] [Cited by in Crossref: 5] [Cited by in RCA: 13] [Article Influence: 2.6] [Reference Citation Analysis (0)] |
| 13. | Biswas SK, Mantovani A. Macrophage plasticity and interaction with lymphocyte subsets: cancer as a paradigm. Nat Immunol. 2010;11:889-896. [RCA] [PubMed] [DOI] [Full Text] [Cited by in Crossref: 2390] [Cited by in RCA: 3003] [Article Influence: 187.7] [Reference Citation Analysis (0)] |
| 14. | Zhao YB, Yang SH, Shen J, Deng K, Li Q, Wang Y, Cui W, Ye H. Interaction between regulatory T cells and mast cells via IL-9 and TGF-β production. Oncol Lett. 2020;20:360. [RCA] [PubMed] [DOI] [Full Text] [Full Text (PDF)] [Cited by in Crossref: 7] [Cited by in RCA: 17] [Article Influence: 2.8] [Reference Citation Analysis (0)] |
| 15. | Zheng C, Zheng L, Yoo JK, Guo H, Zhang Y, Guo X, Kang B, Hu R, Huang JY, Zhang Q, Liu Z, Dong M, Hu X, Ouyang W, Peng J, Zhang Z. Landscape of Infiltrating T Cells in Liver Cancer Revealed by Single-Cell Sequencing. Cell. 2017;169:1342-1356.e16. [RCA] [PubMed] [DOI] [Full Text] [Cited by in Crossref: 1011] [Cited by in RCA: 1584] [Article Influence: 176.0] [Reference Citation Analysis (6)] |
| 16. | Xu YJ, He MK, Liu S, Huang LC, Bu XY, Kan A, Shi M. Construction of a single nucleotide variant score-related gene-based prognostic model in hepatocellular carcinoma: analysis of multi-independent databases and validation in vitro. Cancer Cell Int. 2021;21:610. [RCA] [PubMed] [DOI] [Full Text] [Full Text (PDF)] [Cited by in Crossref: 1] [Cited by in RCA: 5] [Article Influence: 1.0] [Reference Citation Analysis (0)] |
| 17. | Kong W, Gao M, Jin Y, Huang W, Huang Z, Xie Z. Prognostic model of patients with liver cancer based on tumor stem cell content and immune process. Aging (Albany NY). 2020;12:16555-16578. [RCA] [PubMed] [DOI] [Full Text] [Full Text (PDF)] [Cited by in Crossref: 3] [Cited by in RCA: 12] [Article Influence: 2.0] [Reference Citation Analysis (0)] |
| 18. | Mohr T, Katz S, Paulitschke V, Aizarani N, Tolios A. Systematic Analysis of the Transcriptome Profiles and Co-Expression Networks of Tumour Endothelial Cells Identifies Several Tumour-Associated Modules and Potential Therapeutic Targets in Hepatocellular Carcinoma. Cancers (Basel). 2021;13. [RCA] [PubMed] [DOI] [Full Text] [Full Text (PDF)] [Cited by in Crossref: 2] [Cited by in RCA: 5] [Article Influence: 1.0] [Reference Citation Analysis (0)] |
| 19. | Zhong L, Shi W, Gan L, Liu X, Huo Y, Wu P, Zhang Z, Wu T, Peng H, Huang Y, Zhao Y, Yuan Y, Deng Z, Tang H. Human endoglin-CD3 bispecific T cell engager antibody induces anti-tumor effect in vivo. Theranostics. 2021;11:6393-6406. [RCA] [PubMed] [DOI] [Full Text] [Full Text (PDF)] [Cited by in Crossref: 3] [Cited by in RCA: 5] [Article Influence: 1.0] [Reference Citation Analysis (0)] |
| 20. | Liu Z, Chen M, Zhao R, Huang Y, Liu F, Li B, Qin Y. CAF-induced placental growth factor facilitates neoangiogenesis in hepatocellular carcinoma. Acta Biochim Biophys Sin (Shanghai). 2020;52:18-25. [RCA] [PubMed] [DOI] [Full Text] [Cited by in Crossref: 20] [Cited by in RCA: 31] [Article Influence: 5.2] [Reference Citation Analysis (0)] |
| 21. | Yoo SA, Kim M, Kang MC, Kong JS, Kim KM, Lee S, Hong BK, Jeong GH, Lee J, Shin MG, Kim YG, Apicella I, Cicatiello V, De Falco S, Yoon CH, Cho CS, Ryoo ZY, Lee SH, Kim WU. Placental growth factor regulates the generation of T(H)17 cells to link angiogenesis with autoimmunity. Nat Immunol. 2019;20:1348-1359. [RCA] [PubMed] [DOI] [Full Text] [Cited by in Crossref: 23] [Cited by in RCA: 43] [Article Influence: 6.1] [Reference Citation Analysis (0)] |
| 22. | Wang S, Shi H, Liu T, Li M, Zhou S, Qiu X, Wang Z, Hu W, Guo W, Chen X, Guo H, Shi X, Shi J, Zang Y, Cao J, Wu L. Mutation profile and its correlation with clinicopathology in Chinese hepatocellular carcinoma patients. Hepatobiliary Surg Nutr. 2021;10:172-179. [RCA] [PubMed] [DOI] [Full Text] [Cited by in Crossref: 6] [Cited by in RCA: 35] [Article Influence: 7.0] [Reference Citation Analysis (0)] |
| 23. | Ruiz de Galarreta M, Bresnahan E, Molina-Sánchez P, Lindblad KE, Maier B, Sia D, Puigvehi M, Miguela V, Casanova-Acebes M, Dhainaut M, Villacorta-Martin C, Singhi AD, Moghe A, von Felden J, Tal Grinspan L, Wang S, Kamphorst AO, Monga SP, Brown BD, Villanueva A, Llovet JM, Merad M, Lujambio A. β-Catenin Activation Promotes Immune Escape and Resistance to Anti-PD-1 Therapy in Hepatocellular Carcinoma. Cancer Discov. 2019;9:1124-1141. [RCA] [PubMed] [DOI] [Full Text] [Cited by in Crossref: 266] [Cited by in RCA: 681] [Article Influence: 97.3] [Reference Citation Analysis (0)] |
| 24. | Hong JY, Cho HJ, Sa JK, Liu X, Ha SY, Lee T, Kim H, Kang W, Sinn DH, Gwak GY, Choi MS, Lee JH, Koh KC, Paik SW, Park HC, Kang TW, Rhim H, Lee SJ, Cristescu R, Lee J, Paik YH, Lim HY. Hepatocellular carcinoma patients with high circulating cytotoxic T cells and intra-tumoral immune signature benefit from pembrolizumab: results from a single-arm phase 2 trial. Genome Med. 2022;14:1. [RCA] [PubMed] [DOI] [Full Text] [Full Text (PDF)] [Cited by in Crossref: 61] [Cited by in RCA: 102] [Article Influence: 25.5] [Reference Citation Analysis (0)] |
| 25. | Shu Y, He L, Gao M, Xiao F, Yang J, Wang S, Wei H, Zhang F. EOGT Correlated With Immune Infiltration: A Candidate Prognostic Biomarker for Hepatocellular Carcinoma. Front Immunol. 2021;12:780509. [RCA] [PubMed] [DOI] [Full Text] [Full Text (PDF)] [Cited by in Crossref: 3] [Cited by in RCA: 10] [Article Influence: 2.5] [Reference Citation Analysis (0)] |
| 26. | Guo M, Yuan F, Qi F, Sun J, Rao Q, Zhao Z, Huang P, Fang T, Yang B, Xia J. Expression and clinical significance of LAG-3, FGL1, PD-L1 and CD8(+)T cells in hepatocellular carcinoma using multiplex quantitative analysis. J Transl Med. 2020;18:306. [RCA] [PubMed] [DOI] [Full Text] [Full Text (PDF)] [Cited by in Crossref: 40] [Cited by in RCA: 110] [Article Influence: 18.3] [Reference Citation Analysis (0)] |
| 27. | Shirabe K, Motomura T, Muto J, Toshima T, Matono R, Mano Y, Takeishi K, Ijichi H, Harada N, Uchiyama H, Yoshizumi T, Taketomi A, Maehara Y. Tumor-infiltrating lymphocytes and hepatocellular carcinoma: pathology and clinical management. Int J Clin Oncol. 2010;15:552-558. [RCA] [PubMed] [DOI] [Full Text] [Cited by in Crossref: 40] [Cited by in RCA: 52] [Article Influence: 3.3] [Reference Citation Analysis (0)] |
| 28. | Luedde T, Schwabe RF. NF-κB in the liver--linking injury, fibrosis and hepatocellular carcinoma. Nat Rev Gastroenterol Hepatol. 2011;8:108-118. [RCA] [PubMed] [DOI] [Full Text] [Full Text (PDF)] [Cited by in Crossref: 1094] [Cited by in RCA: 1122] [Article Influence: 74.8] [Reference Citation Analysis (0)] |
| 29. | Kleeman CR, Massry SG, Coburn JW. The clinical physiology of calcium homeostasis, parathyroid hormone an, and calcitonin. I. Calif Med. 1971;114:16-43. [PubMed] |
| 30. | Farhood B, Najafi M, Mortezaee K. CD8(+) cytotoxic T lymphocytes in cancer immunotherapy: A review. J Cell Physiol. 2019;234:8509-8521. [RCA] [PubMed] [DOI] [Full Text] [Cited by in Crossref: 535] [Cited by in RCA: 1211] [Article Influence: 151.4] [Reference Citation Analysis (5)] |
| 31. | Stefanini B, Ielasi L, Chen R, Abbati C, Tonnini M, Tovoli F, Granito A. TKIs in combination with immunotherapy for hepatocellular carcinoma. Expert Rev Anticancer Ther. 2023;23:279-291. [RCA] [PubMed] [DOI] [Full Text] [Cited by in Crossref: 74] [Cited by in RCA: 86] [Article Influence: 28.7] [Reference Citation Analysis (0)] |
| 32. | Garuti F, Neri A, Avanzato F, Gramenzi A, Rampoldi D, Rucci P, Farinati F, Giannini EG, Piscaglia F, Rapaccini GL, Di Marco M, Caturelli E, Zoli M, Sacco R, Cabibbo G, Marra F, Mega A, Morisco F, Gasbarrini A, Svegliati-Baroni G, Foschi FG, Missale G, Masotto A, Nardone G, Raimondo G, Azzaroli F, Vidili G, Brunetto MR, Trevisani F; ITA. LI.CA study group. The changing scenario of hepatocellular carcinoma in Italy: an update. Liver Int. 2021;41:585-597. [RCA] [PubMed] [DOI] [Full Text] [Cited by in Crossref: 77] [Cited by in RCA: 82] [Article Influence: 16.4] [Reference Citation Analysis (0)] |
| 33. | Peiseler M, Schwabe R, Hampe J, Kubes P, Heikenwälder M, Tacke F. Immune mechanisms linking metabolic injury to inflammation and fibrosis in fatty liver disease - novel insights into cellular communication circuits. J Hepatol. 2022;77:1136-1160. [RCA] [PubMed] [DOI] [Full Text] [Cited by in Crossref: 22] [Cited by in RCA: 366] [Article Influence: 91.5] [Reference Citation Analysis (0)] |
| 34. | Granito A, Muratori L, Lalanne C, Quarneti C, Ferri S, Guidi M, Lenzi M, Muratori P. Hepatocellular carcinoma in viral and autoimmune liver diseases: Role of CD4+ CD25+ Foxp3+ regulatory T cells in the immune microenvironment. World J Gastroenterol. 2021;27:2994-3009. [RCA] [PubMed] [DOI] [Full Text] [Full Text (PDF)] [Cited by in CrossRef: 122] [Cited by in RCA: 141] [Article Influence: 28.2] [Reference Citation Analysis (1)] |
| 35. | Llovet JM, De Baere T, Kulik L, Haber PK, Greten TF, Meyer T, Lencioni R. Locoregional therapies in the era of molecular and immune treatments for hepatocellular carcinoma. Nat Rev Gastroenterol Hepatol. 2021;18:293-313. [RCA] [PubMed] [DOI] [Full Text] [Cited by in Crossref: 174] [Cited by in RCA: 680] [Article Influence: 136.0] [Reference Citation Analysis (0)] |
| 36. | Wang D, Zhang L, Sun Z, Jiang H, Zhang J. A radiomics signature associated with underlying gene expression pattern for the prediction of prognosis and treatment response in hepatocellular carcinoma. Eur J Radiol. 2023;167:111086. [RCA] [PubMed] [DOI] [Full Text] [Cited by in RCA: 22] [Reference Citation Analysis (0)] |
| 37. | Terzi E, Terenzi L, Venerandi L, Croci L, Renzulli M, Mosconi C, Allegretti G, Granito A, Golfieri R, Bolondi L, Piscaglia F. The ART score is not effective to select patients for transarterial chemoembolization retreatment in an Italian series. Dig Dis. 2014;32:711-716. [RCA] [PubMed] [DOI] [Full Text] [Cited by in Crossref: 39] [Cited by in RCA: 47] [Article Influence: 3.9] [Reference Citation Analysis (1)] |
| 38. | Huang Y, Sheng H, Xiao Y, Hu W, Zhang Z, Chen Y, Zhu Z, Wu D, Cao C, Sun J. Wnt/β-catenin inhibitor ICG-001 enhances the antitumor efficacy of radiotherapy by increasing radiation-induced DNA damage and improving tumor immune microenvironment in hepatocellular carcinoma. Radiother Oncol. 2021;162:34-44. [RCA] [PubMed] [DOI] [Full Text] [Cited by in Crossref: 5] [Cited by in RCA: 34] [Article Influence: 6.8] [Reference Citation Analysis (0)] |
| 39. | de Gramont A, Faivre S, Raymond E. Novel TGF-β inhibitors ready for prime time in onco-immunology. Oncoimmunology. 2017;6:e1257453. [RCA] [PubMed] [DOI] [Full Text] [Full Text (PDF)] [Cited by in Crossref: 133] [Cited by in RCA: 158] [Article Influence: 15.8] [Reference Citation Analysis (0)] |
| 40. | Li X, Zhang Y, Ma W, Fu Q, Liu J, Yin G, Chen P, Dai D, Chen W, Qi L, Yu X, Xu W. Enhanced glucose metabolism mediated by CD147 contributes to immunosuppression in hepatocellular carcinoma. Cancer Immunol Immunother. 2020;69:535-548. [RCA] [PubMed] [DOI] [Full Text] [Cited by in Crossref: 17] [Cited by in RCA: 35] [Article Influence: 5.8] [Reference Citation Analysis (0)] |
| 41. | Unitt E, Rushbrook SM, Marshall A, Davies S, Gibbs P, Morris LS, Coleman N, Alexander GJ. Compromised lymphocytes infiltrate hepatocellular carcinoma: the role of T-regulatory cells. Hepatology. 2005;41:722-730. [RCA] [PubMed] [DOI] [Full Text] [Cited by in Crossref: 204] [Cited by in RCA: 222] [Article Influence: 10.6] [Reference Citation Analysis (0)] |
| 42. | Cao M, Cabrera R, Xu Y, Firpi R, Zhu H, Liu C, Nelson DR. Hepatocellular carcinoma cell supernatants increase expansion and function of CD4(+)CD25(+) regulatory T cells. Lab Invest. 2007;87:582-590. [RCA] [PubMed] [DOI] [Full Text] [Cited by in Crossref: 47] [Cited by in RCA: 60] [Article Influence: 3.2] [Reference Citation Analysis (0)] |
| 43. | Wang W, Zou W. Amino Acids and Their Transporters in T Cell Immunity and Cancer Therapy. Mol Cell. 2020;80:384-395. [RCA] [PubMed] [DOI] [Full Text] [Cited by in Crossref: 127] [Cited by in RCA: 210] [Article Influence: 35.0] [Reference Citation Analysis (0)] |
| 44. | Ron-Harel N, Ghergurovich JM, Notarangelo G, LaFleur MW, Tsubosaka Y, Sharpe AH, Rabinowitz JD, Haigis MC. T Cell Activation Depends on Extracellular Alanine. Cell Rep. 2019;28:3011-3021.e4. [RCA] [PubMed] [DOI] [Full Text] [Cited by in Crossref: 65] [Cited by in RCA: 155] [Article Influence: 25.8] [Reference Citation Analysis (0)] |
| 45. | Zhao Q, Kuang DM, Wu Y, Xiao X, Li XF, Li TJ, Zheng L. Activated CD69+ T cells foster immune privilege by regulating IDO expression in tumor-associated macrophages. J Immunol. 2012;188:1117-1124. [RCA] [PubMed] [DOI] [Full Text] [Cited by in Crossref: 102] [Cited by in RCA: 113] [Article Influence: 7.5] [Reference Citation Analysis (0)] |
| 46. | Hayashi K, Jutabha P, Endou H, Sagara H, Anzai N. LAT1 is a critical transporter of essential amino acids for immune reactions in activated human T cells. J Immunol. 2013;191:4080-4085. [RCA] [PubMed] [DOI] [Full Text] [Cited by in Crossref: 100] [Cited by in RCA: 137] [Article Influence: 10.5] [Reference Citation Analysis (0)] |


