Copyright
©2014 Baishideng Publishing Group Inc.
World J Clin Oncol. Dec 10, 2014; 5(5): 1060-1067
Published online Dec 10, 2014. doi: 10.5306/wjco.v5.i5.1060
Published online Dec 10, 2014. doi: 10.5306/wjco.v5.i5.1060
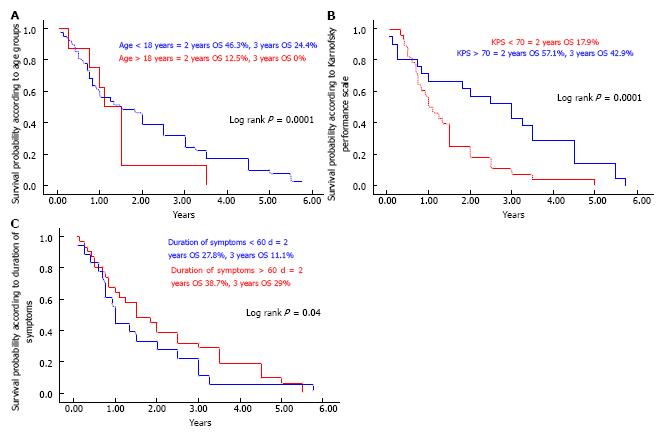
Figure 1 Kaplan-Meier curve.
A: Showing overall survival probability according to age groups (< 18 years vs > 18 years); B: Showing overall survival probability according to Karnofsky performance scale (< 70 vs > 70); C: Showing overall survival probability according to duration of symptoms (< 60 d vs > 60 d). OS: Overall survival.
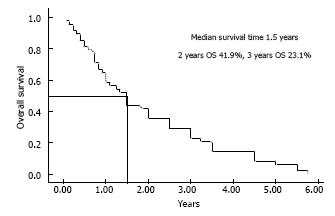
Figure 2 Median survival time, one, two and three years overall survival rates for whole cohort.
OS: Overall survival.
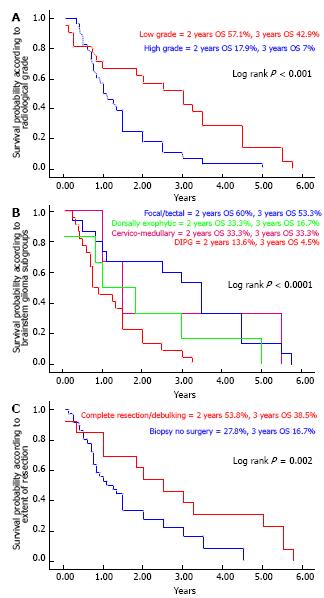
Figure 3 Kaplan-Meier curve.
A: Showing overall survival probability according to grade of tumors (< low grade vs high grade); B: Showing overall survival probability according to tumor subgroups (focal/tectal vs dorsally exophytic vs cervicomedullary vs diffuse intrinsic pontine glioma); C: Showing overall survival probability according to type of resection (complete/maximal vs incomplete/biopsy). OS: Overall survival.
Figure 4 Median time of survival, one and two year overall survival rates for patients.
A: Treated with radiation therapy (postoperative or radical radiation therapy); B: Treated with chemotherapy (neoadjuvant, concurrent or adjuvant/salvage). OS: Overall survival.
- Citation: Bayoumi Y, Sabbagh AJ, Mohamed R, ElShokhaiby UM, Maklad AM, Tunio MA, Balbaid AAO. Clinicopathological features and treatment outcomes of brain stem gliomas in Saudi population. World J Clin Oncol 2014; 5(5): 1060-1067
- URL: https://www.wjgnet.com/2218-4333/full/v5/i5/1060.htm
- DOI: https://dx.doi.org/10.5306/wjco.v5.i5.1060


