Copyright
©The Author(s) 2025.
World J Clin Oncol. Sep 24, 2025; 16(9): 110130
Published online Sep 24, 2025. doi: 10.5306/wjco.v16.i9.110130
Published online Sep 24, 2025. doi: 10.5306/wjco.v16.i9.110130
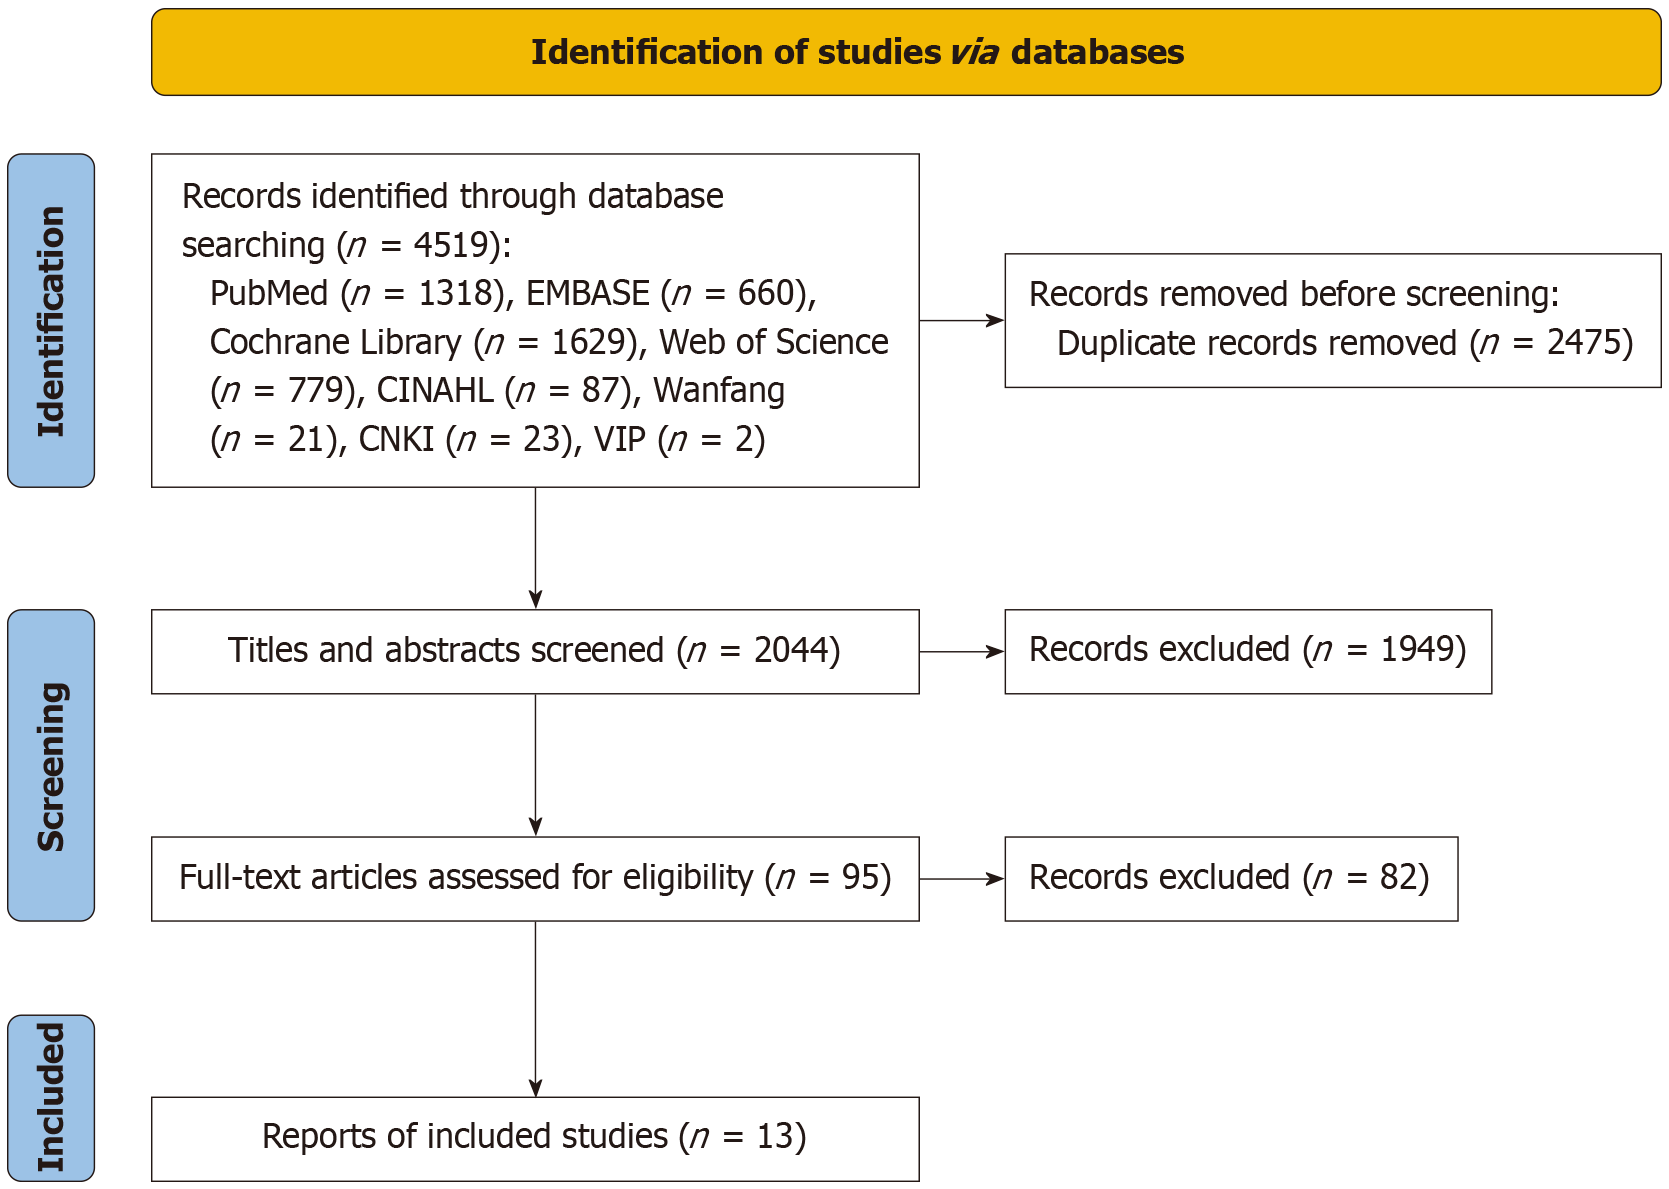
Figure 1 Literature screening flowchart.
CNKI: China National Knowledge Infrastructure; VIP: VIP Chinese Scientific Journals Database.
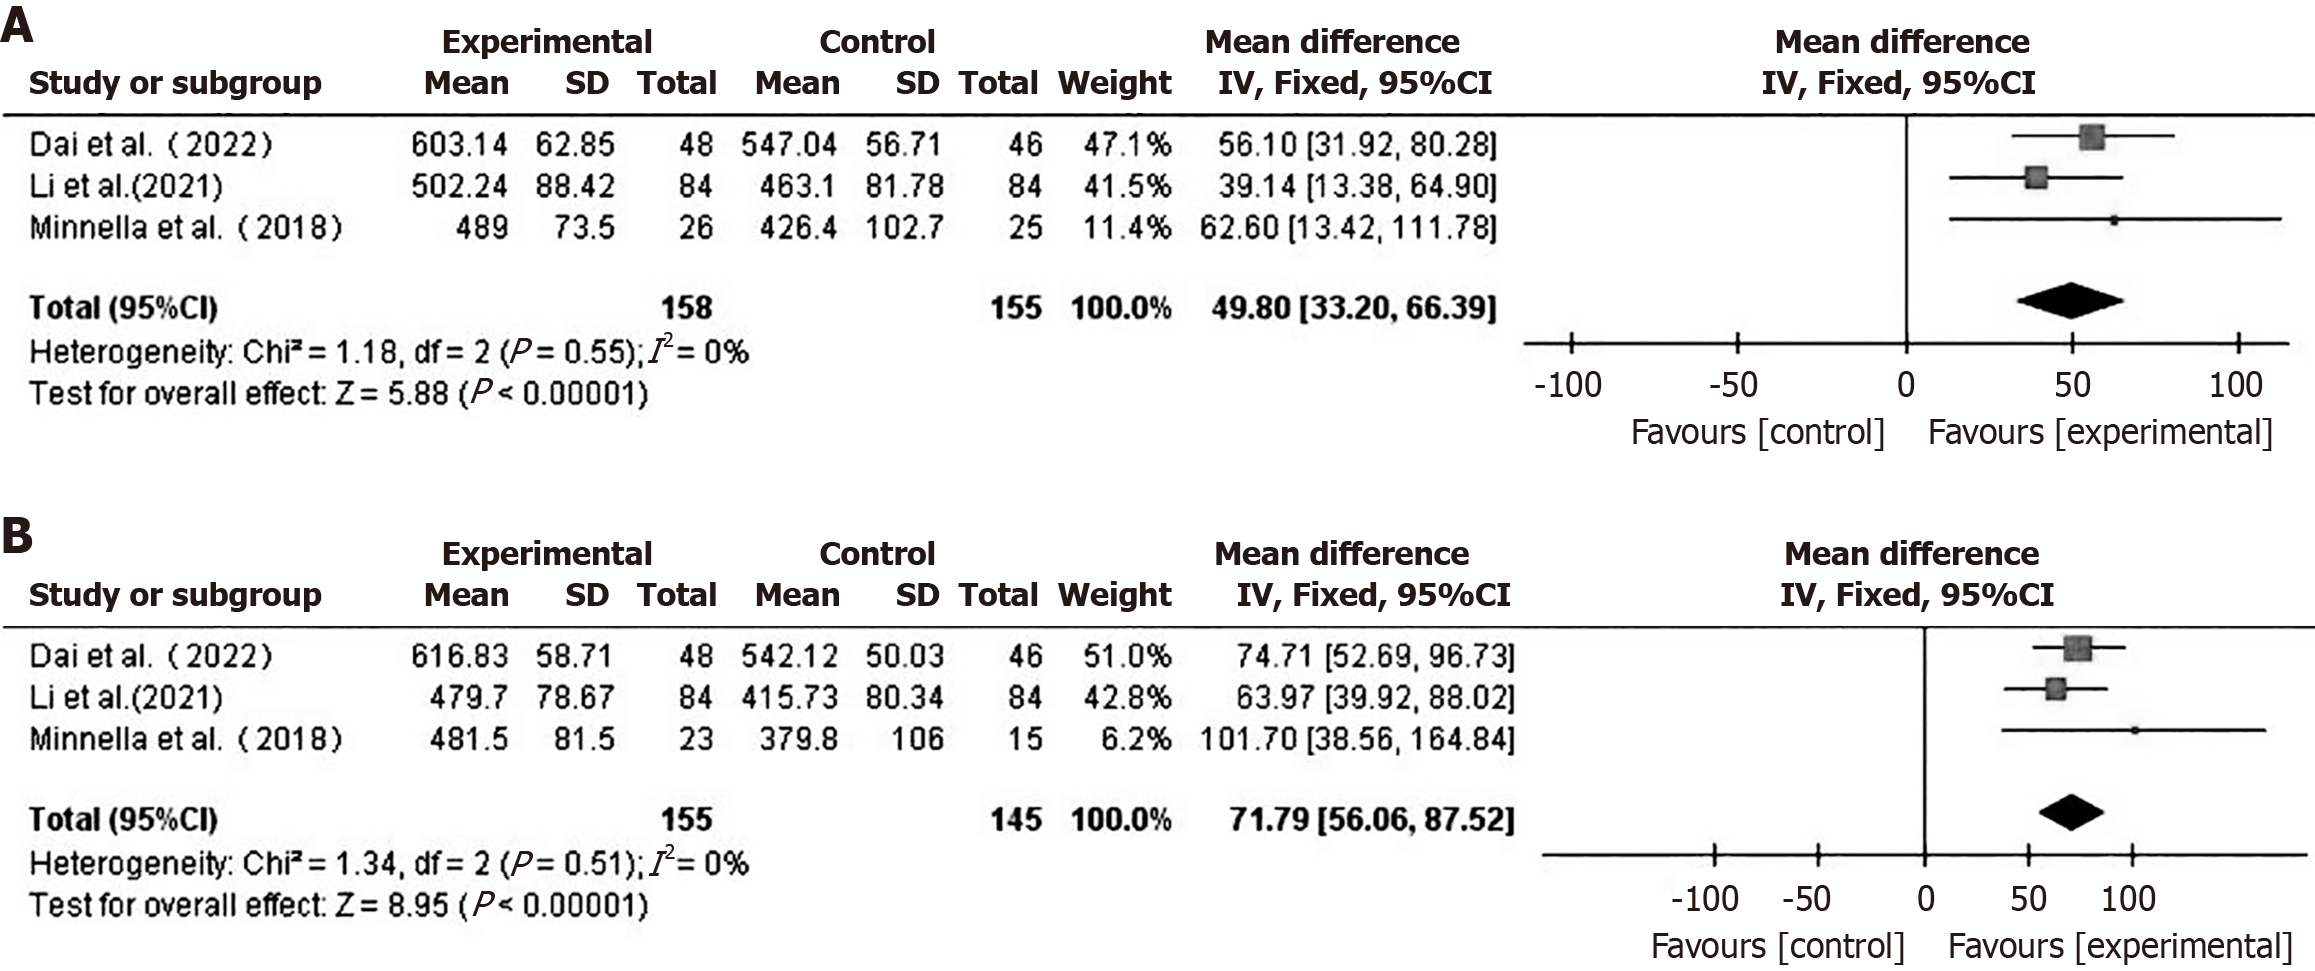
Figure 2 Forest plot comparing preoperative six-minute walk distance (A) and postoperative six-minute walk distance (B) between the two groups.
CI: Confidence interval.
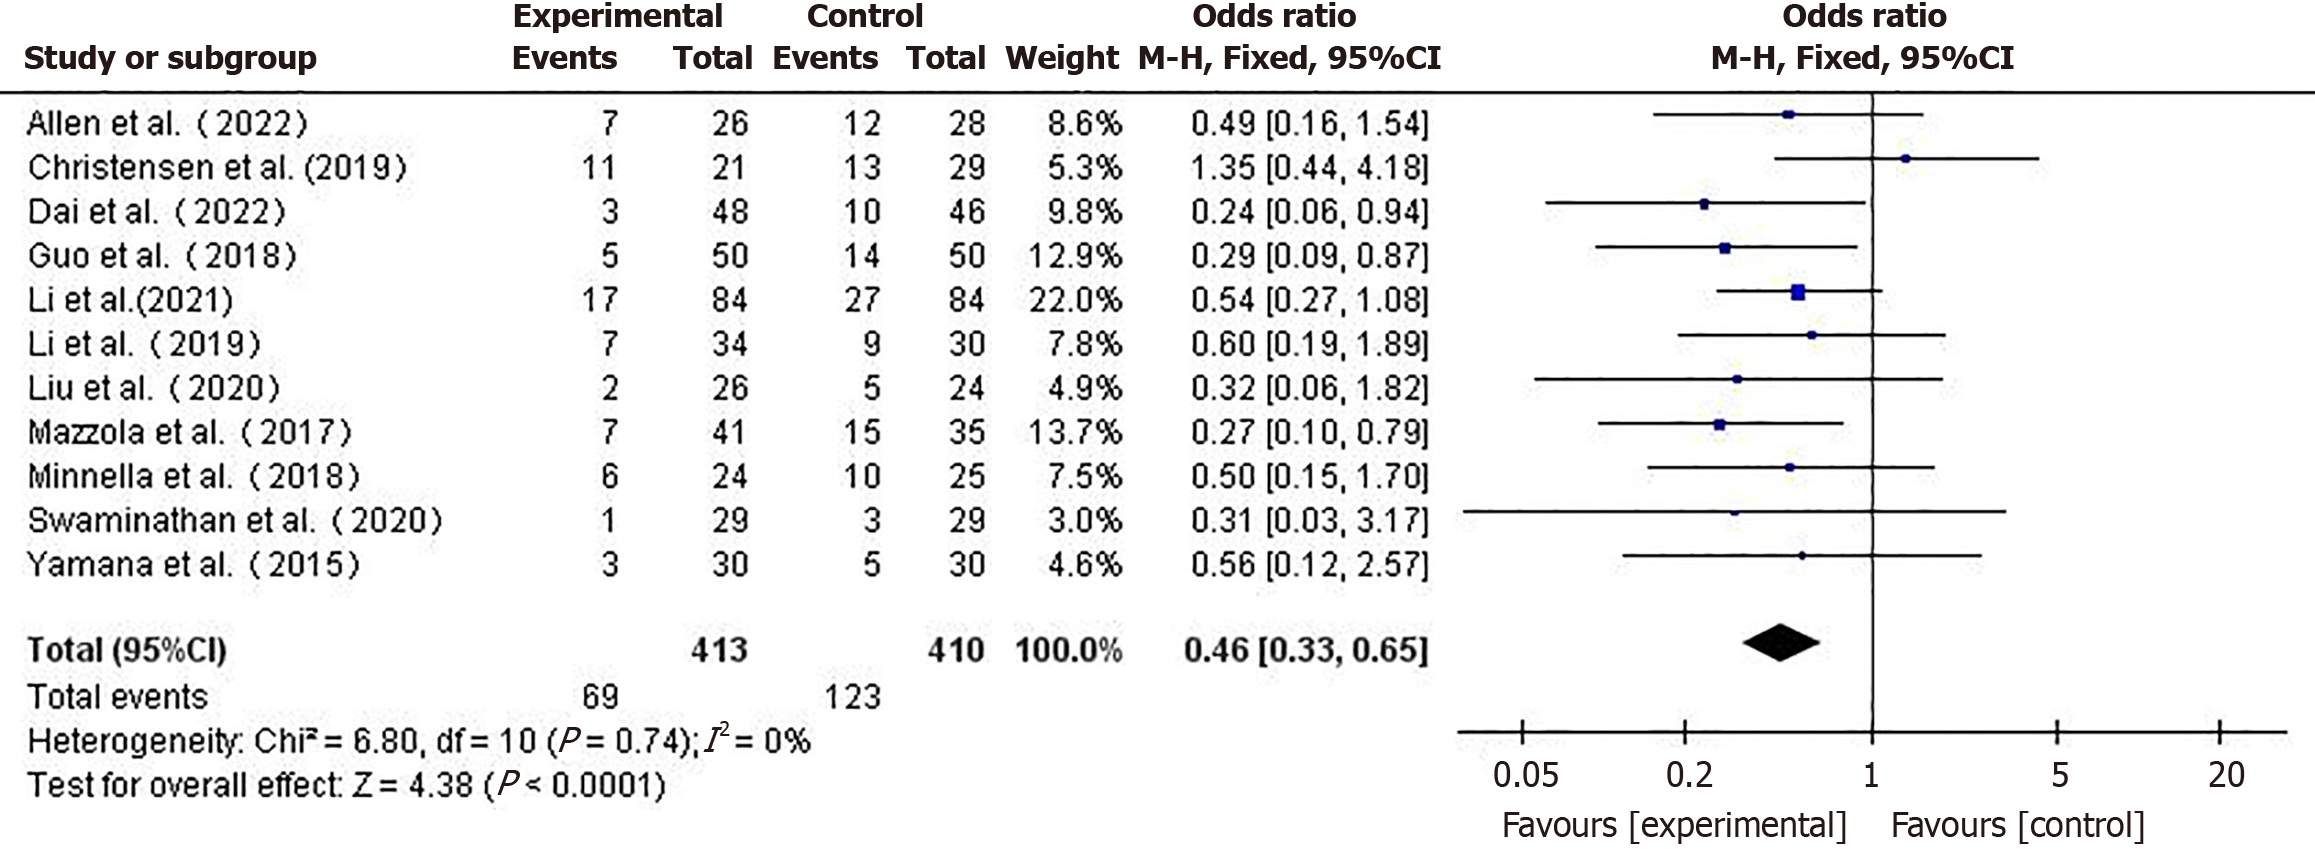
Figure 3 Forest plot comparing postoperative complication rates between the two groups.
CI: Confidence interval.
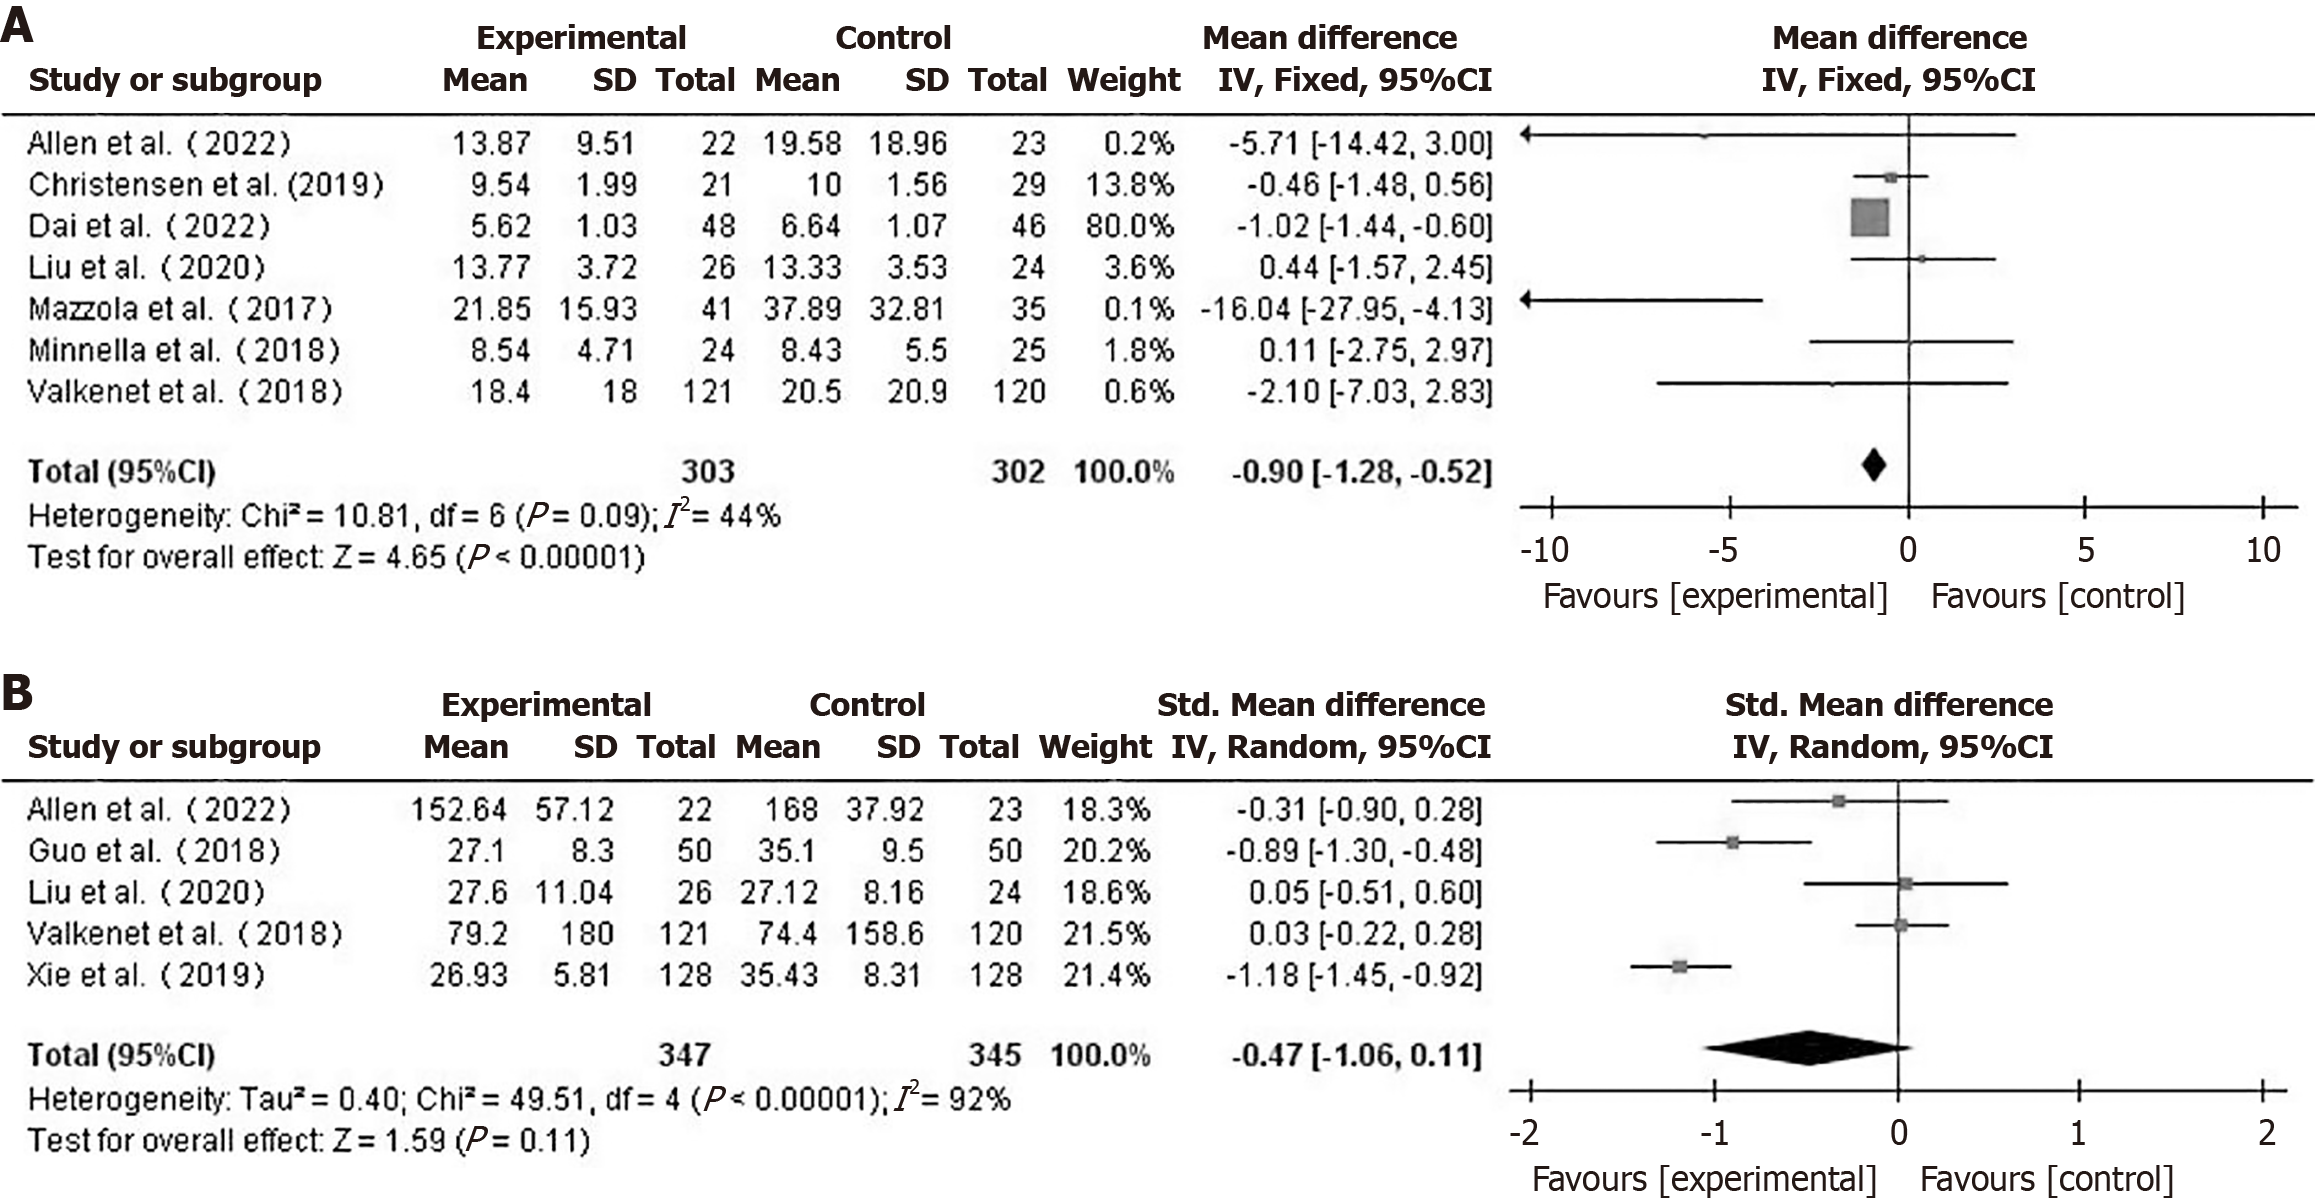
Figure 4 Forest plot comparing hospital stay durations (A) and intensive care unit care durations (B) between the two groups.
CI: Con
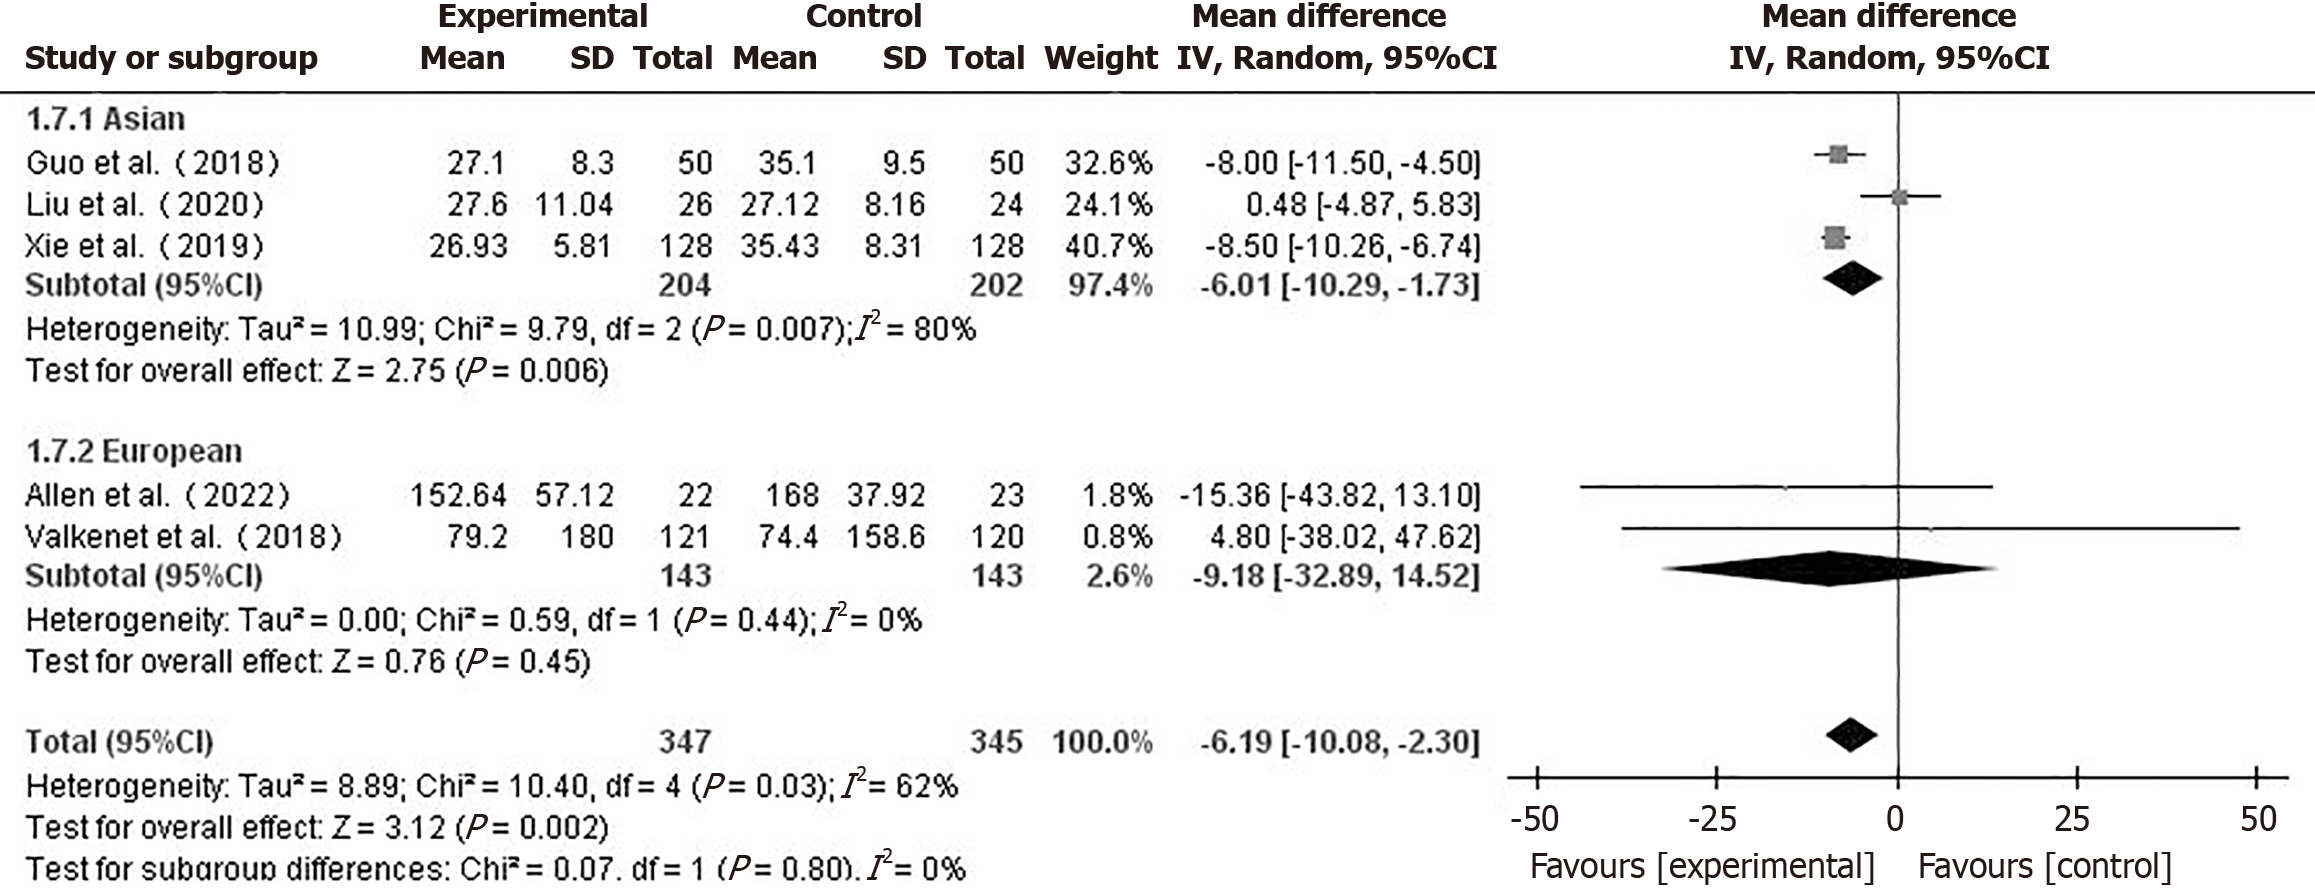
Figure 5 Forest plot for the subgroup analysis by geographic region of intensive care unit care durations between the two groups.
CI: Co
Figure 6 Forest plot comparing postoperative mortality rates between the two groups.
CI: Confidence interval.
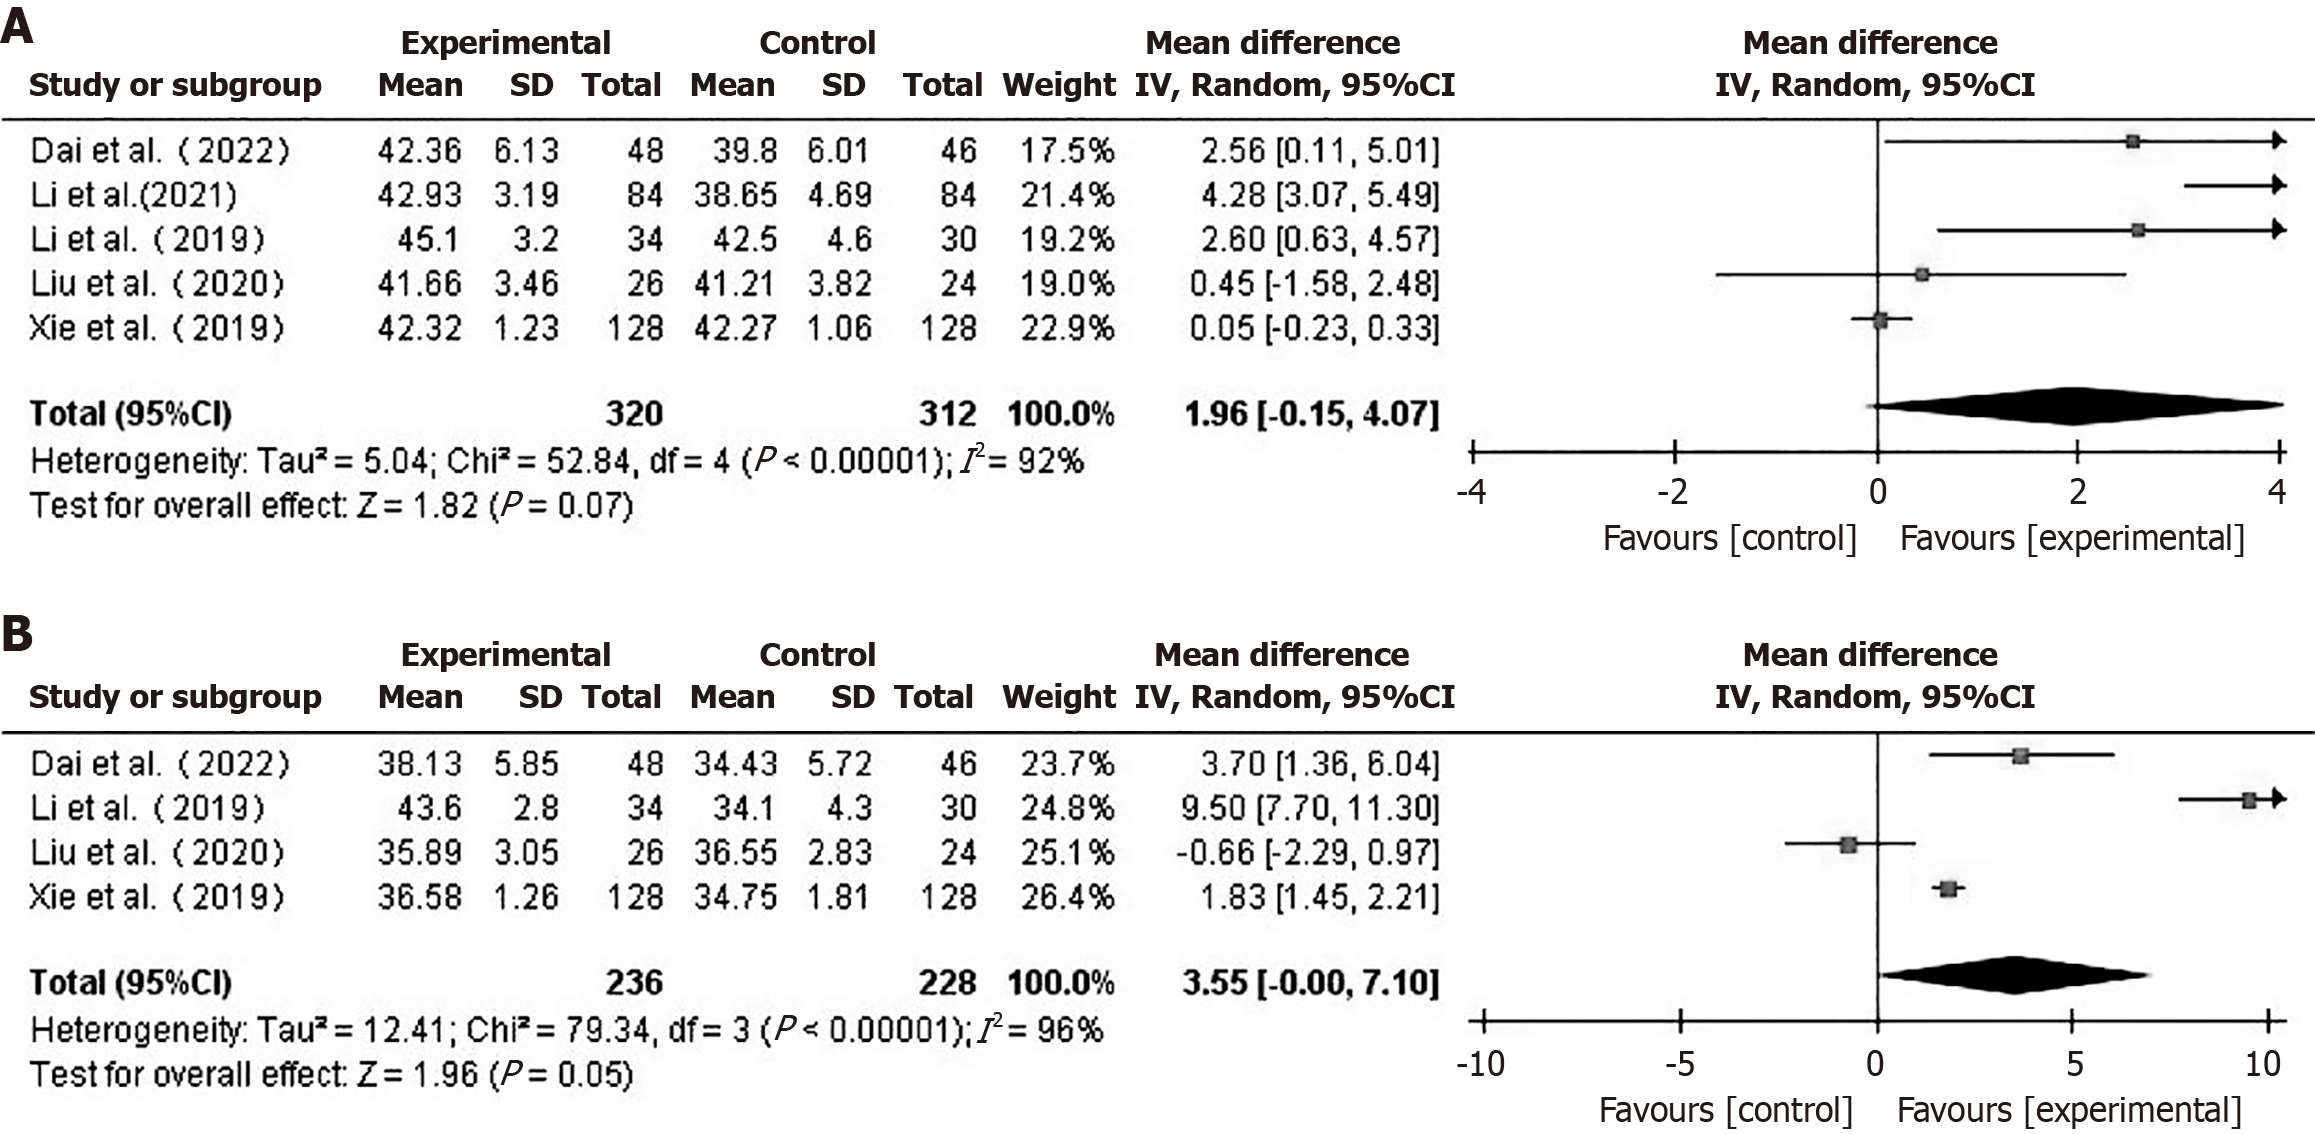
Figure 7 Forest plot comparing preoperative albumin (A) and albumin levels one week post-operatively (B) between the two groups.
CI: Confidence interval.
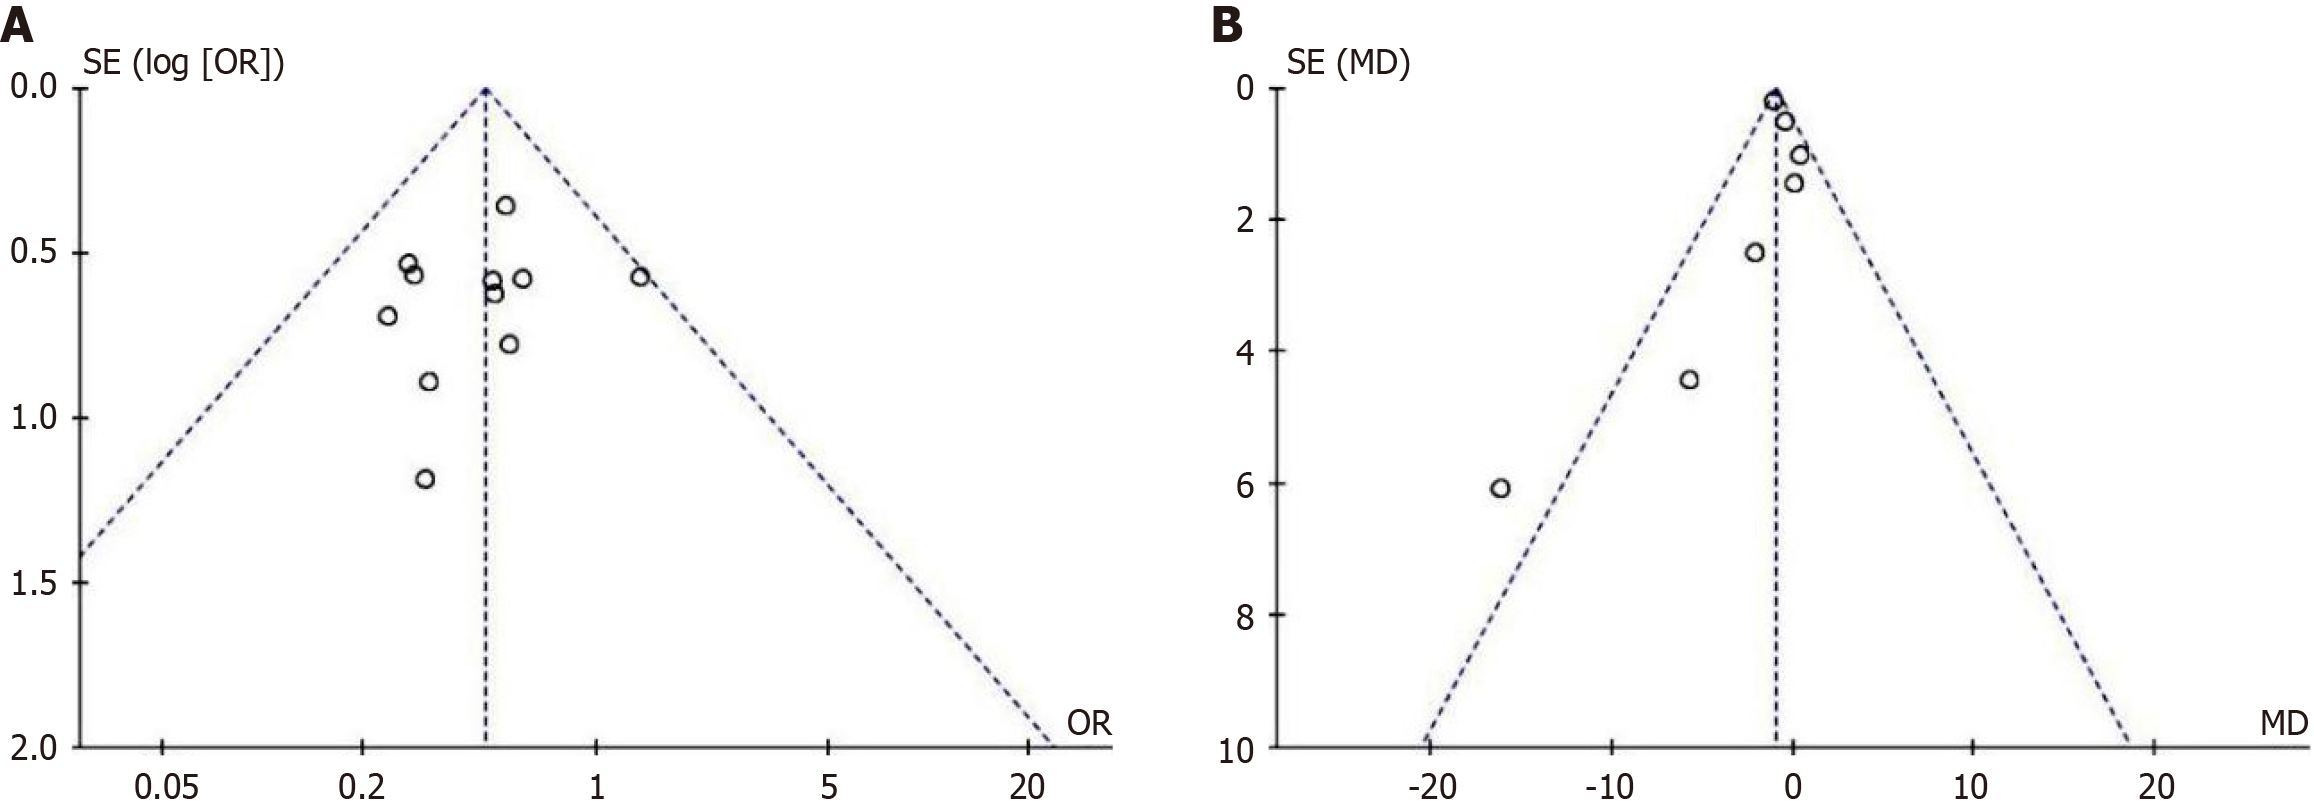
Figure 8 Publication bias test for incidence of complications and hospital stay duration.
A: Funnel plot of publication bias for the odds ratio estimates; B: Funnel plot of publication bias for the mean difference estimates. OR: Odds ratio.
- Citation: Shao X, Zhu YY, Shang B, Cai FJ, Wang XY, Zhou K, Luo CF. Meta-analysis of the impact of prehabilitation on patients undergoing upper gastrointestinal tract tumor surgery. World J Clin Oncol 2025; 16(9): 110130
- URL: https://www.wjgnet.com/2218-4333/full/v16/i9/110130.htm
- DOI: https://dx.doi.org/10.5306/wjco.v16.i9.110130


