©The Author(s) 2025.
World J Clin Oncol. Feb 24, 2025; 16(2): 99839
Published online Feb 24, 2025. doi: 10.5306/wjco.v16.i2.99839
Published online Feb 24, 2025. doi: 10.5306/wjco.v16.i2.99839
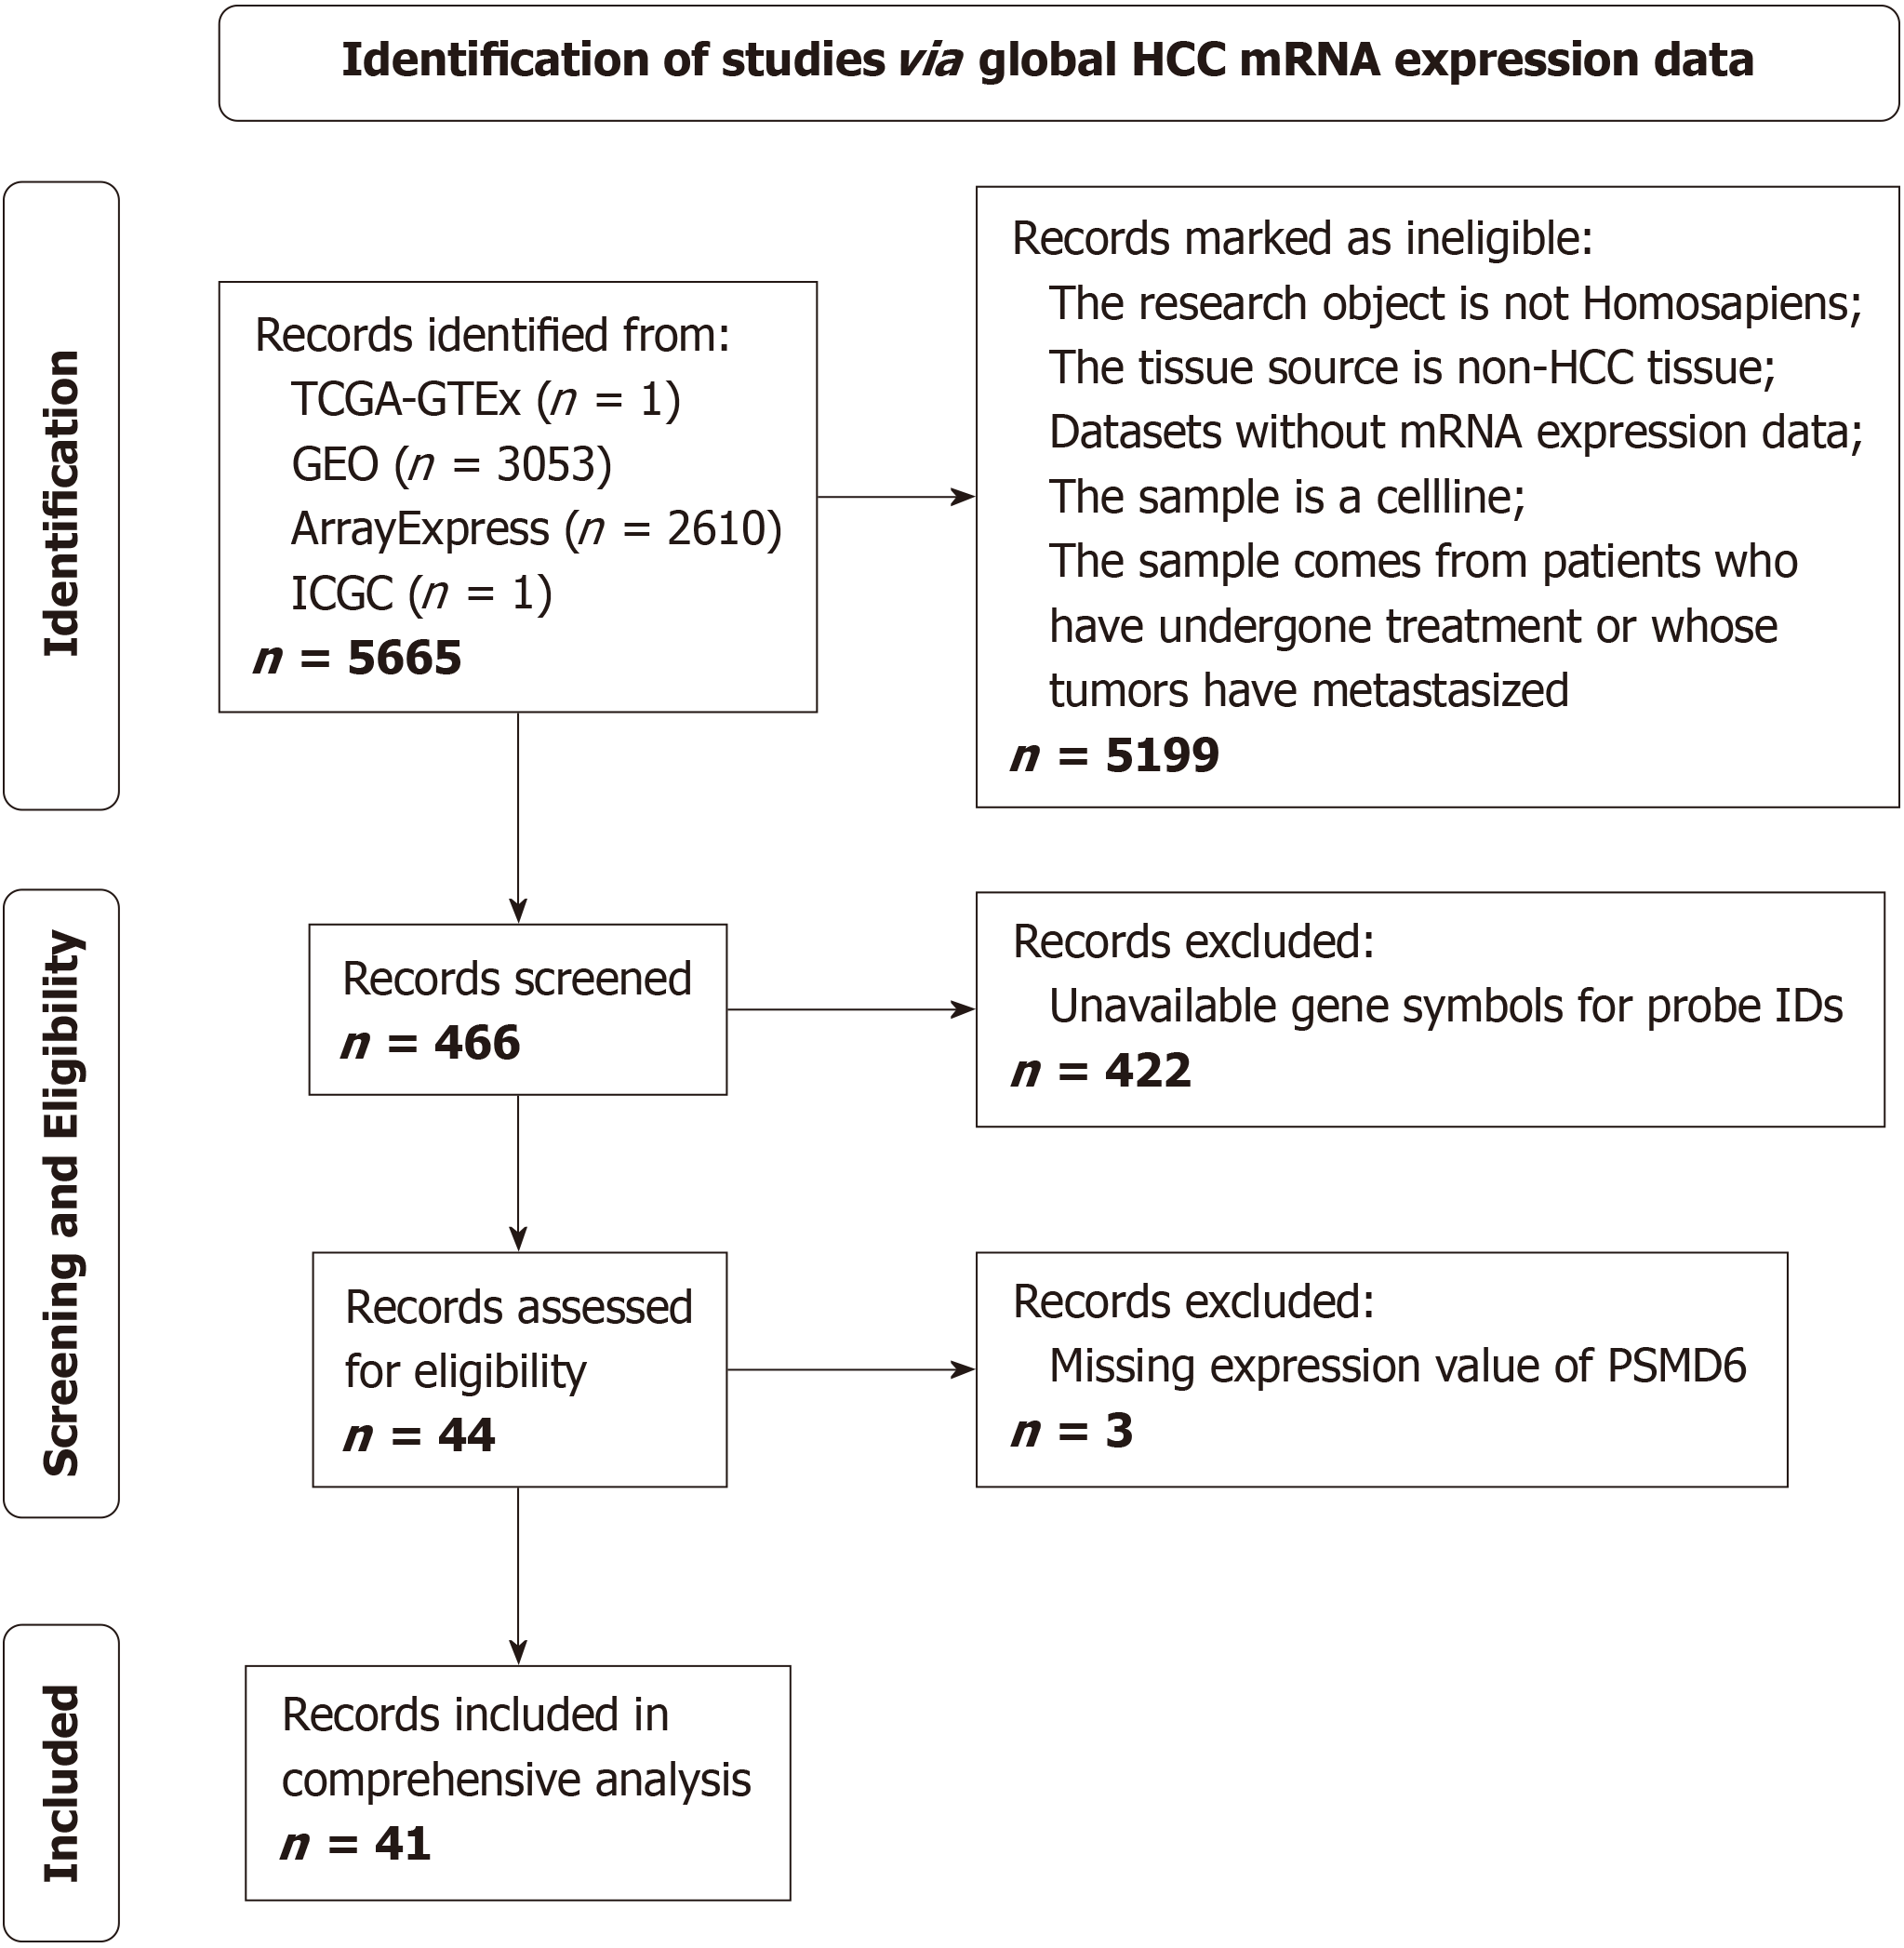
Figure 1 Flowchart for the collection of proteasome 26S subunit non-ATPase 6 bulk RNA-Sequencing datasets from hepatocellular carcinoma tissues.
HCC: Hepatocellular carcinoma; TCGA: The Cancer Genome Atlas; GTEx: Genotype-Tissue Expression; GEO: Gene Expression Omnibus; ICGA: International Cancer Genome Consortium; PSMD6: Proteasome 26S subunit non-ATPase 6.
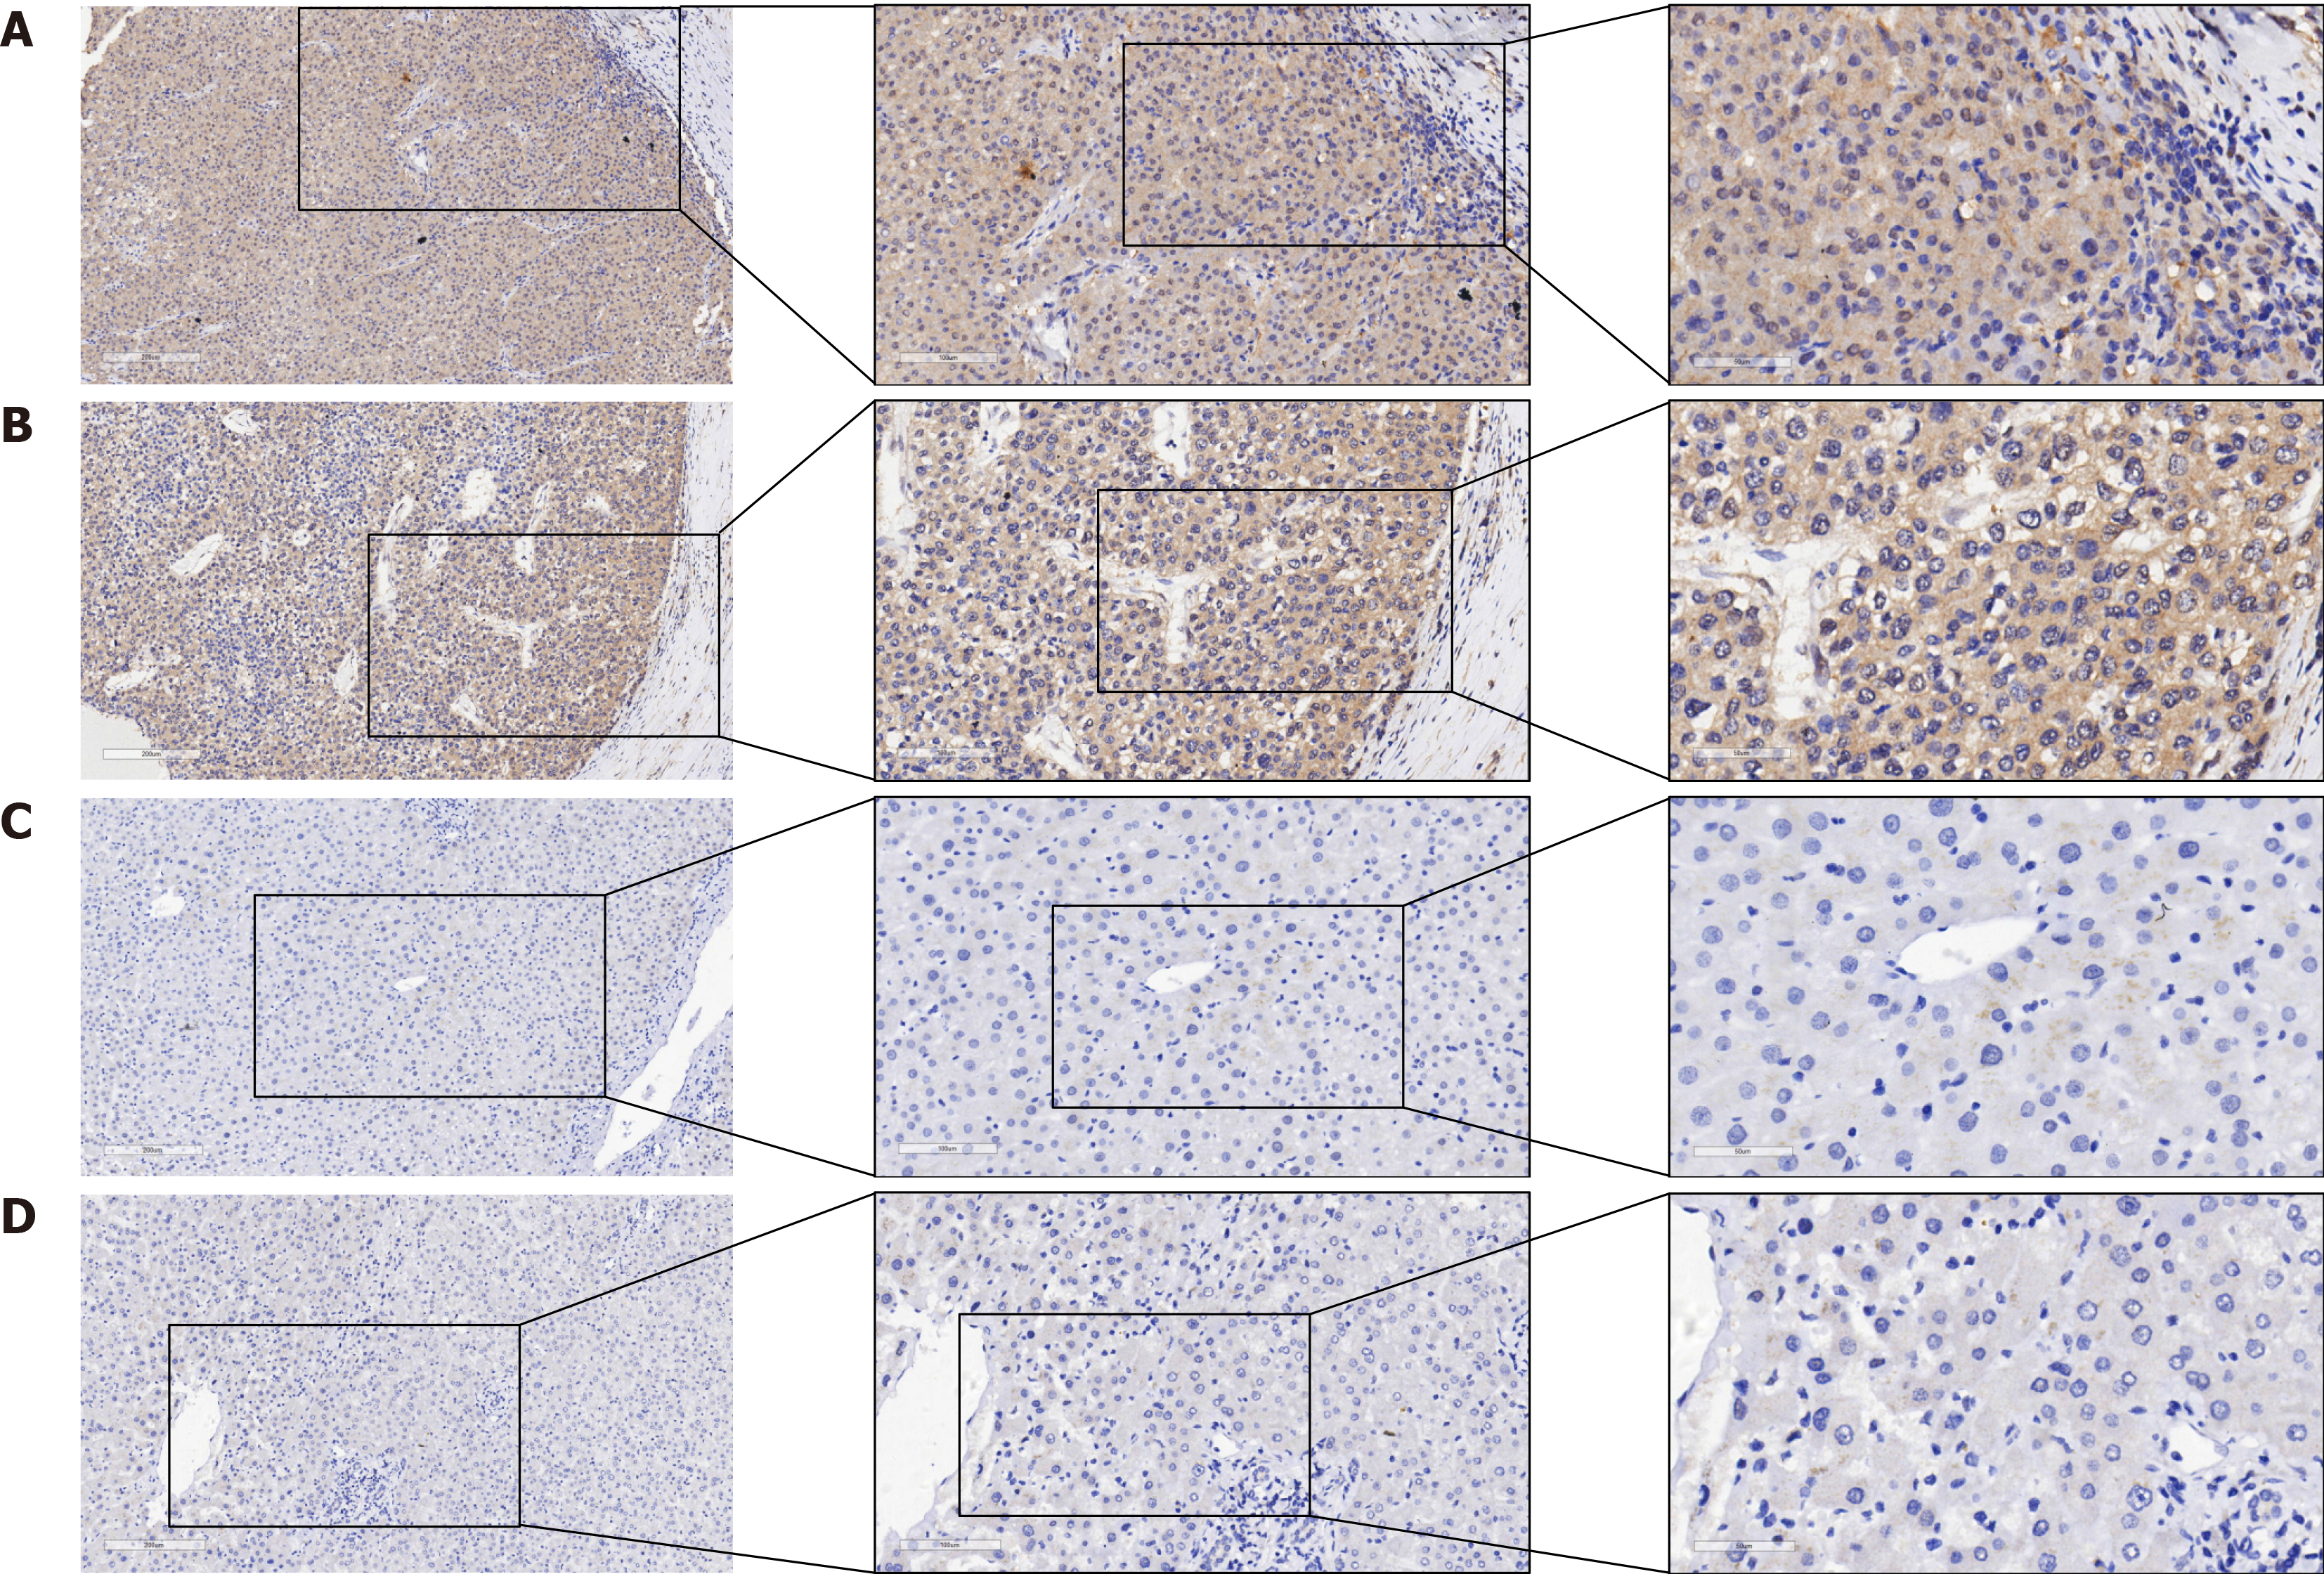
Figure 2 Qualitative evaluation of proteasome 26S subunit non-ATPase 6 protein expression in hepatocellular carcinoma and non-hepatocellular carcinoma tissues.
A and B: Hepatocellular carcinoma (HCC) tissue; C and D: Non-HCC tissue.
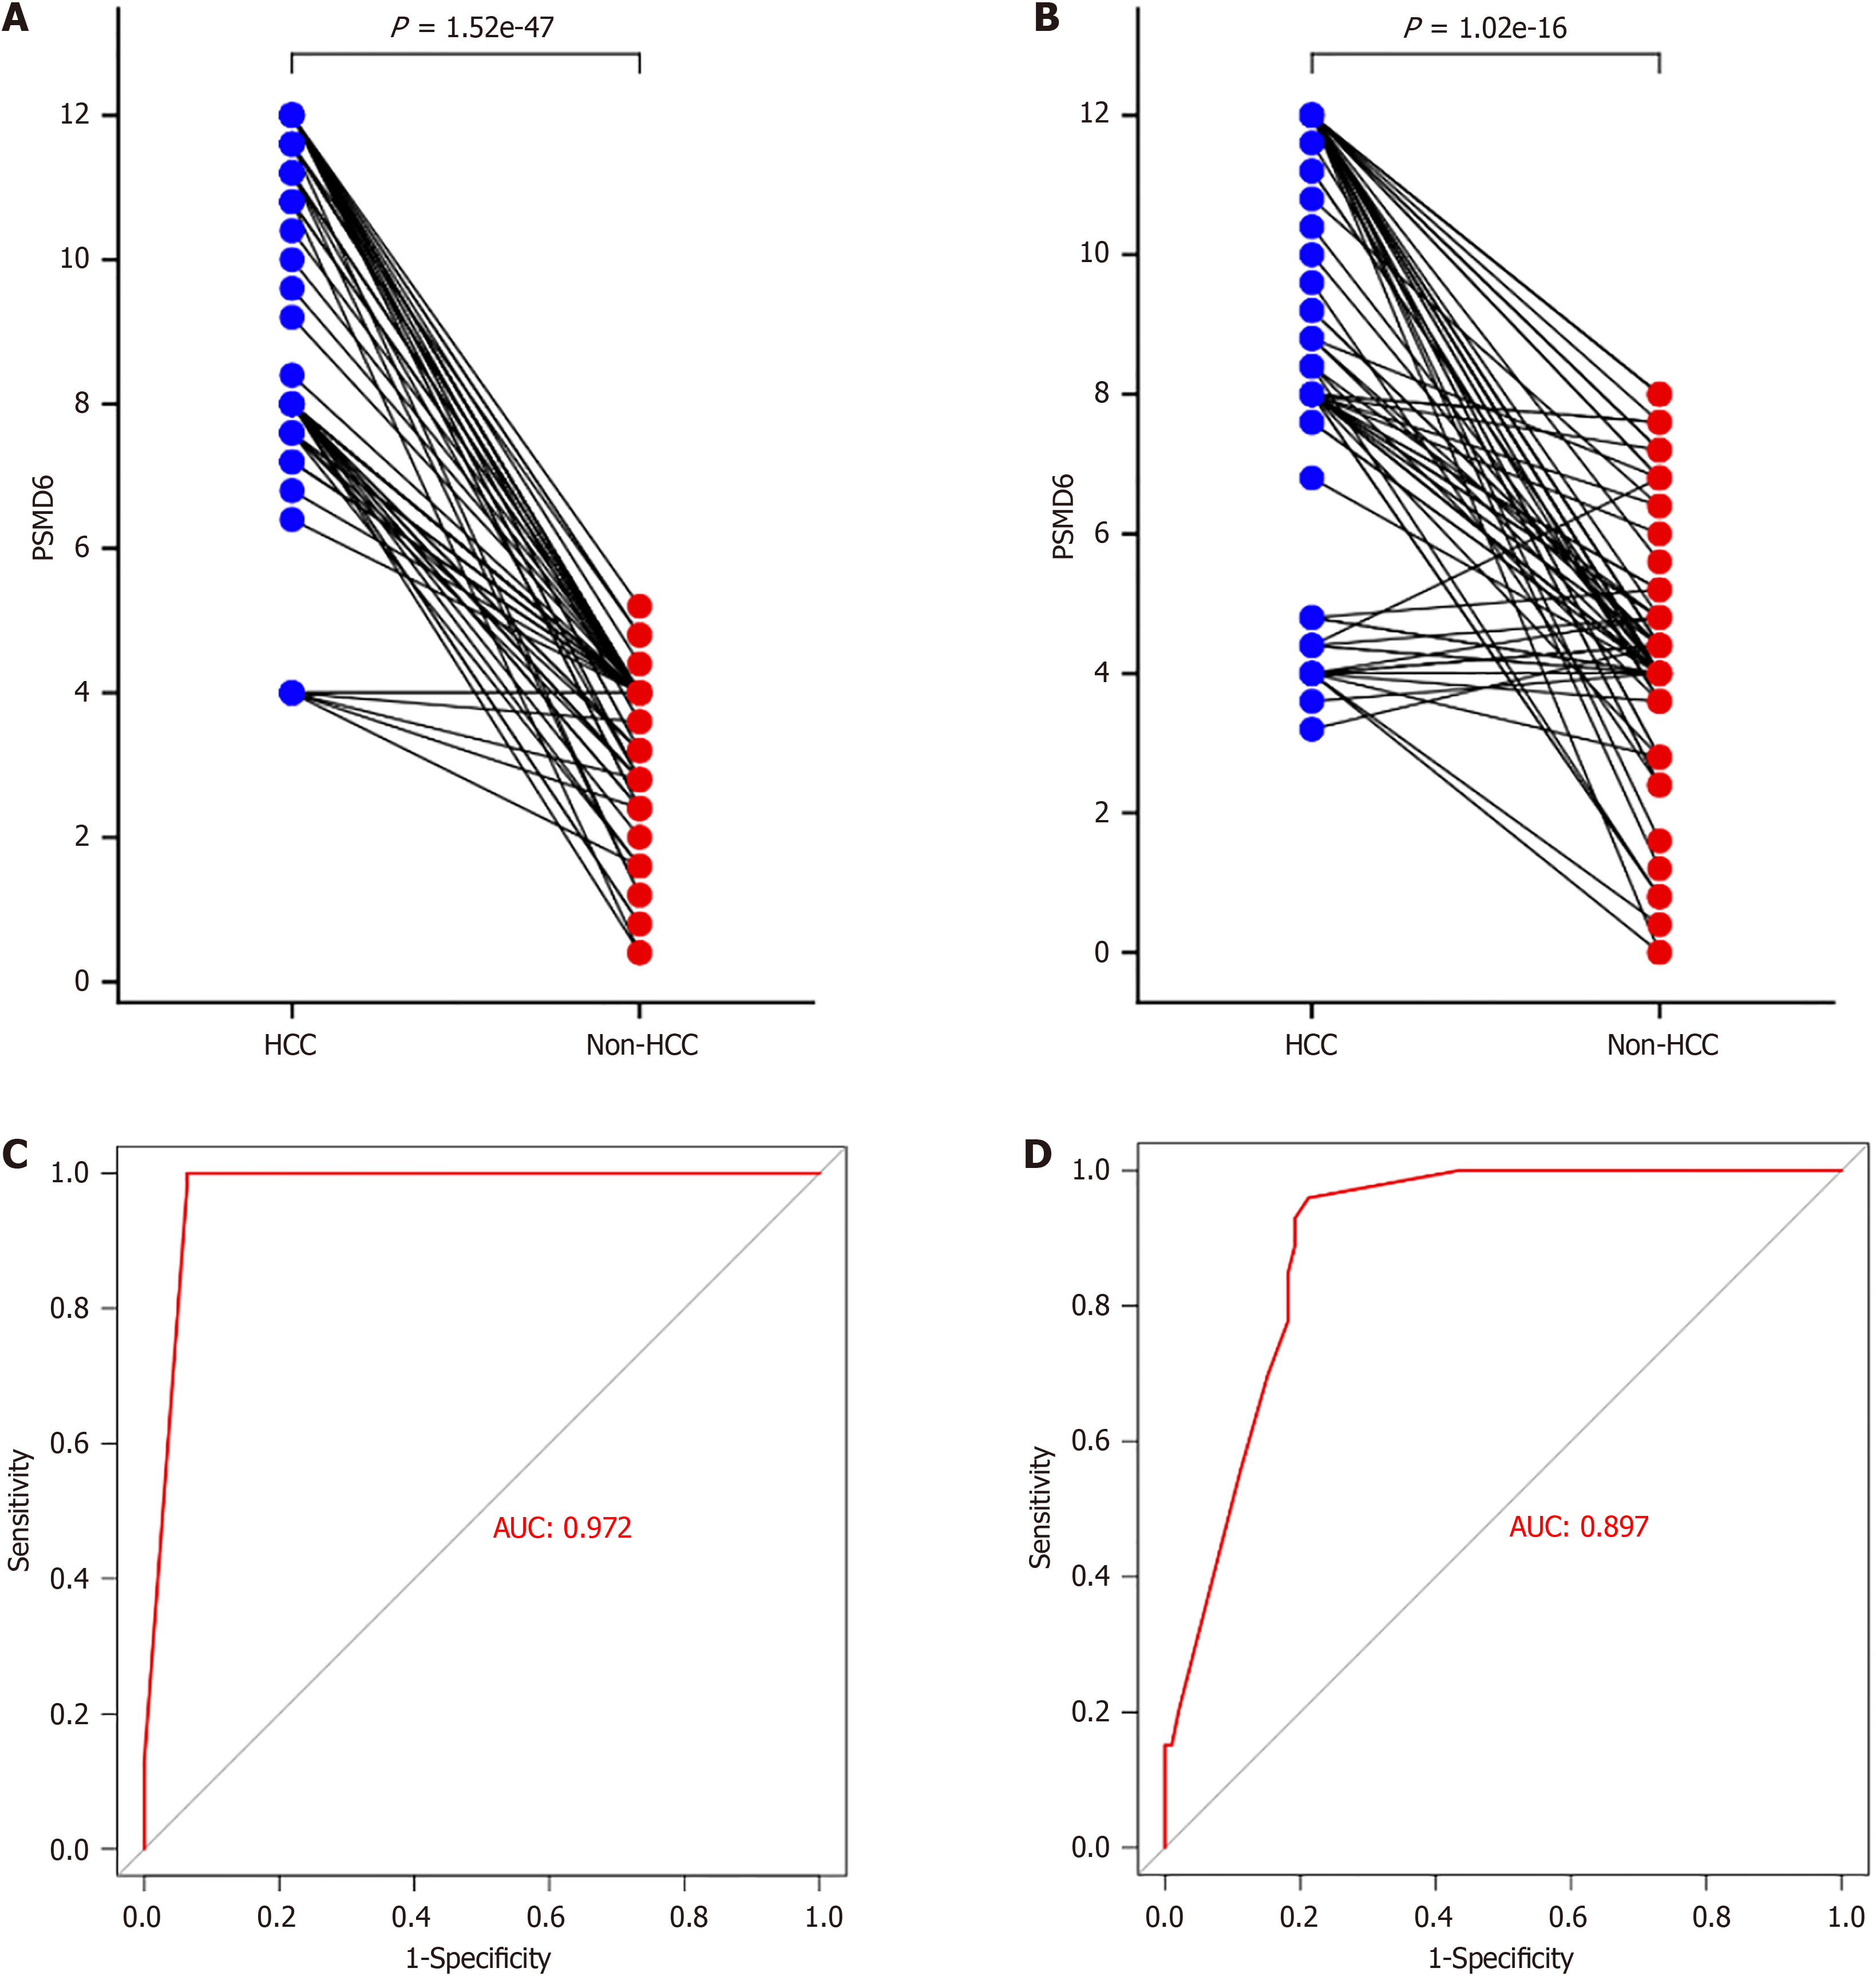
Figure 3 Semi-quantitative evaluation of proteasome 26S subunit non-ATPase 6 protein expression in hepatocellular carcinoma and non-hepatocellular carcinoma tissues.
A and B: Semi-quantitative comparison of proteasome 26S subunit non-ATPase 6 (PSMD6) protein expression levels between HCC tissues and non-HCC tissues from institutions; C and D: Evaluation of the ability of highly expressed PSMD6 from institutions A and B to identify HCC tissues. HCC: Hepatocellular carcinoma; PSMD6: Proteasome 26S subunit non-ATPase 6.
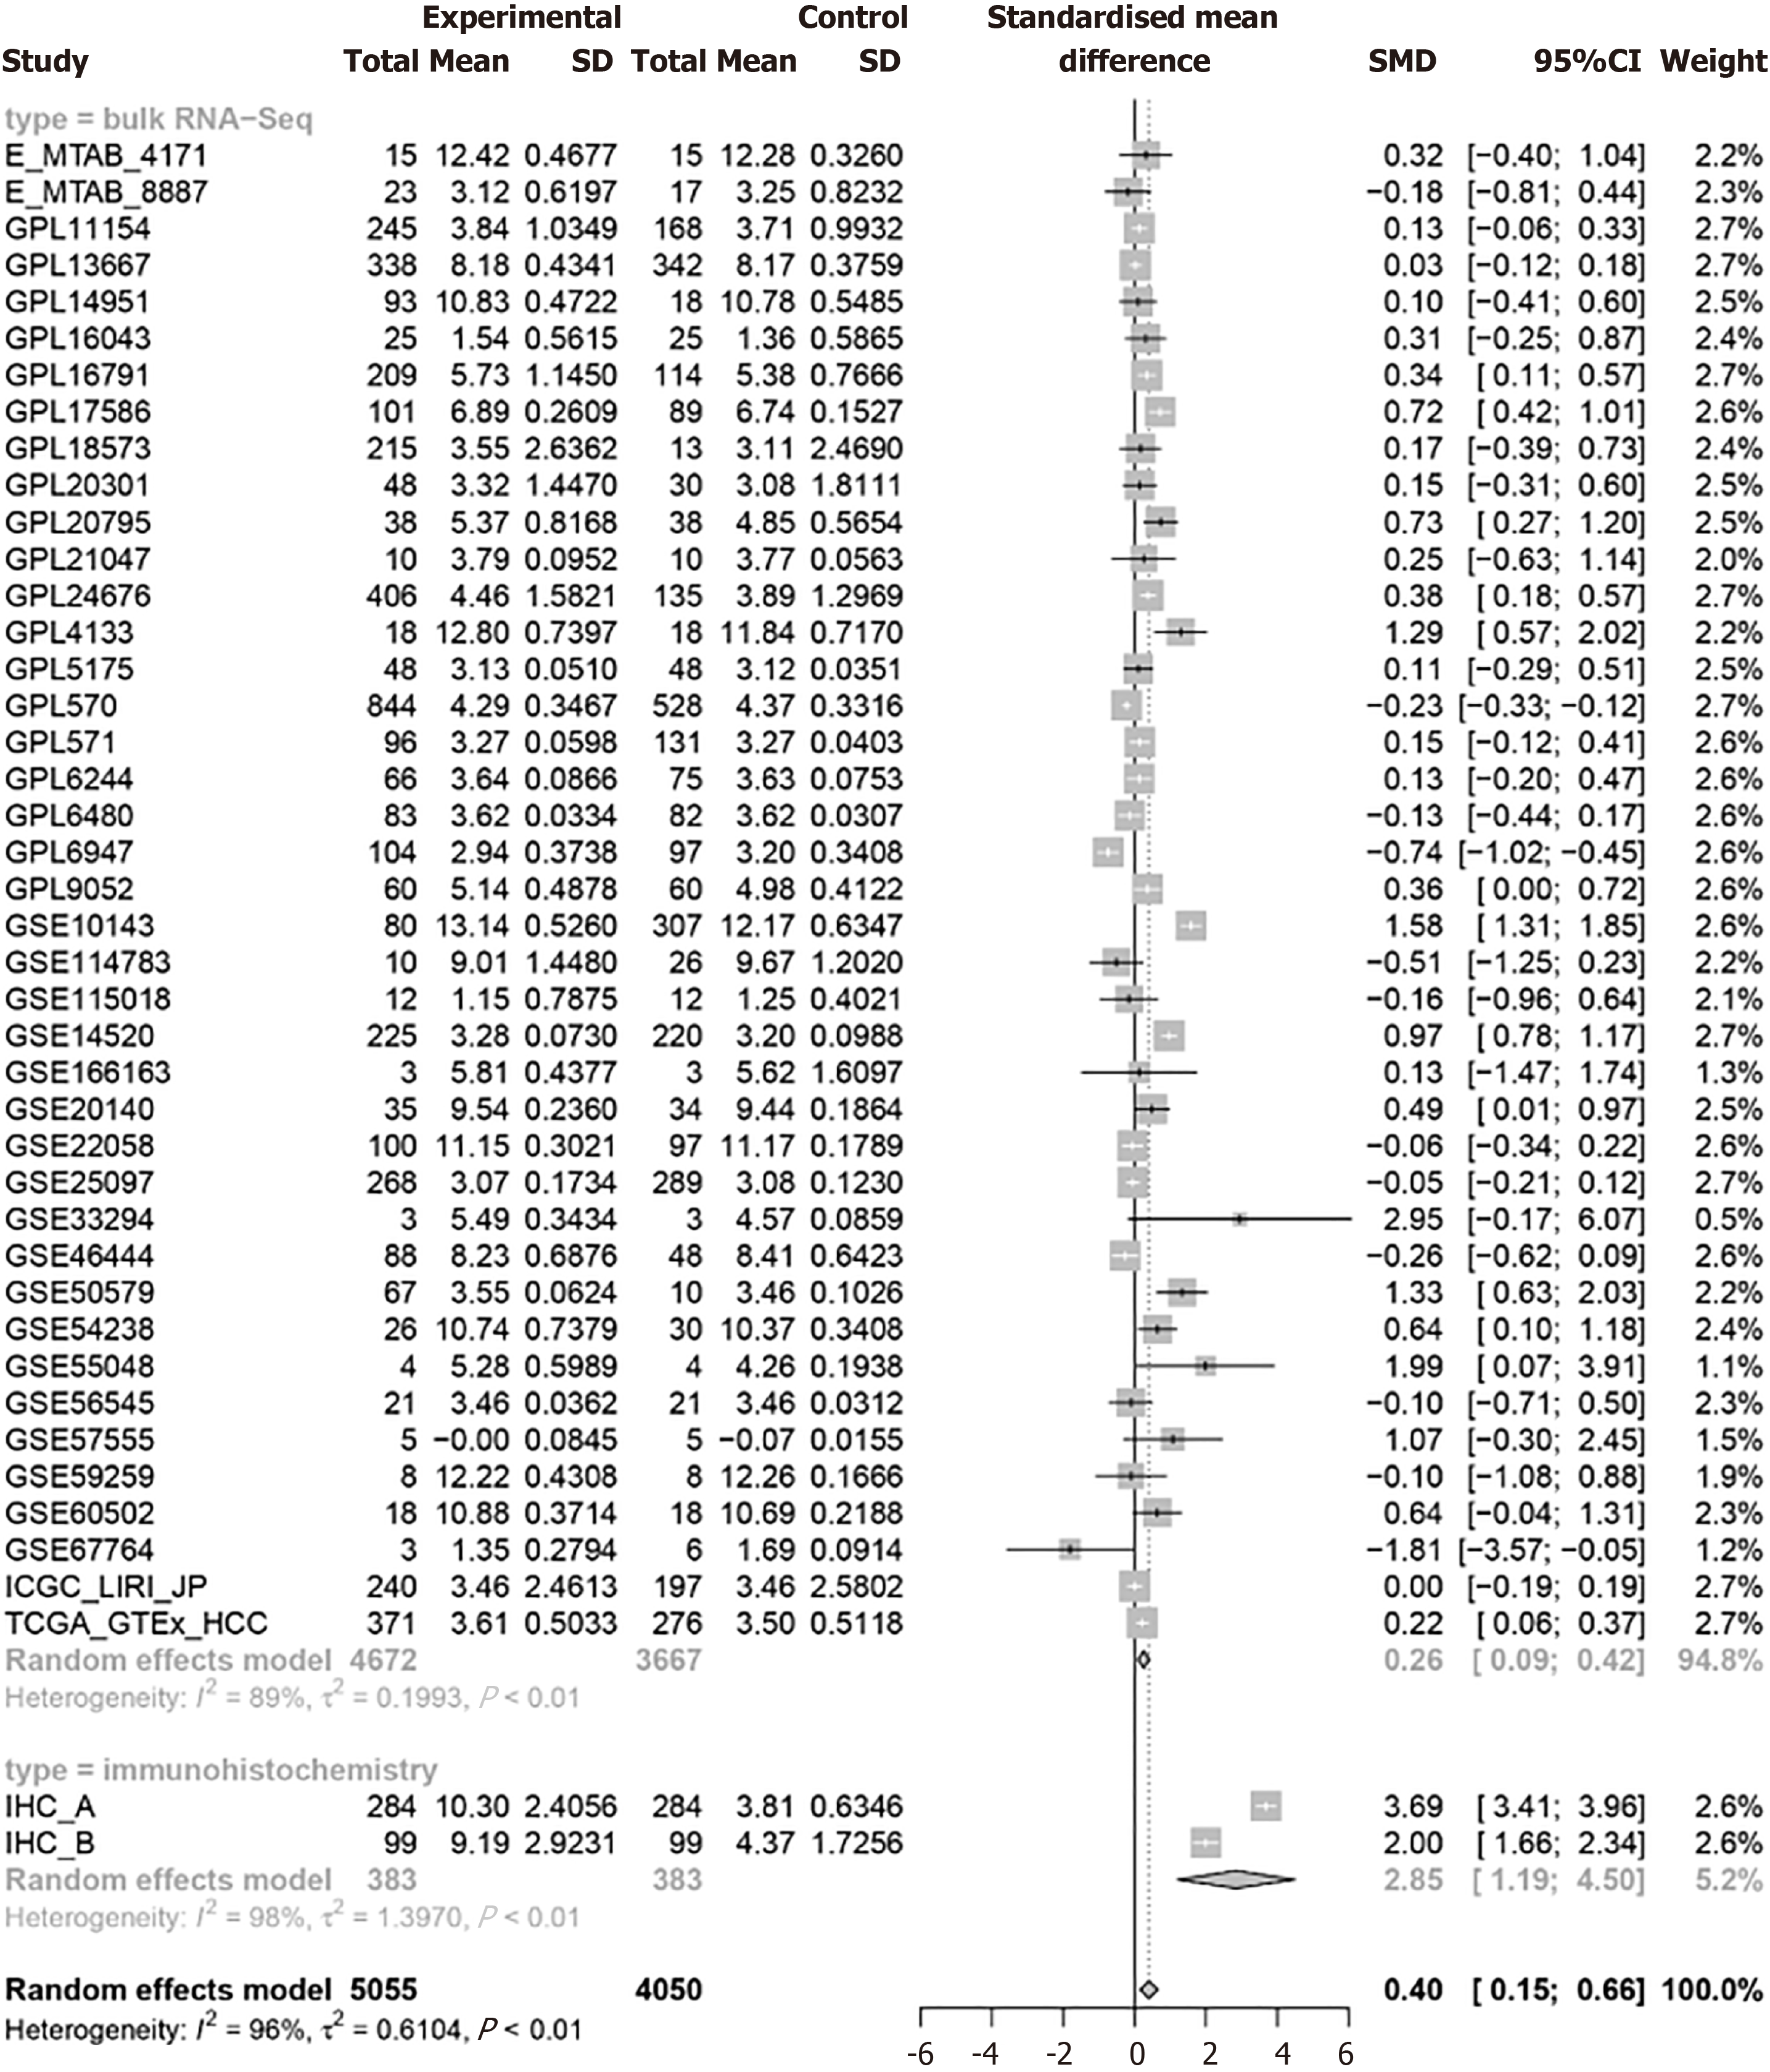
Figure 4 Proteasome 26S subunit non-ATPase 6 mRNA and protein have significant overexpression patterns in hepatocellular carcinoma tissues.
SMD: Standardised mean difference.
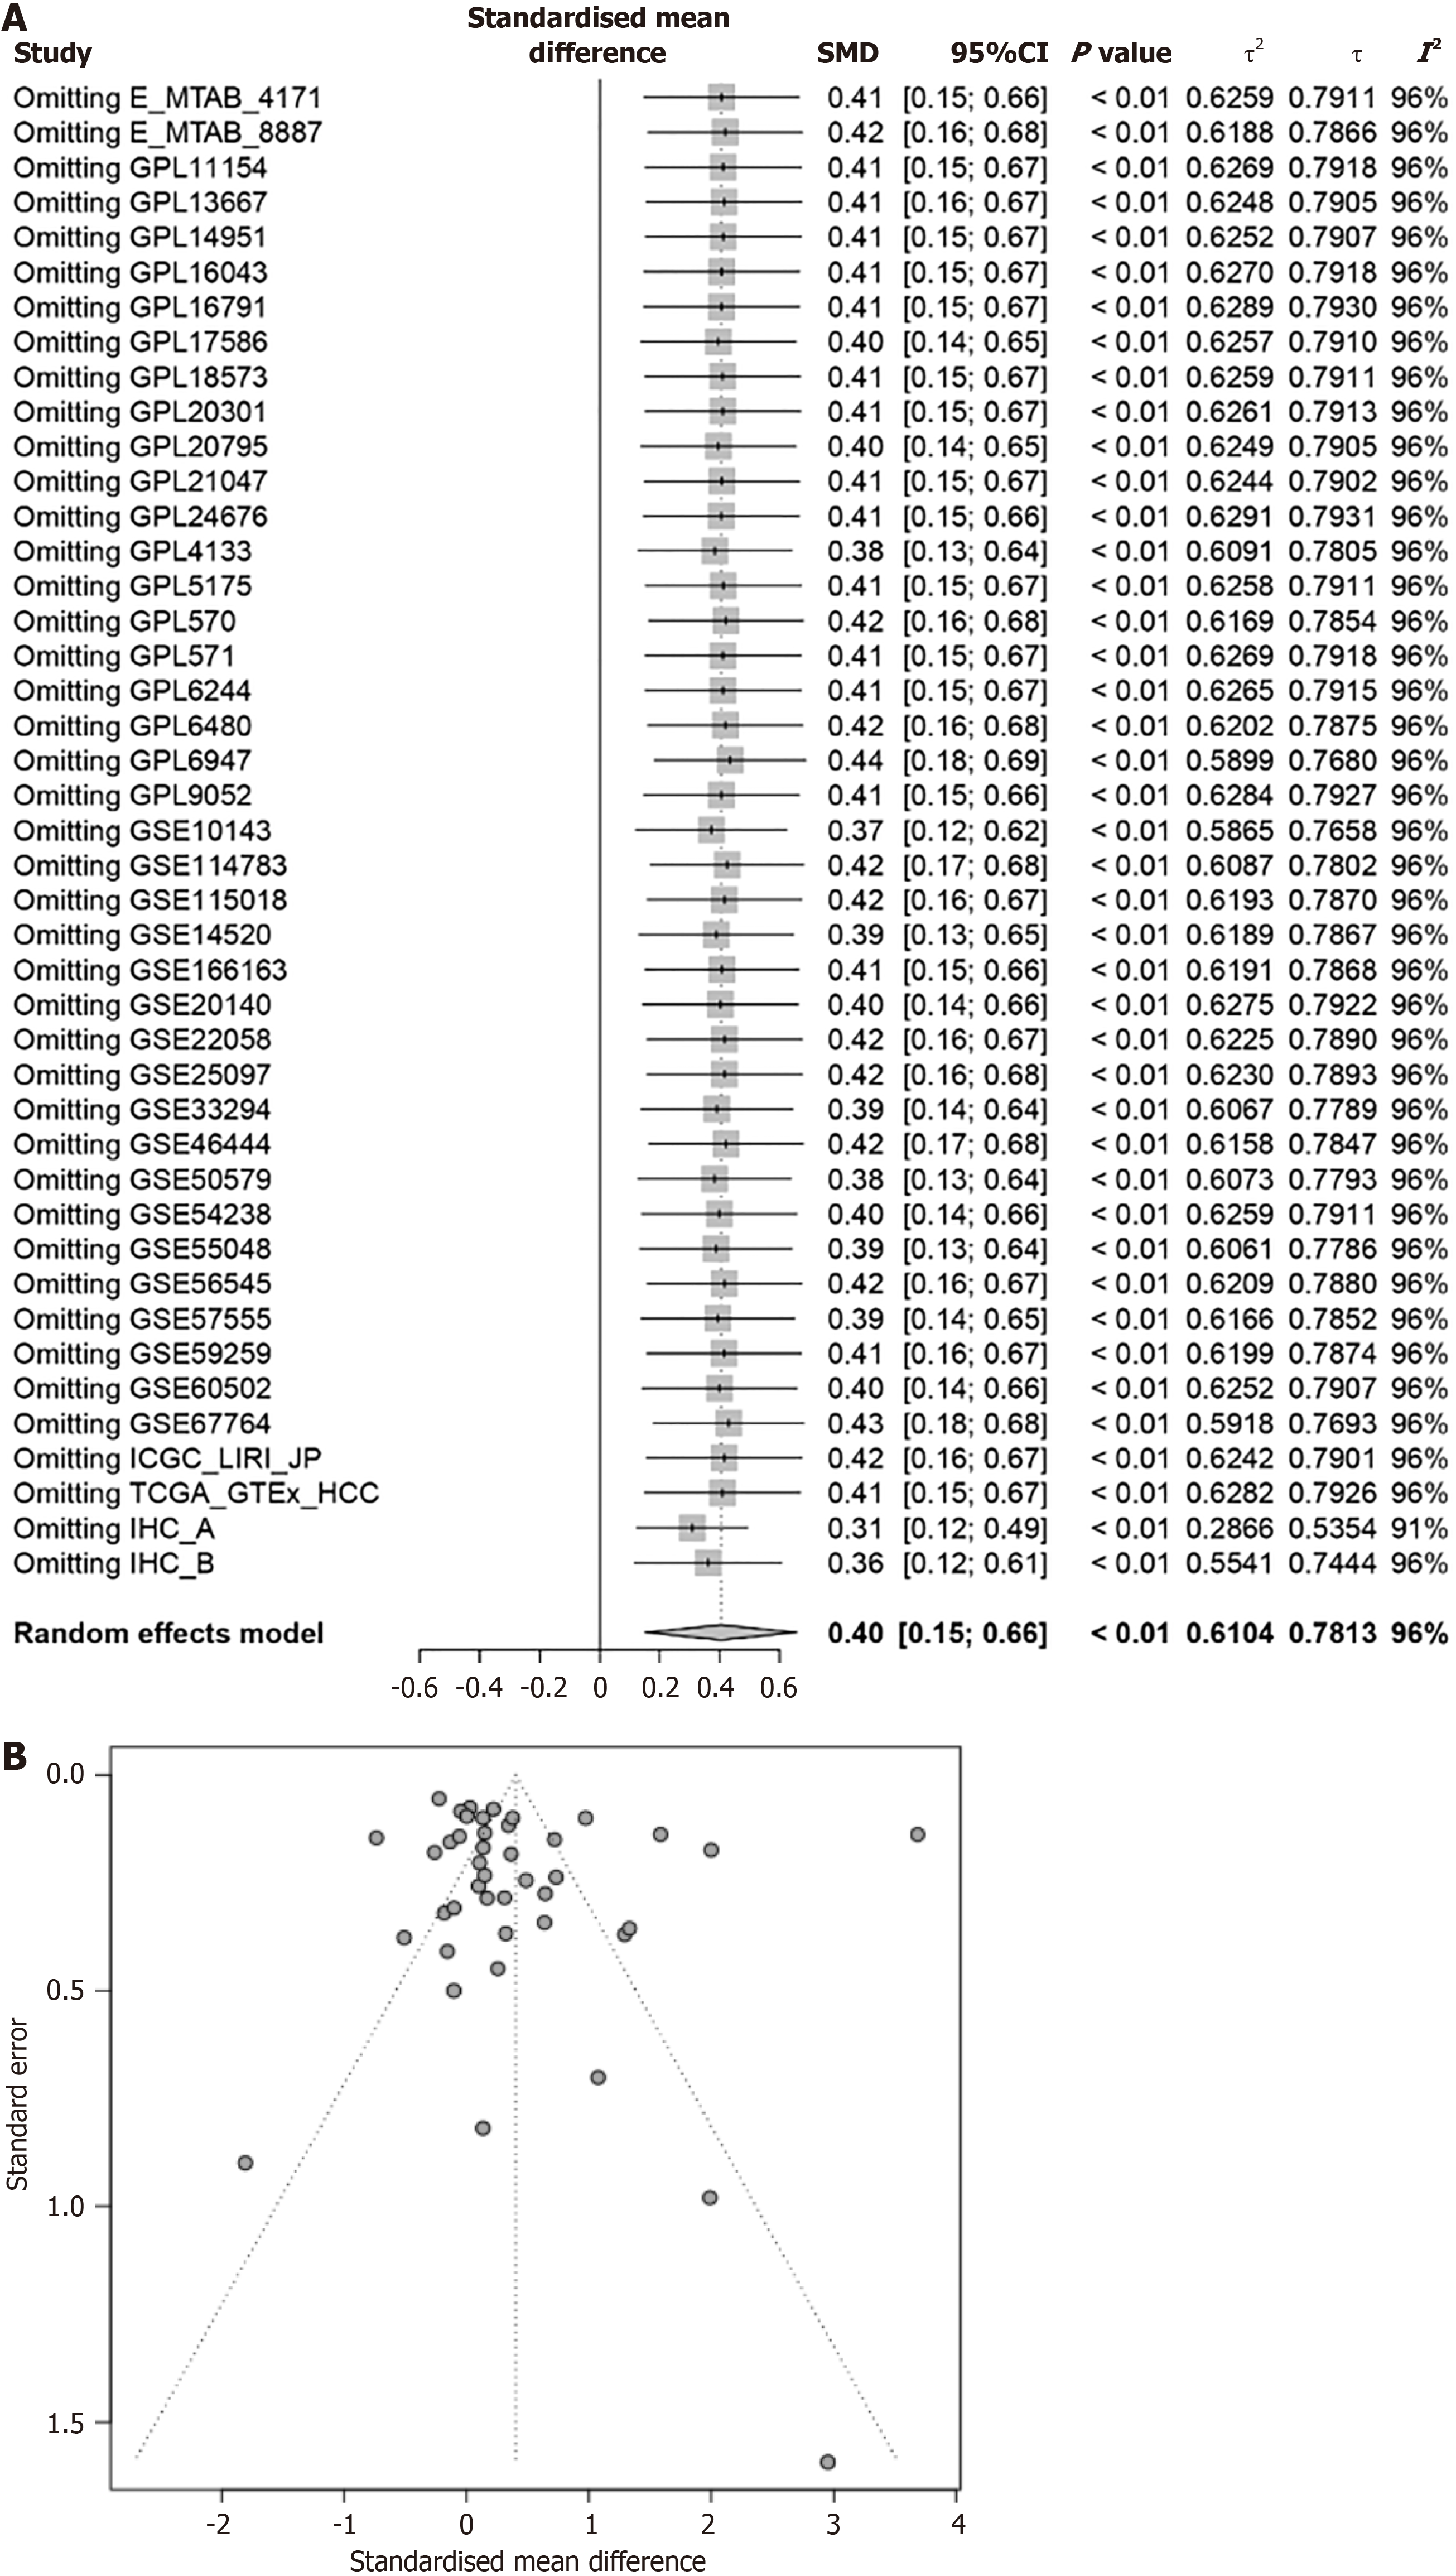
Figure 5 Proteasome 26S subunit non-ATPase 6 standardised mean difference reliability test.
A: Forest plot of sensitivity analysis of proteasome 26S subunit non-ATPase 6 (PSMD6) standardised mean difference (SMD); B: Funnel plot of publication bias test of PSMD6 SMD. SMD: Standardised mean difference.
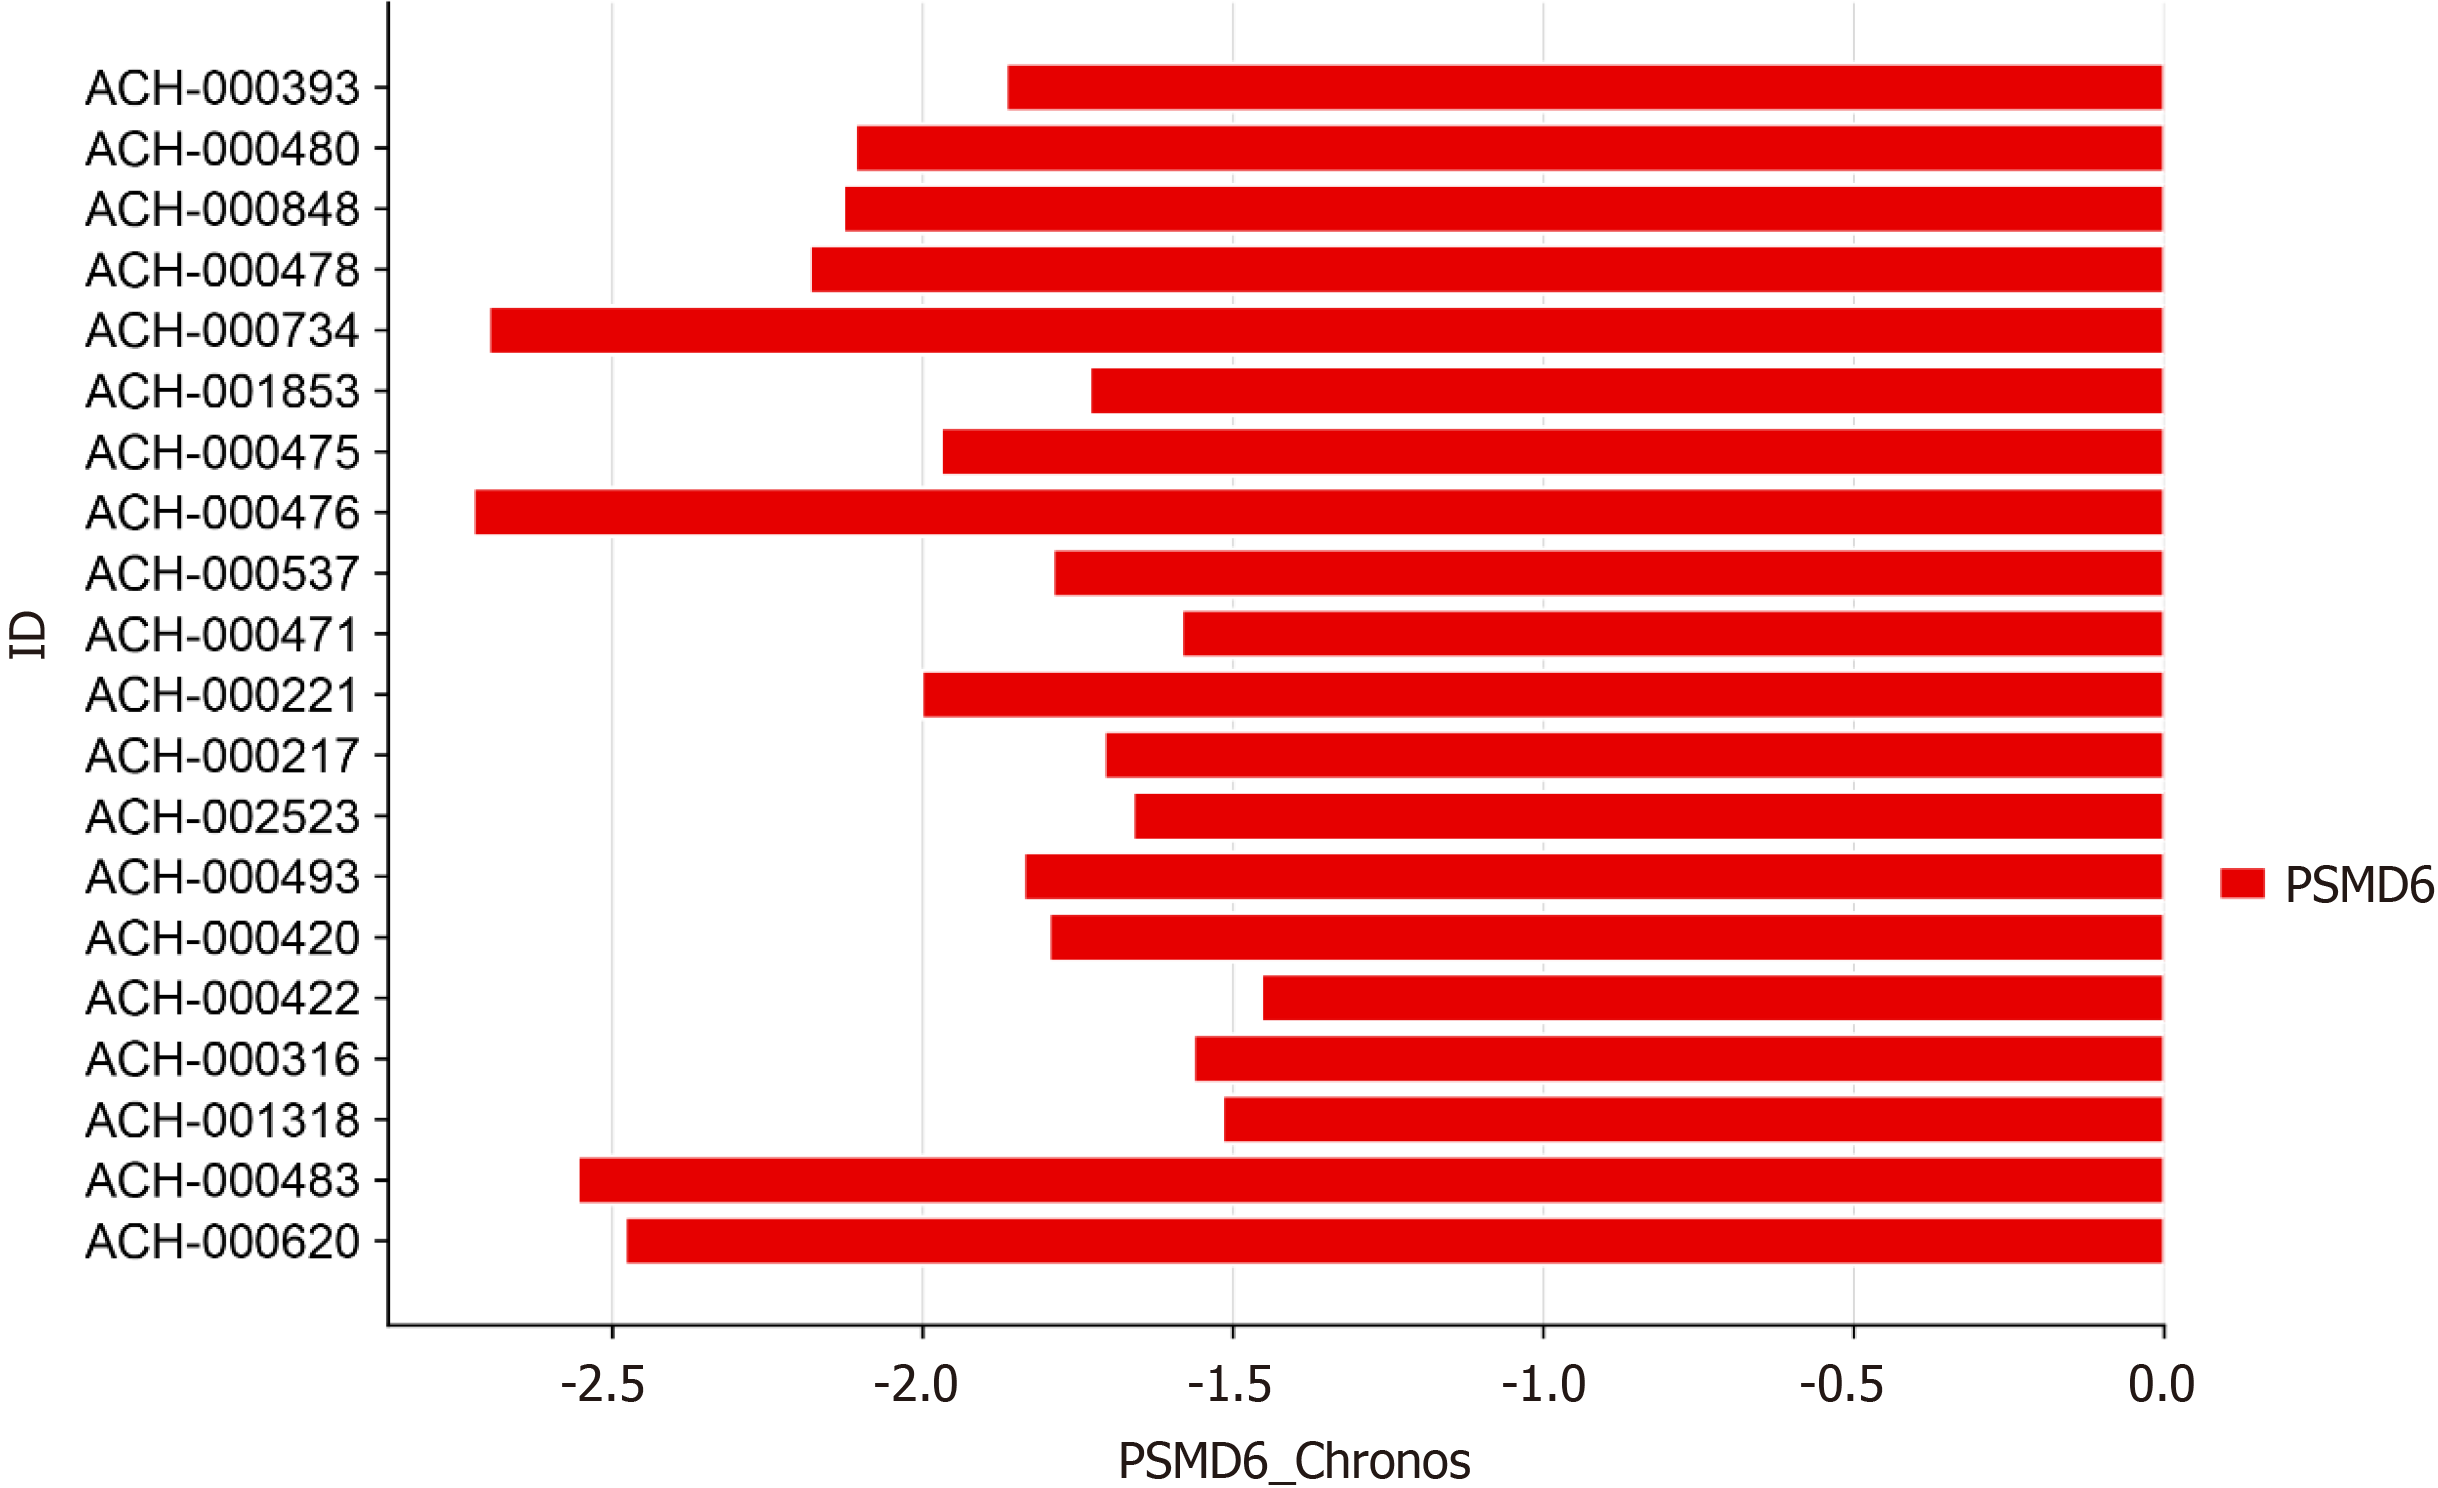
Figure 6 Gene knockout effect score of proteasome 26S subunit non-ATPase 6 in hepatocellular carcinoma cell lines.
PSMD6: Proteasome 26S subunit non-ATPase 6.
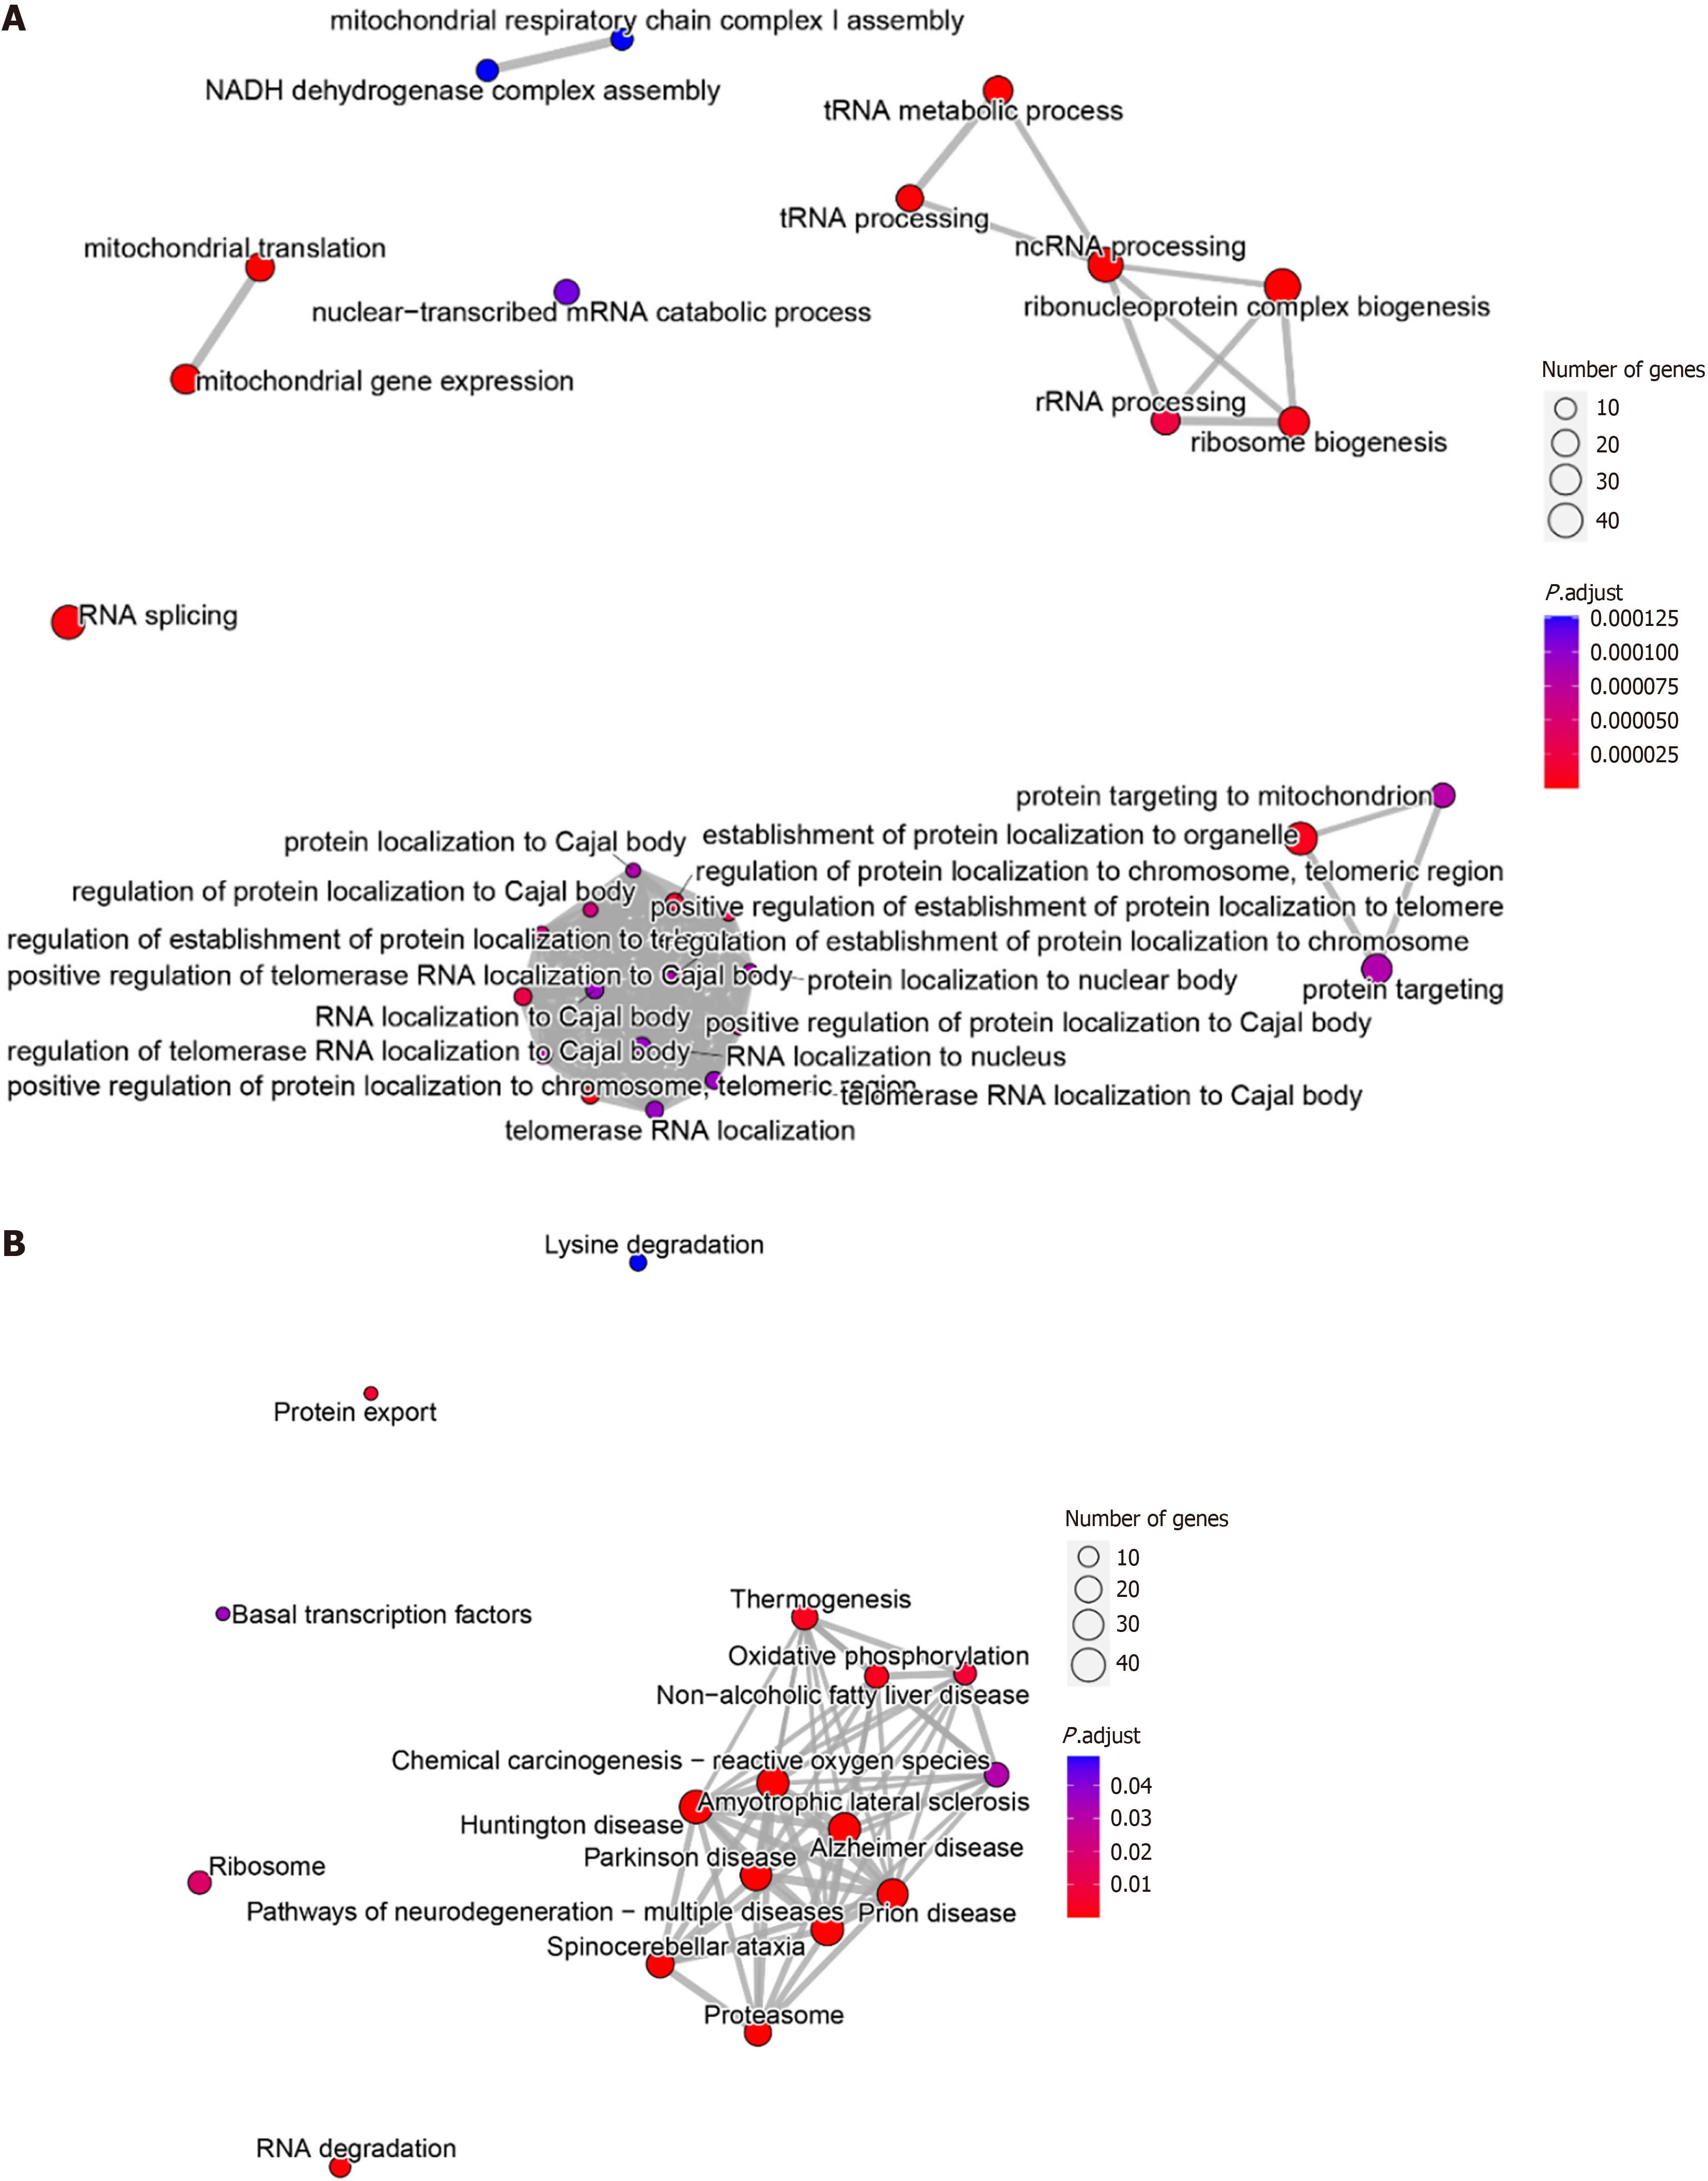
Figure 7 Evaluation of the potential molecular biological mechanisms of proteasome 26S subunit non-ATPase 6 in hepatocellular carcinoma tissues.
A: Gene Ontology enrichment analysis; B: Kyoto Encyclopedia of Genes and Genomes enrichment analysis.
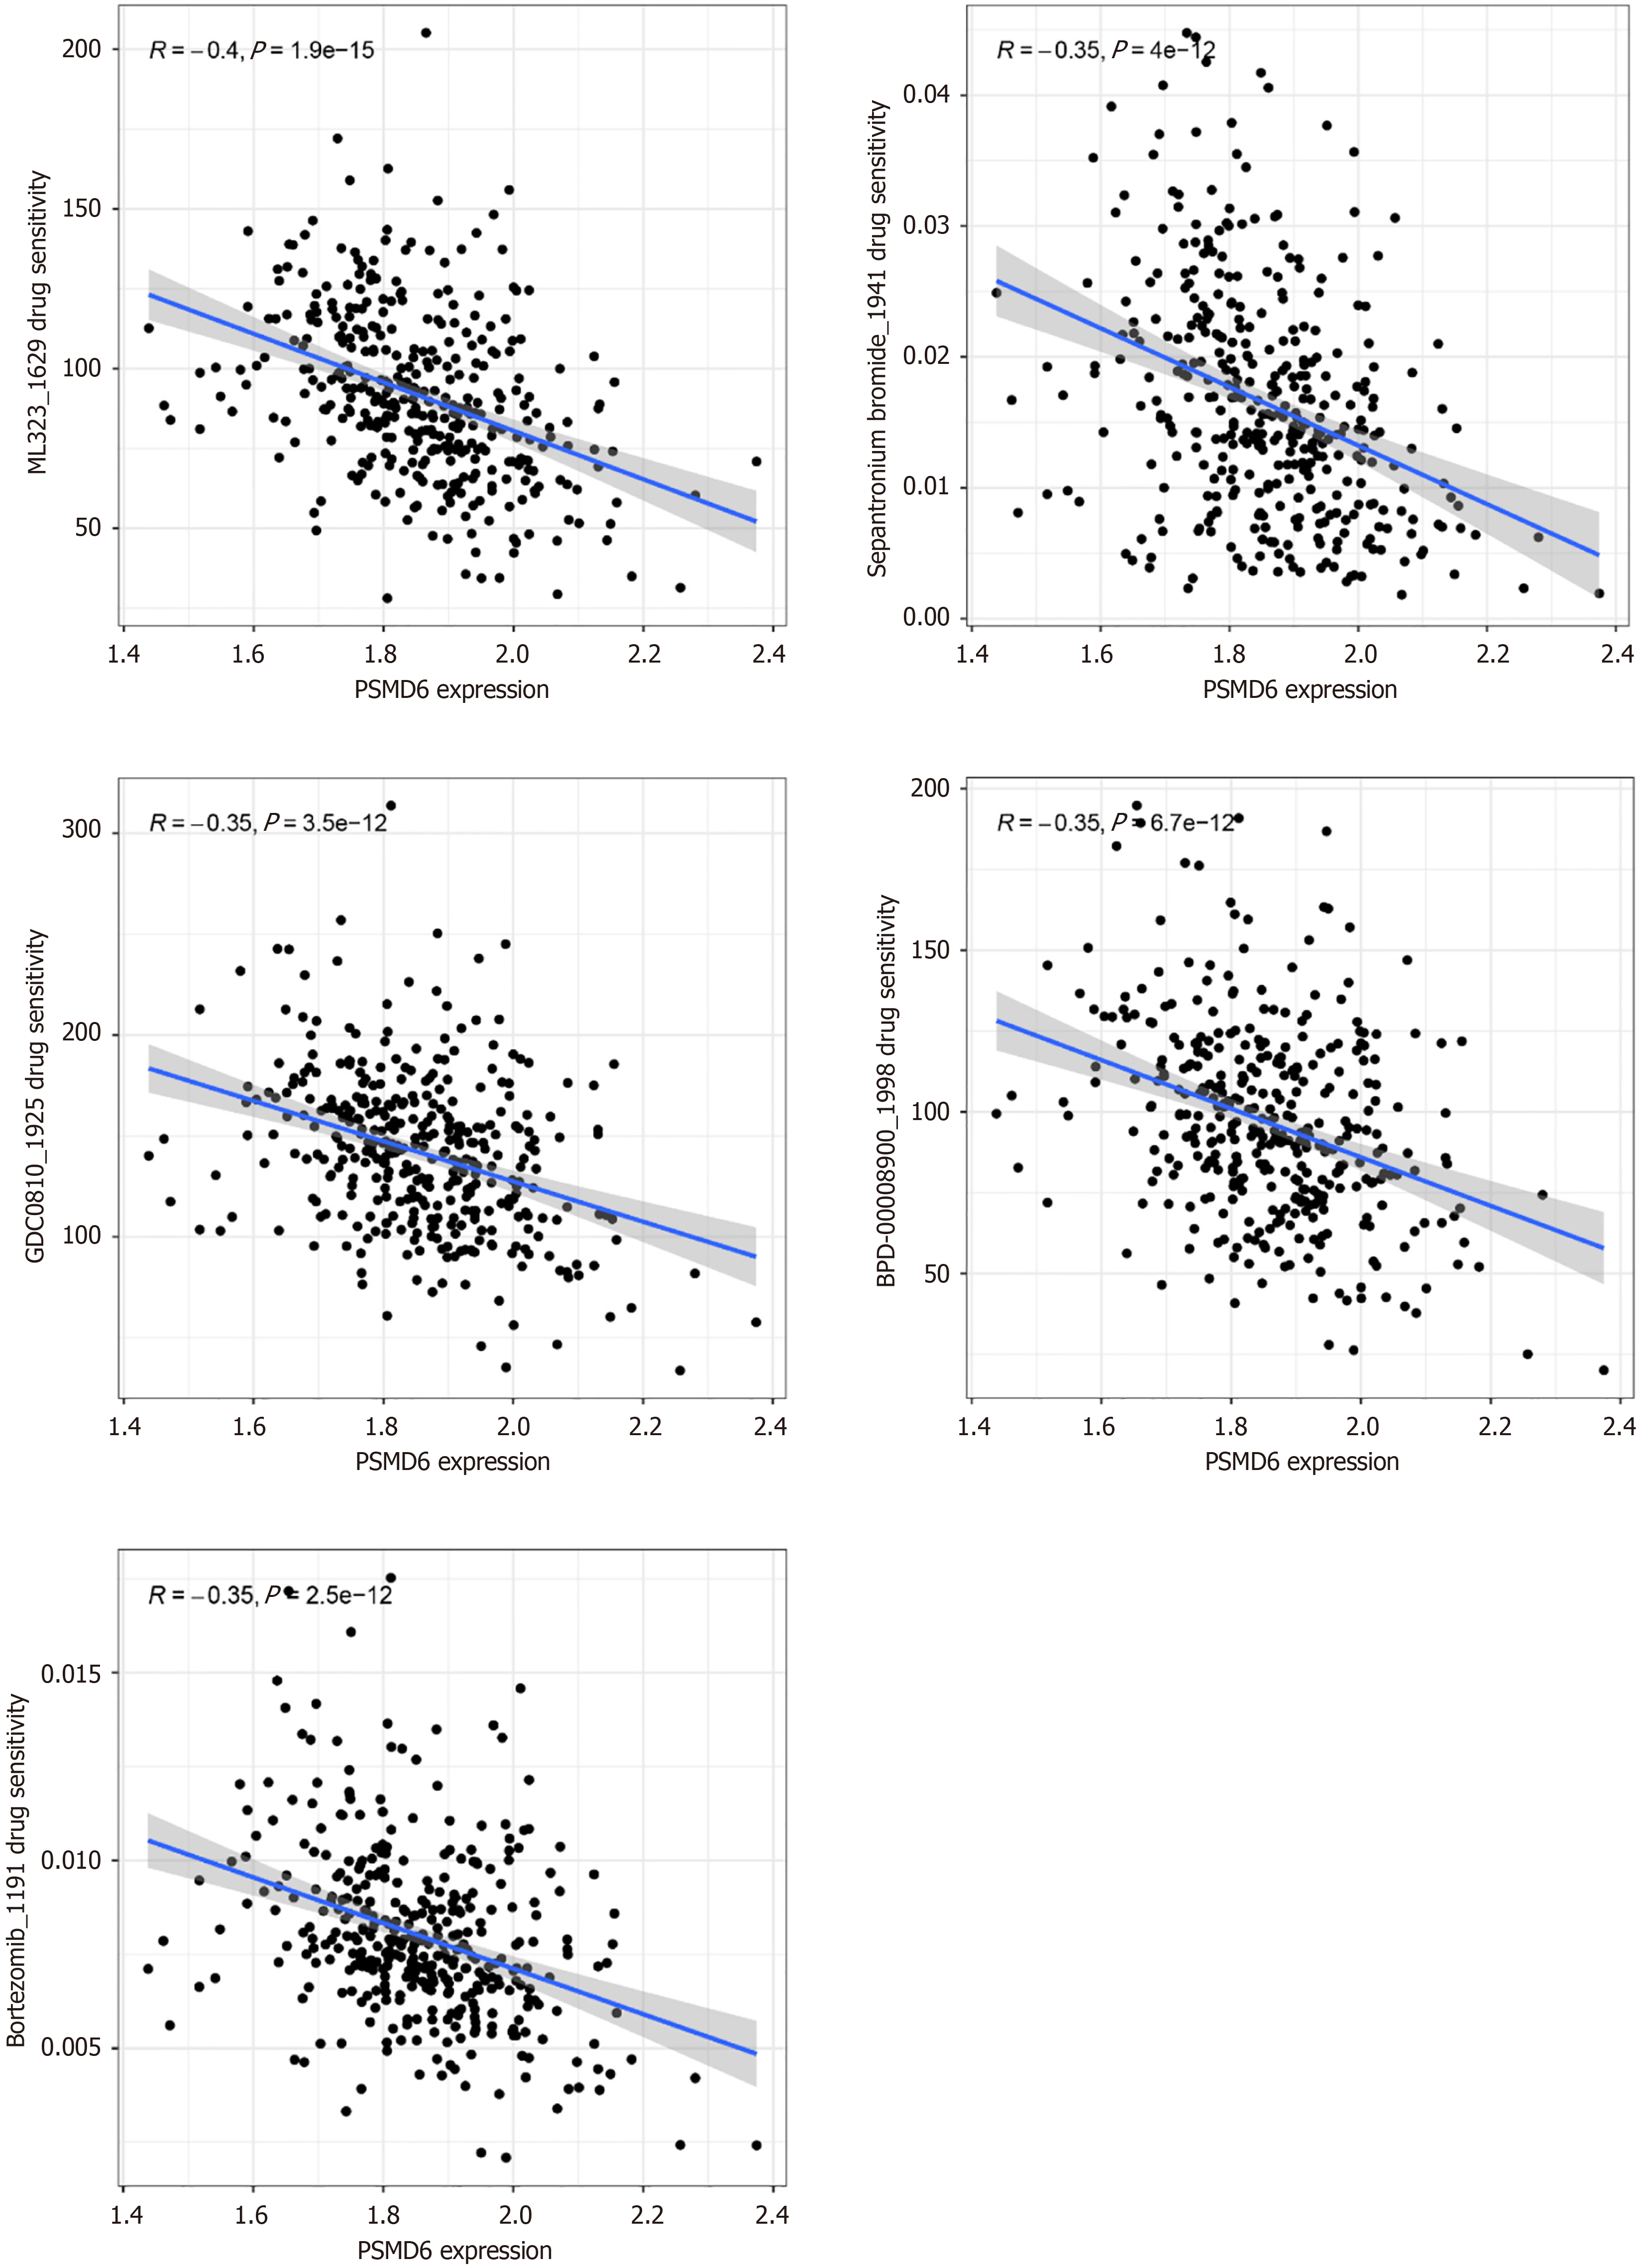
Figure 8 Correlation analysis between drug sensitivity of tumour targeted therapy drugs and proteasome 26S subunit non-ATPase 6 mRNA expression level in hepatocellular carcinoma tissues.
PSMD6: Proteasome 26S subunit non-ATPase 6.
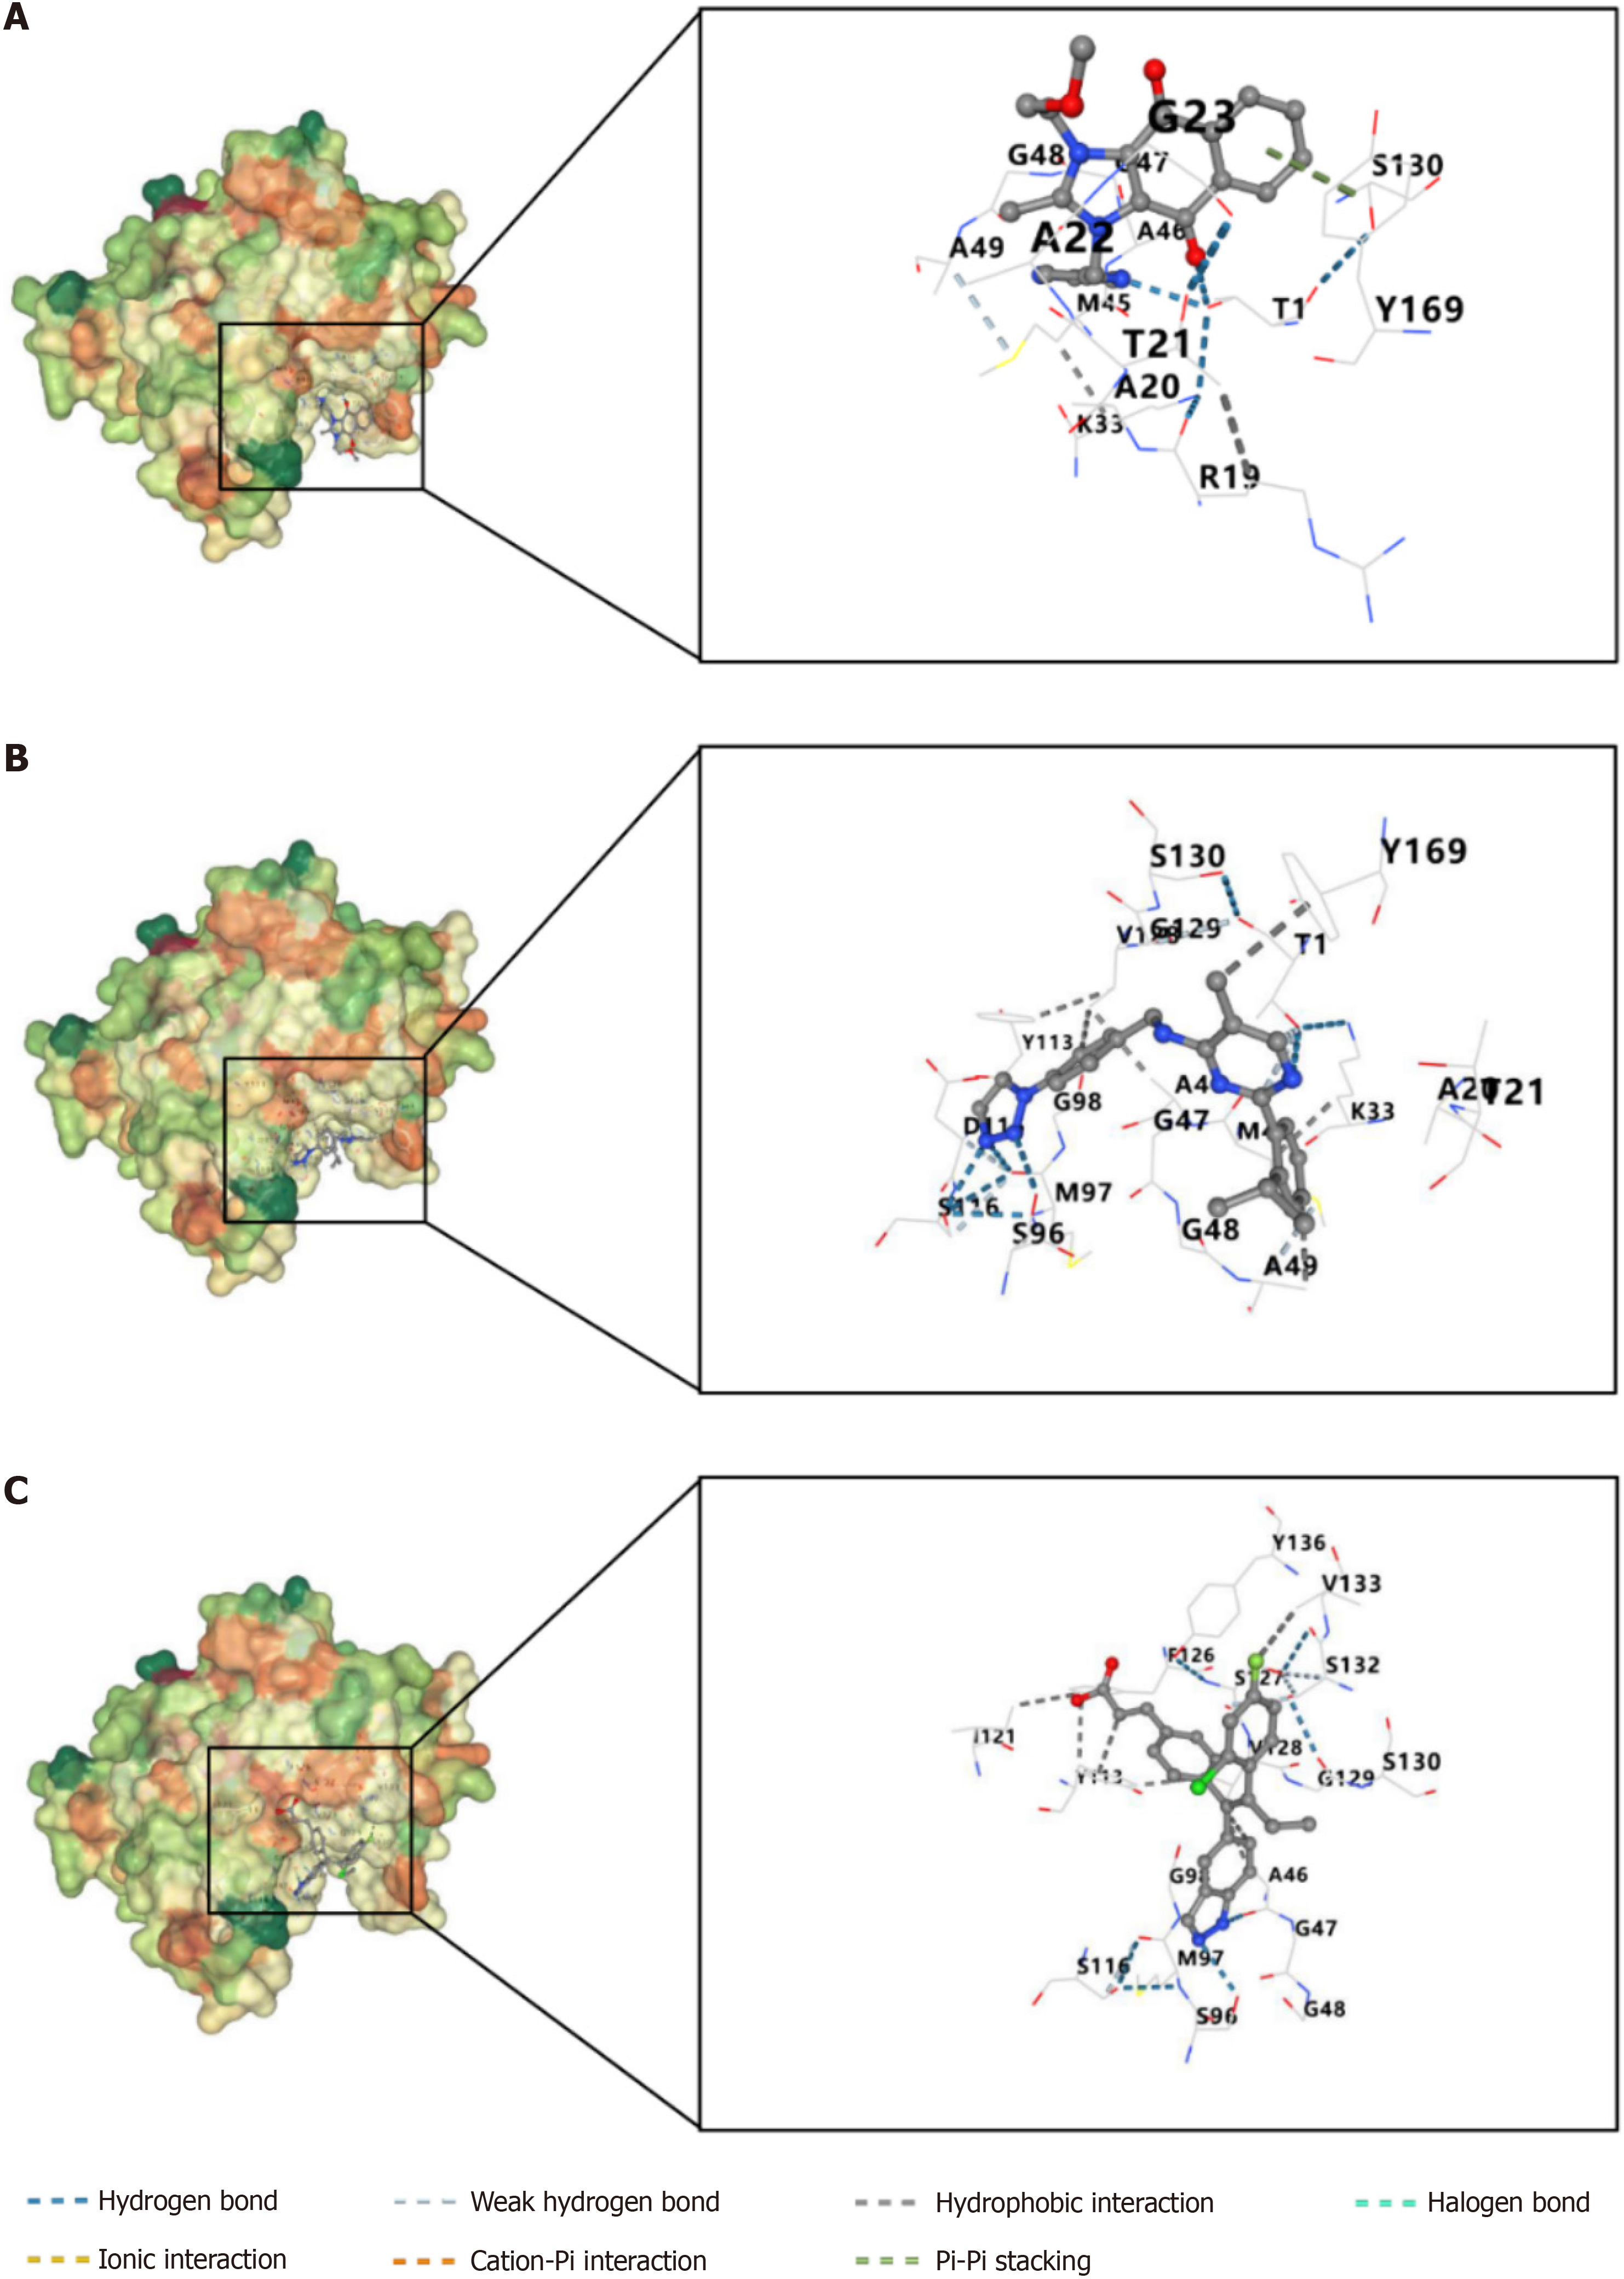
Figure 9 Construction of molecular docking model between proteasome 26S subunit non-ATPase 6 protein and small molecule compounds.
A: Sepantronium bromide; B: ML323; C: GDC0810.
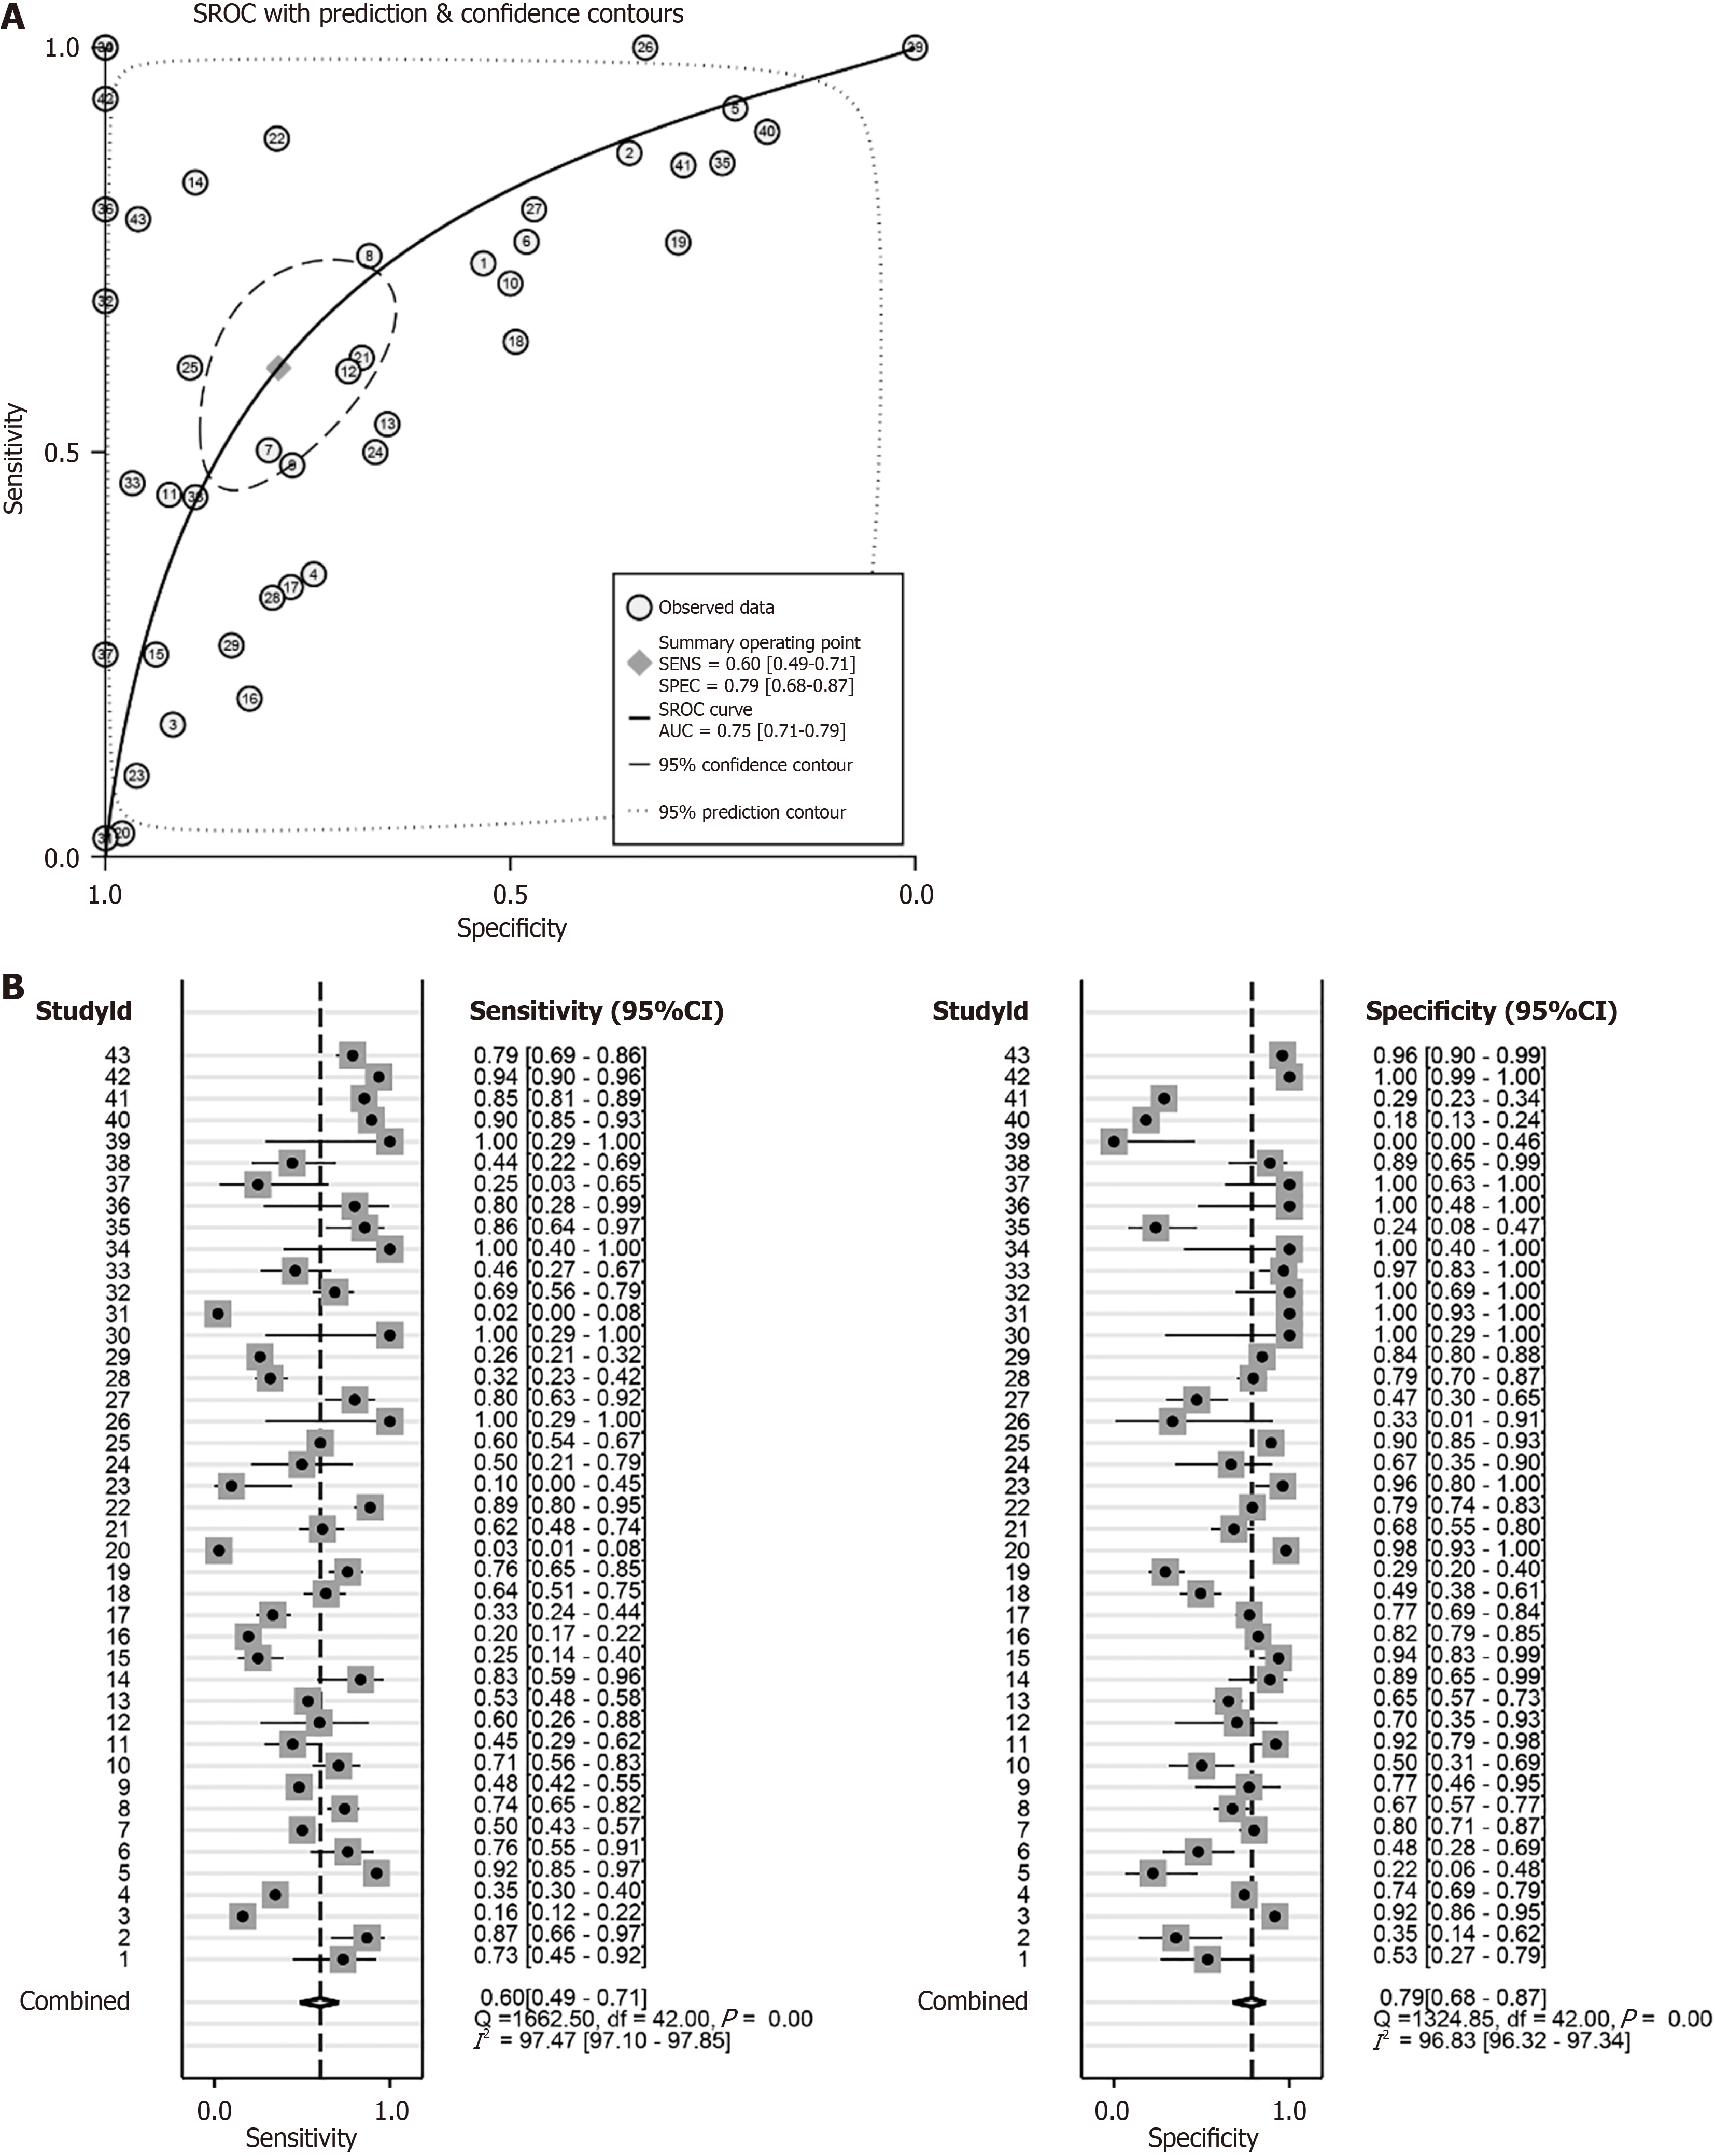
Figure 10 Sensitivity and specificity analysis of proteasome 26S subunit non-ATPase 6 mRNA and protein in identifying hepatocellular carcinoma tissues.
A: Summary receiver operating characteristic curve; B: Forest plot of sensitivity and specificity. ROC: Receiver operating characteristic curve; sROC: Summary receiver operating characteristic curve.
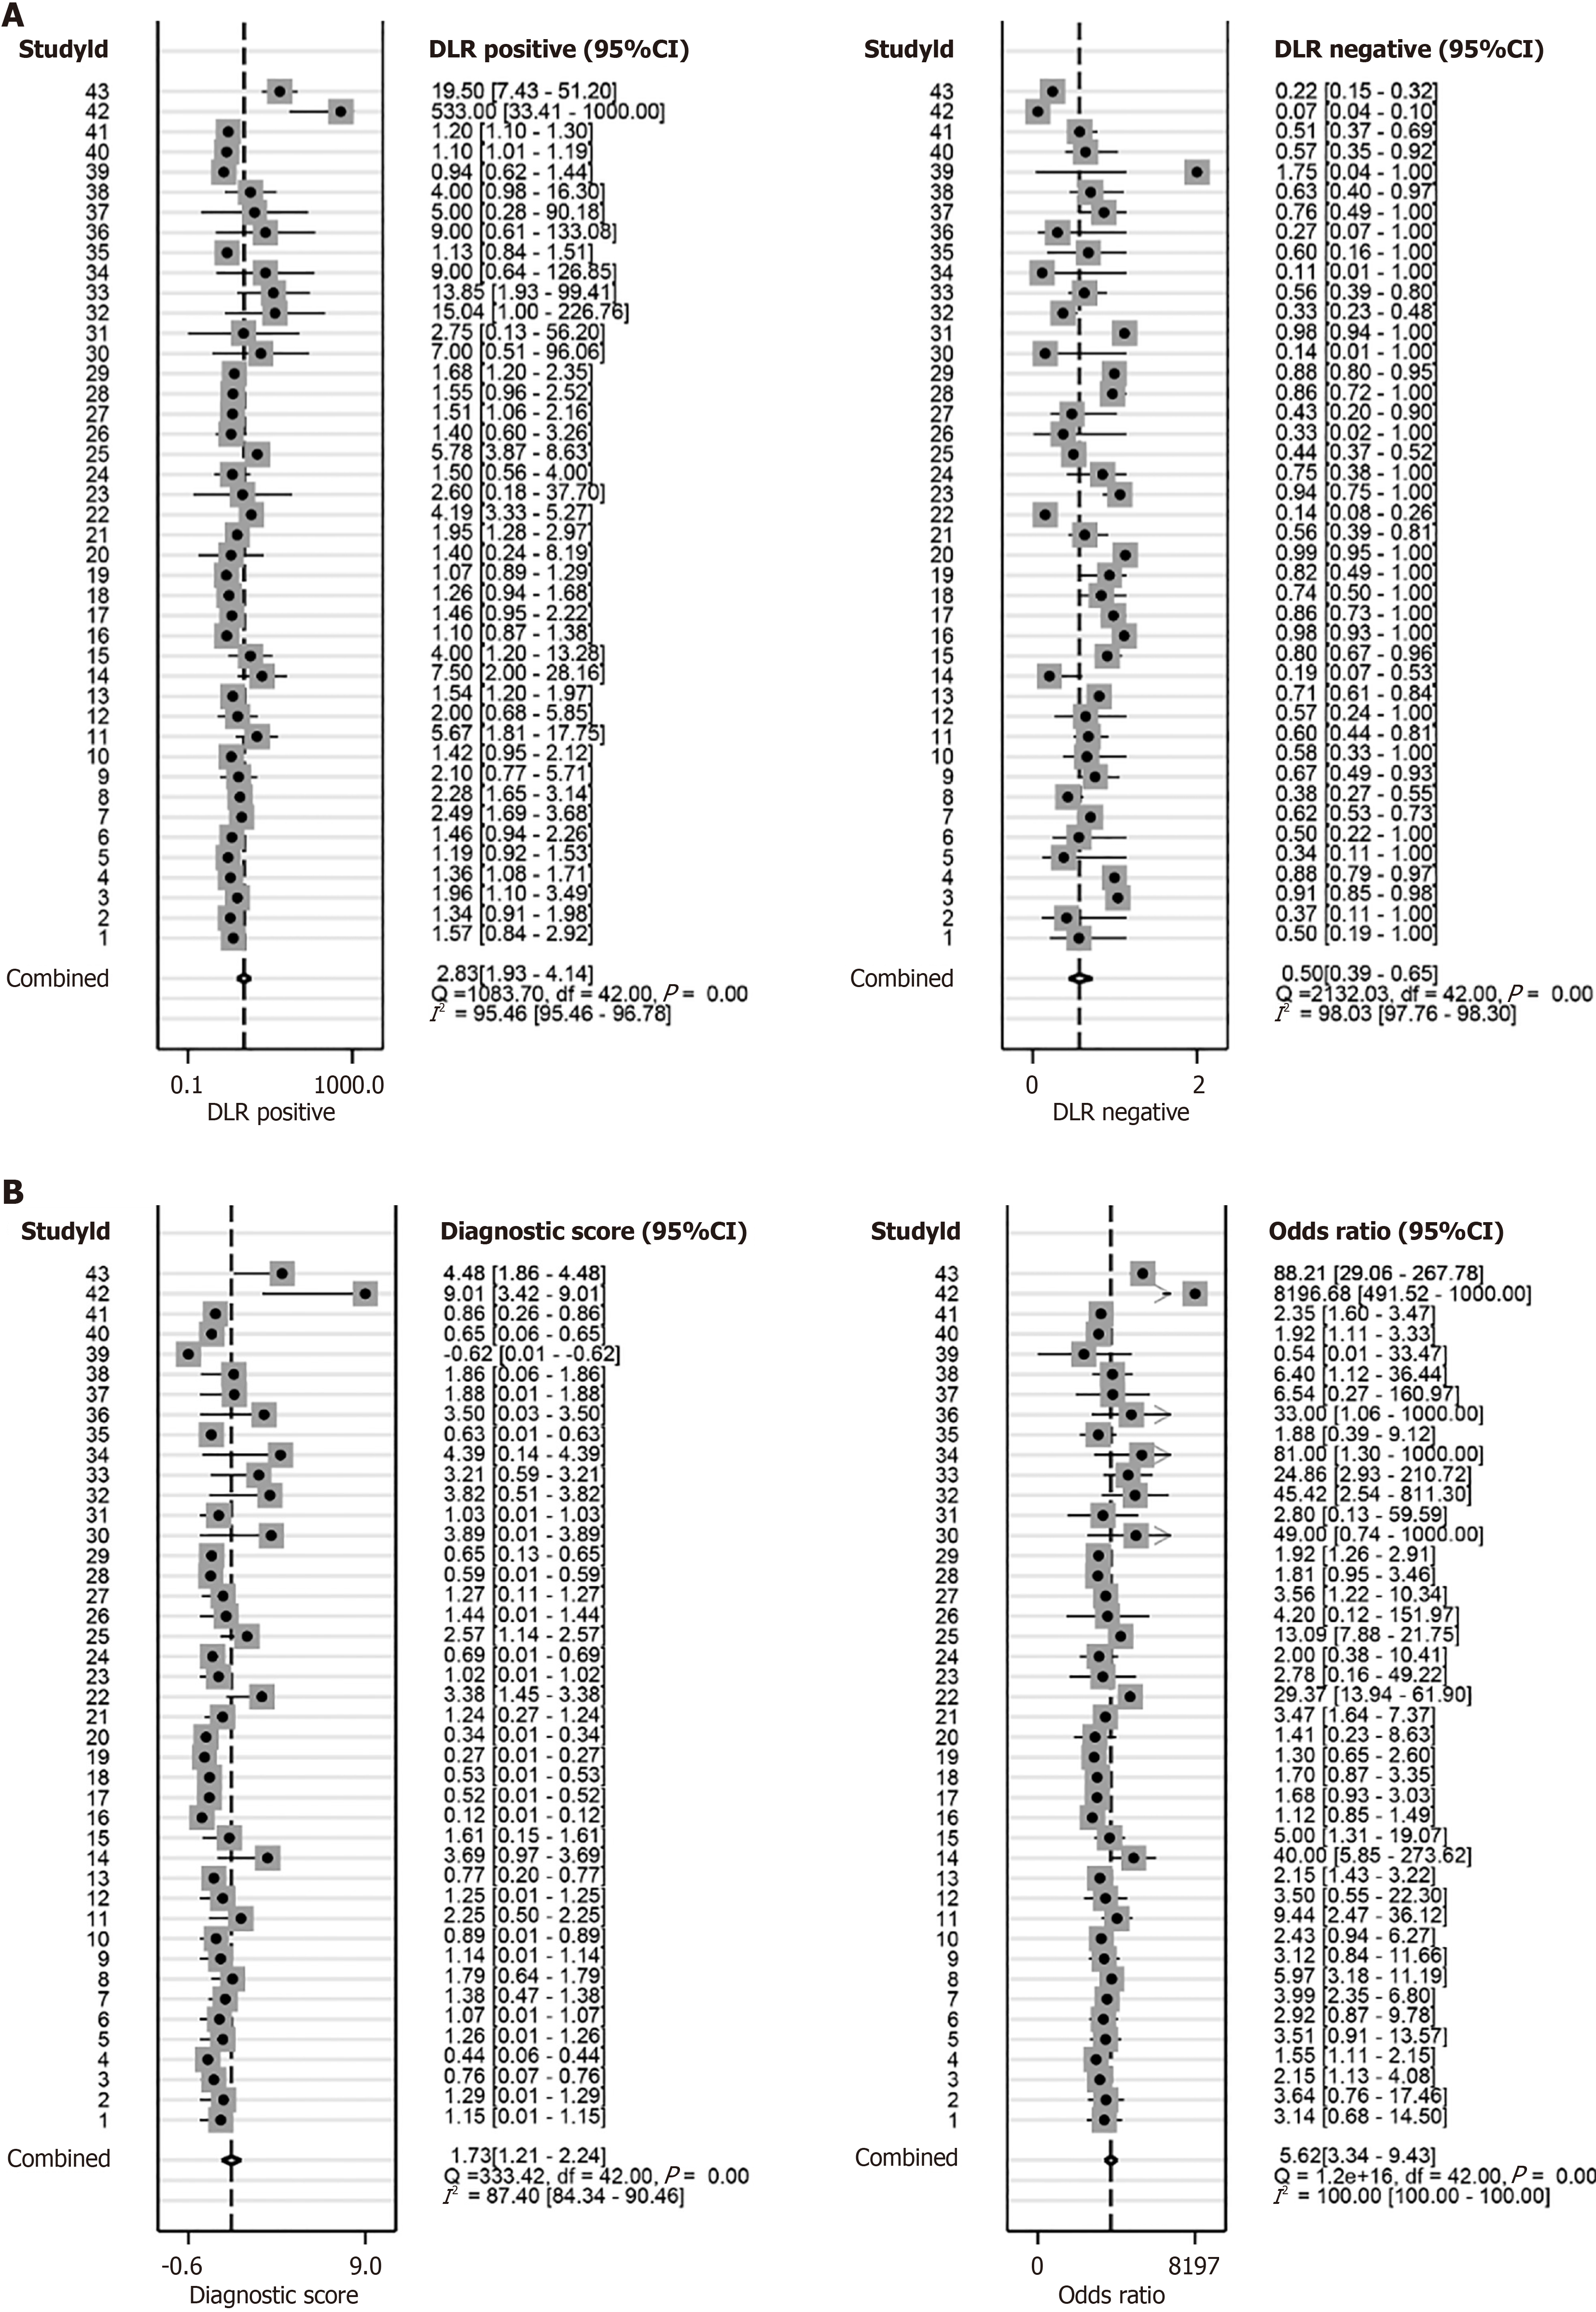
Figure 11 Evaluation of the ability of proteasome 26S subunit non-ATPase 6 mRNA and protein expression levels to identify hepato
- Citation: Zhou SS, Ye YP, Chen Y, Zeng DT, Zheng GC, He RQ, Chi BT, Wang L, Lin Q, Su QY, Dang YW, Chen G, Wei JL. Overexpression pattern, function, and clinical value of proteasome 26S subunit non-ATPase 6 in hepatocellular carcinoma. World J Clin Oncol 2025; 16(2): 99839
- URL: https://www.wjgnet.com/2218-4333/full/v16/i2/99839.htm
- DOI: https://dx.doi.org/10.5306/wjco.v16.i2.99839


