©The Author(s) 2024.
World J Clin Oncol. Sep 24, 2024; 15(9): 1188-1197
Published online Sep 24, 2024. doi: 10.5306/wjco.v15.i9.1188
Published online Sep 24, 2024. doi: 10.5306/wjco.v15.i9.1188
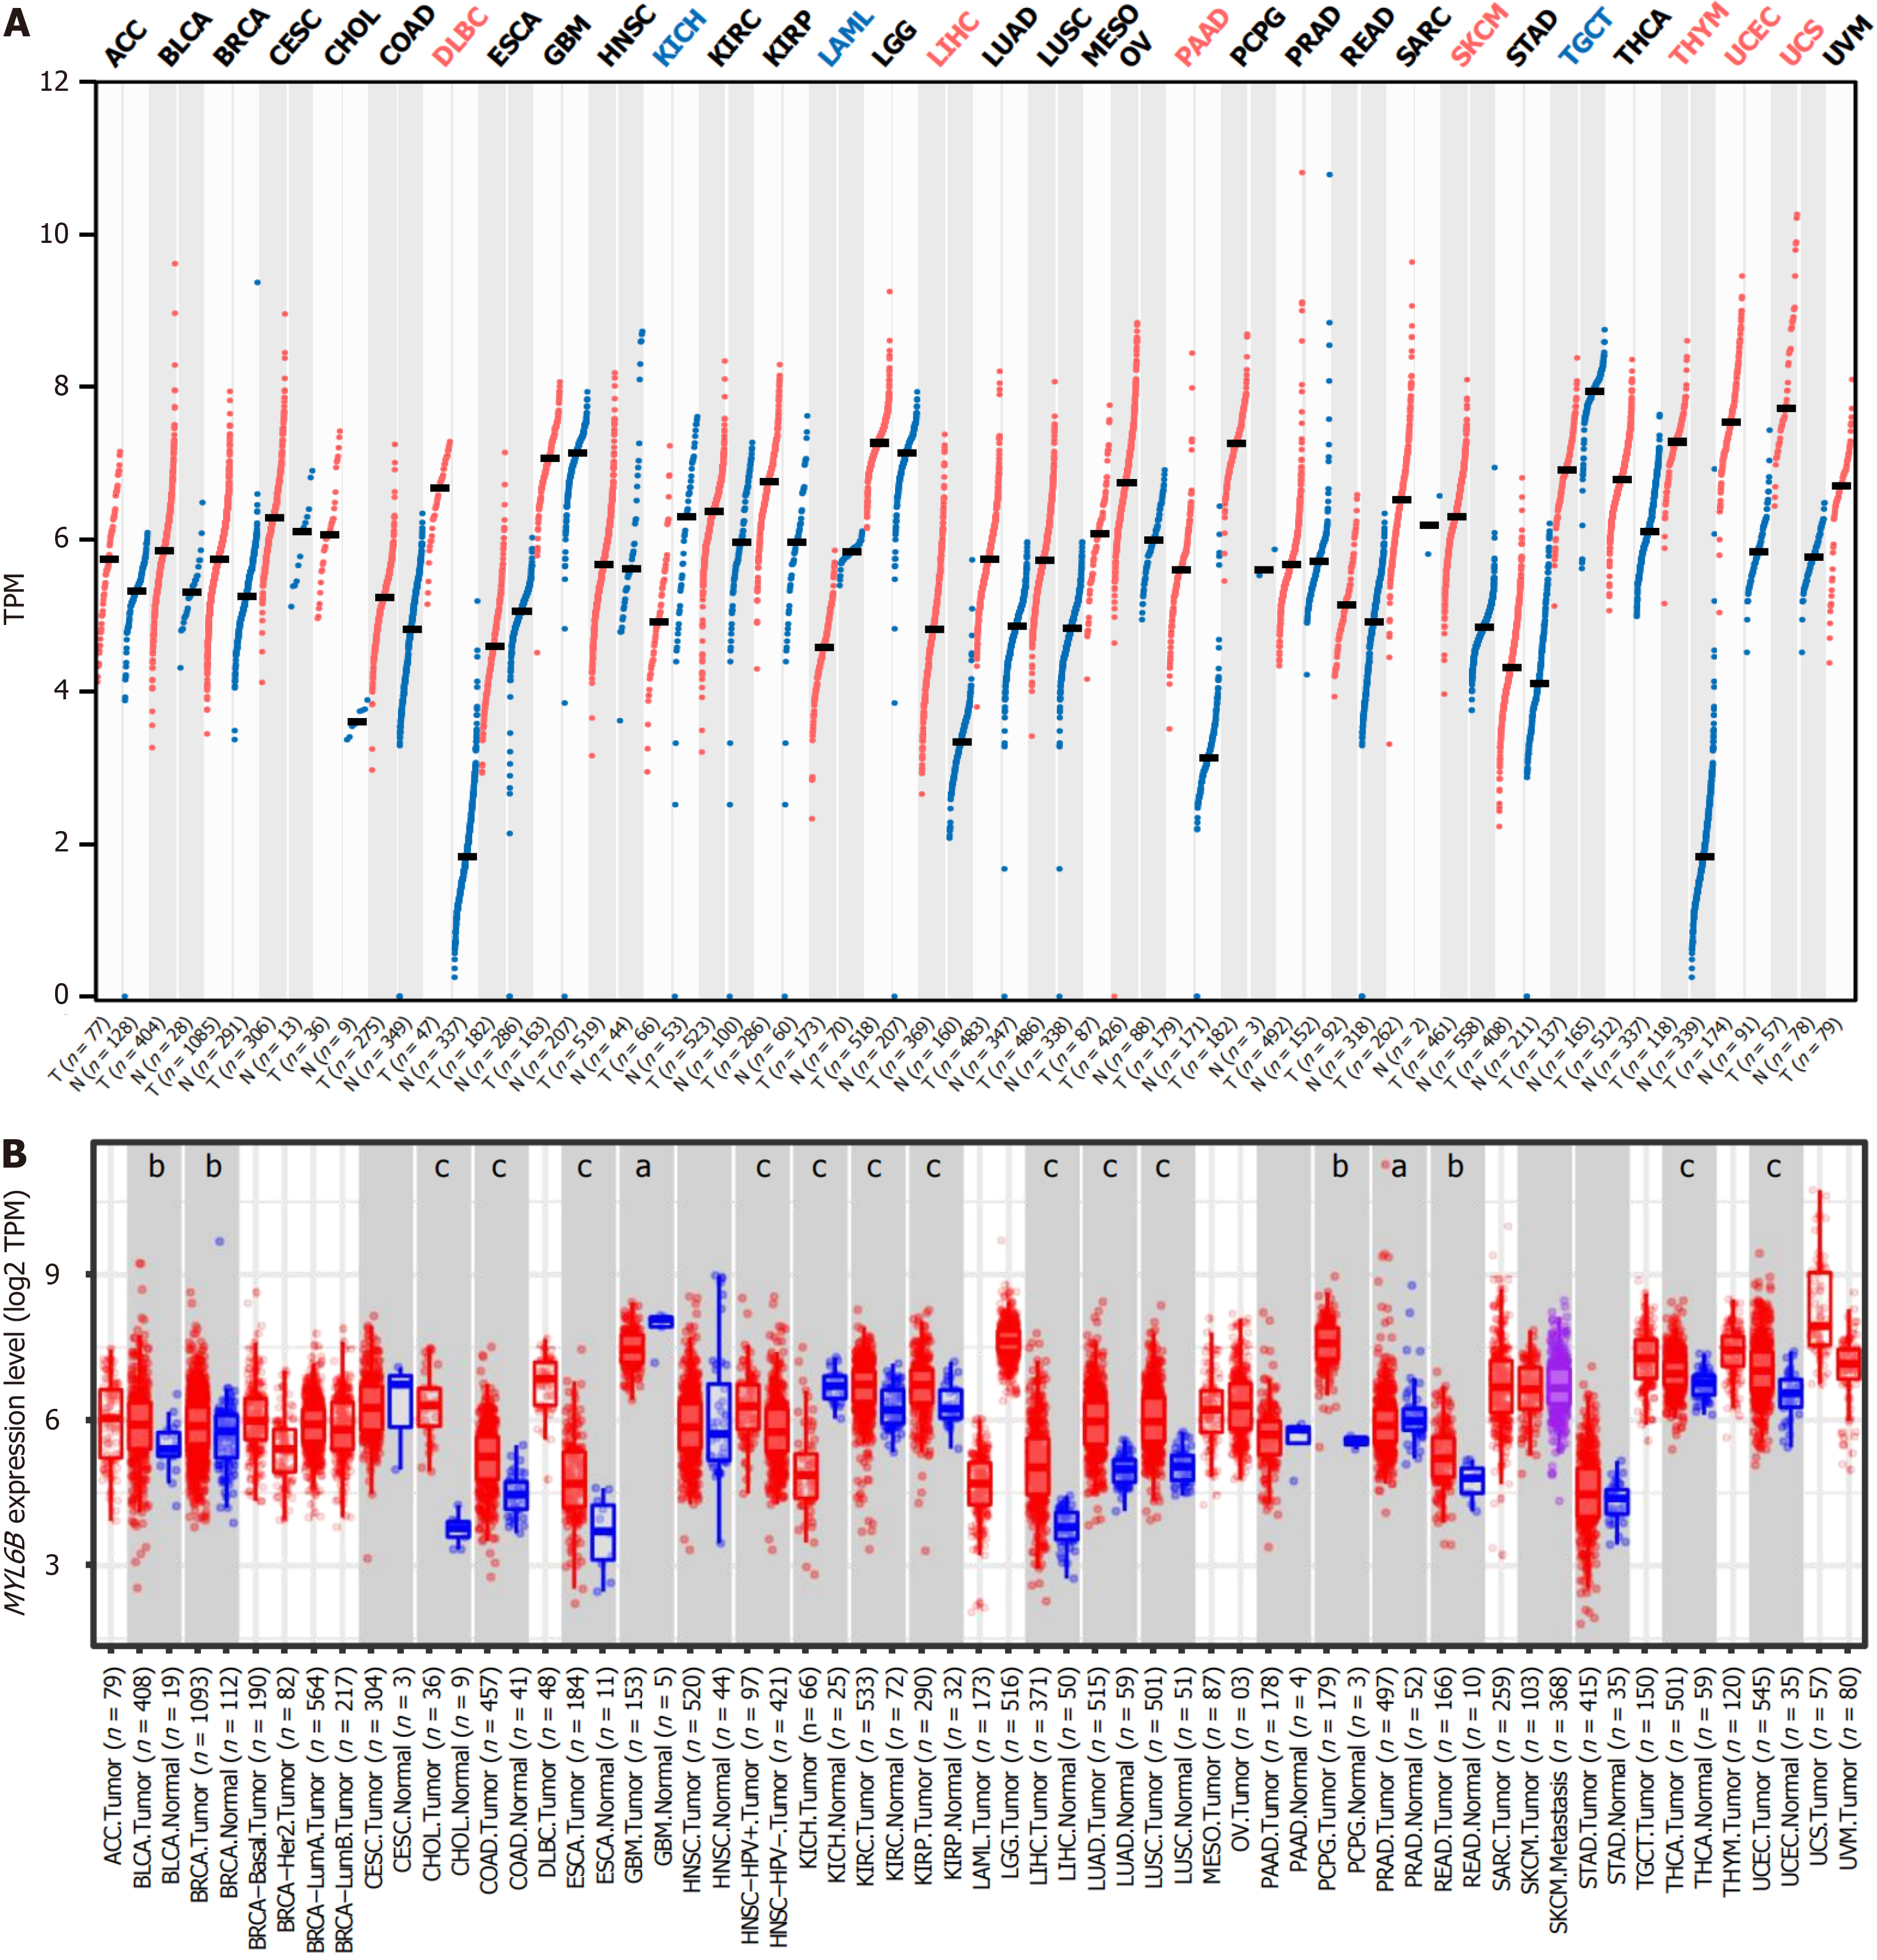
Figure 1 Expression of MYL6B across various cancer types.
A: Comparison between cancerous tissues and adjacent normal tissues using the gene expression profiling interactive analysis database; B: Comparison of cancer tissues with corresponding normal tissues utilizing the tumor immune estimation resource 2.0 database. Statistical significance is denoted by asterisks. aP < 0.05. bP < 0.01. cP < 0.001. TPM: Transcripts per million; ACC: Adrenocortical carcinoma; BLCA: Bladder urothelial carcinoma; BRCA: Breast invasive carcinoma; CESC: Cervical squamous cell carcinoma and endocervical adenocarcinoma; CHOL: Cholangiocarcinoma; COAD: Colon adenocarcinoma; DLBC: Lymphoid neoplasm diffuse large B-cell lymphoma; ESCA: Esophageal carcinoma; GBM: Glioblastoma multiforme; HNSC: Head and neck squamous cell carcinoma; KICH: Kidney chromophobe; KIRC: Kidney renal clear cell carcinoma; KIRP: Kidney renal papillary cell carcinoma; LAML: Acute myeloid leukemia; LGG: Brain lower grade glioma; LIHC: Liver hepatocellular carcinoma; LUAD: Lung adenocarcinoma; LUSC: Lung squamous cell carcinoma; MESO: Mesothelioma; OV: Ovarian serous cystadenocarcinoma; PAAD: Pancreatic adenocarcinoma; PCPG: Pheochromocytoma and paraganglioma; PRAD: Prostate adenocarcinoma; READ: Rectum adenocarcinoma; SARC: Sarcoma; SKCM: Skin cutaneous melanoma; STAD: Stomach adenocarcinoma; TGCT: Testicular germ cell tumors; THCA: Thyroid carcinoma; THYM: Thymoma; UCEC: Uterine corpus endometrial carcinoma; UCS: Uterine carcinosarcoma; UVM: Uveal melanoma.
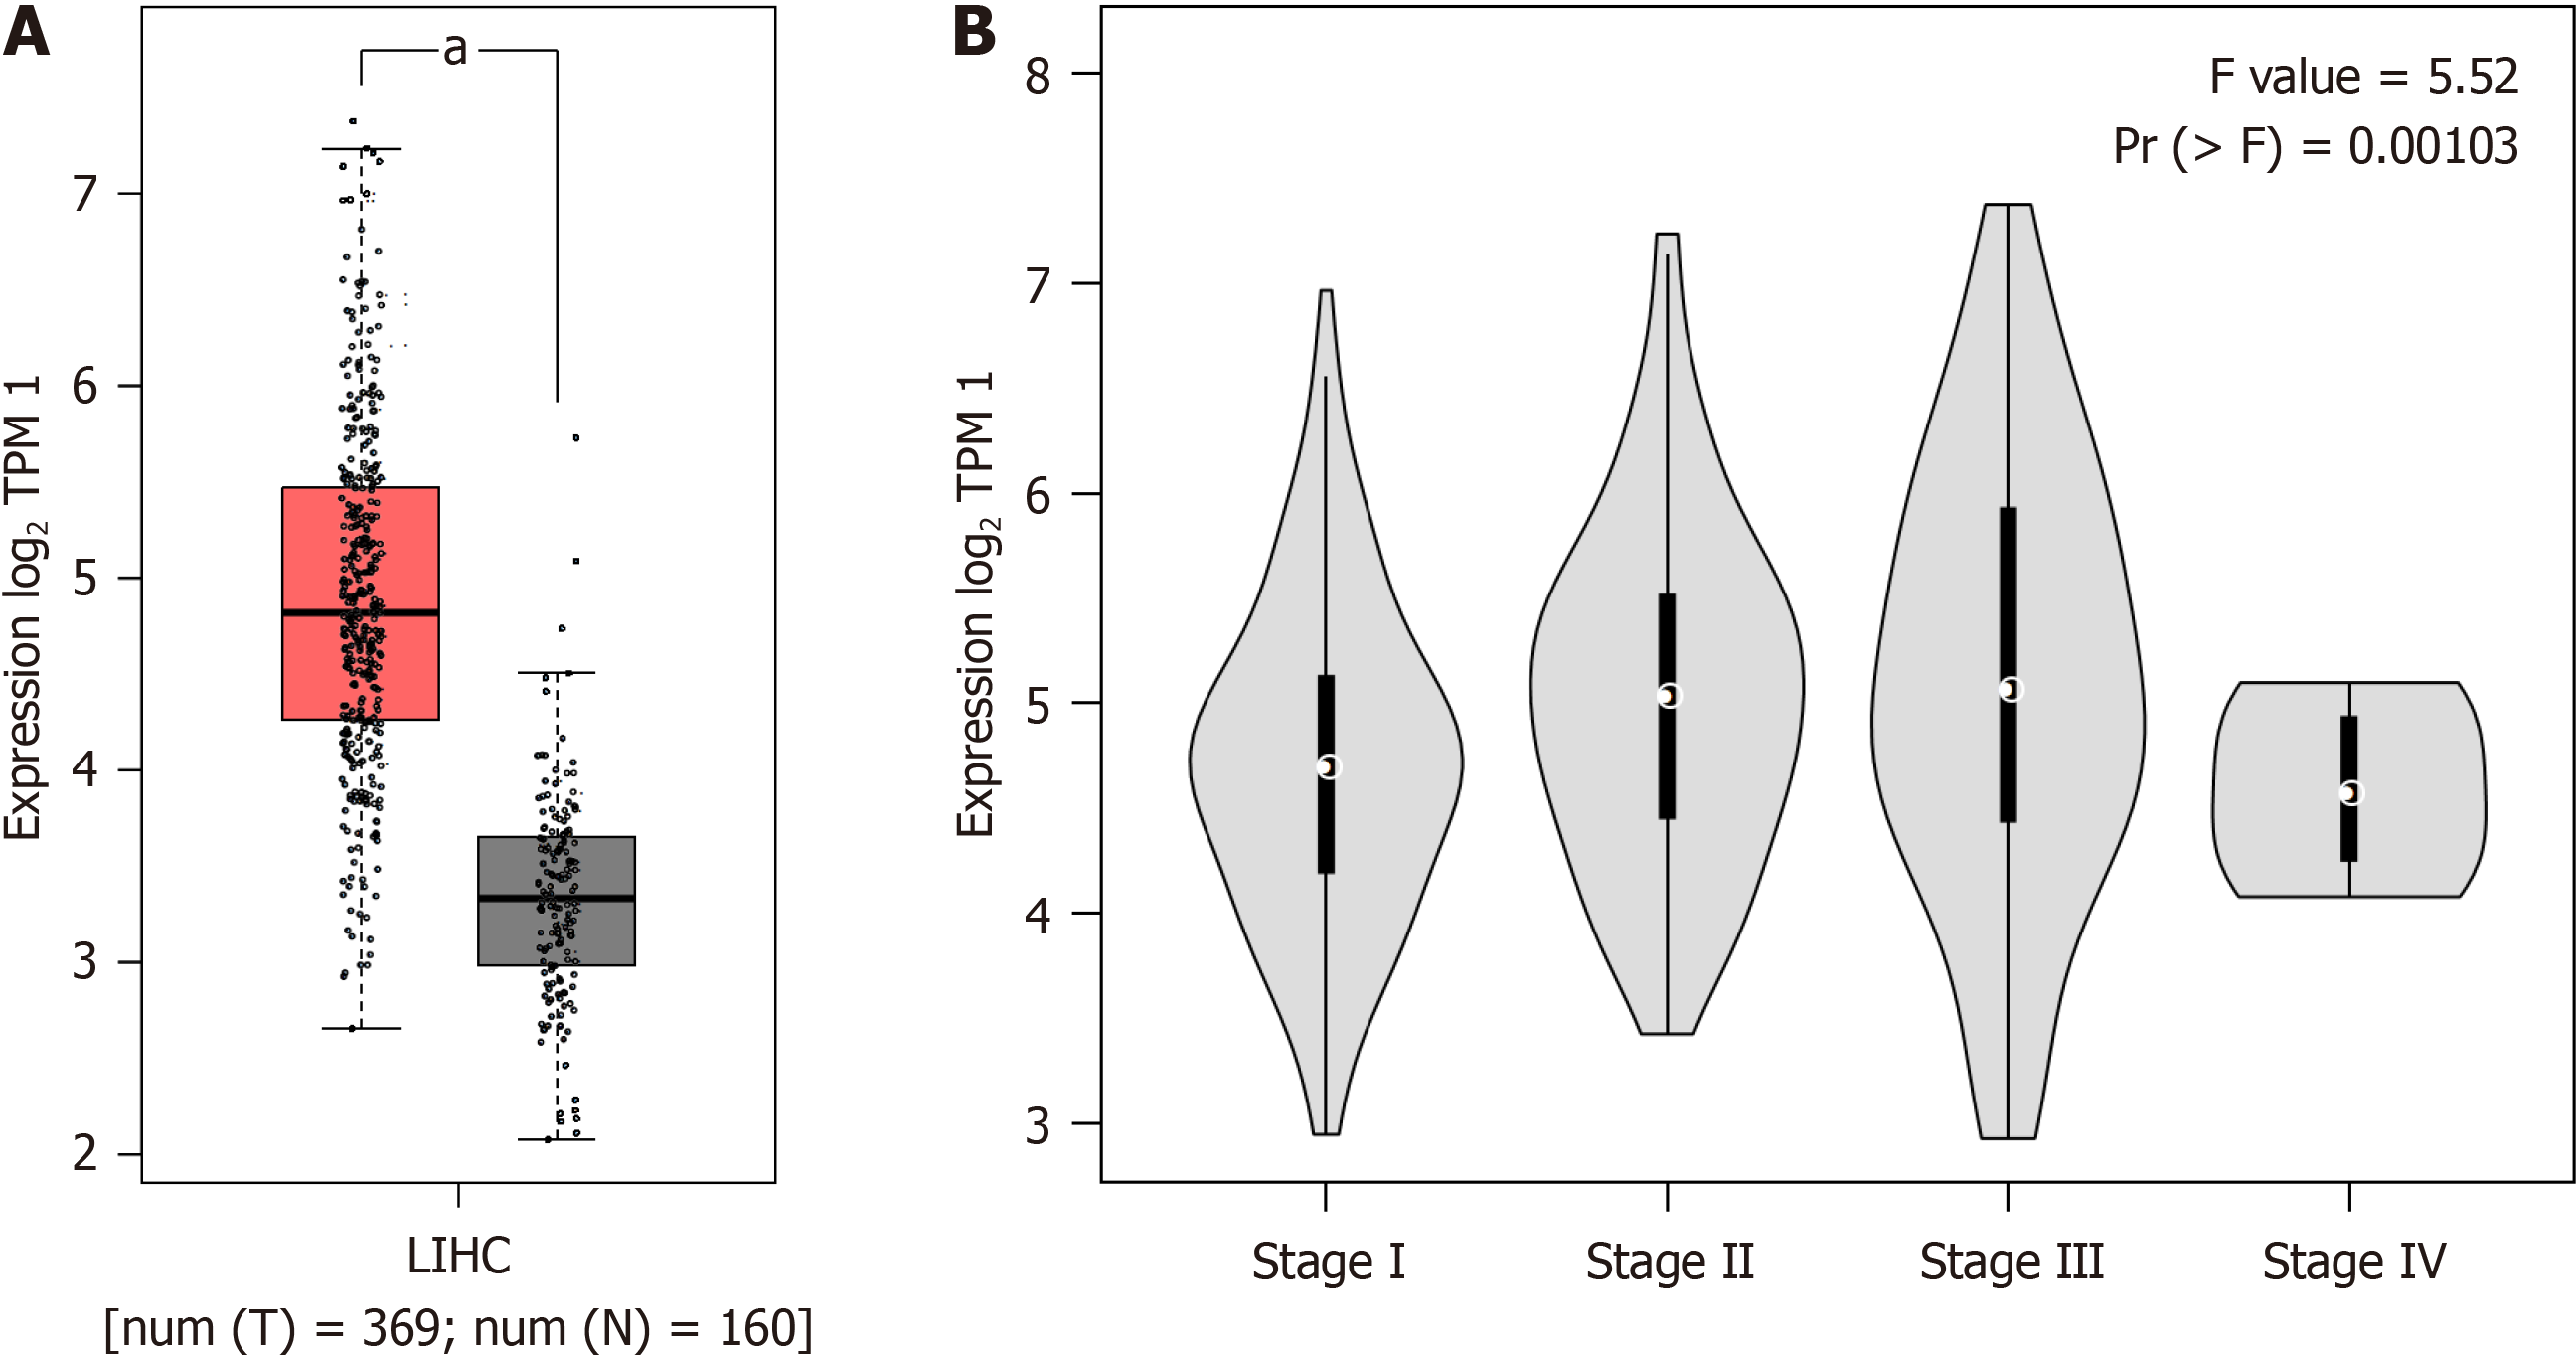
Figure 2 Relationship between MYL6B expression and staging in hepatocellular carcinoma.
A: Comparison of MYL6B expression levels between liver hepatocellular carcinoma (LIHC) and normal tissues; B: Correlation between MYL6B expression levels and staging in LIHC. TPM: Transcripts per million; LIHC: Liver hepatocellular carcinoma; T: Tumor; N: Normal.
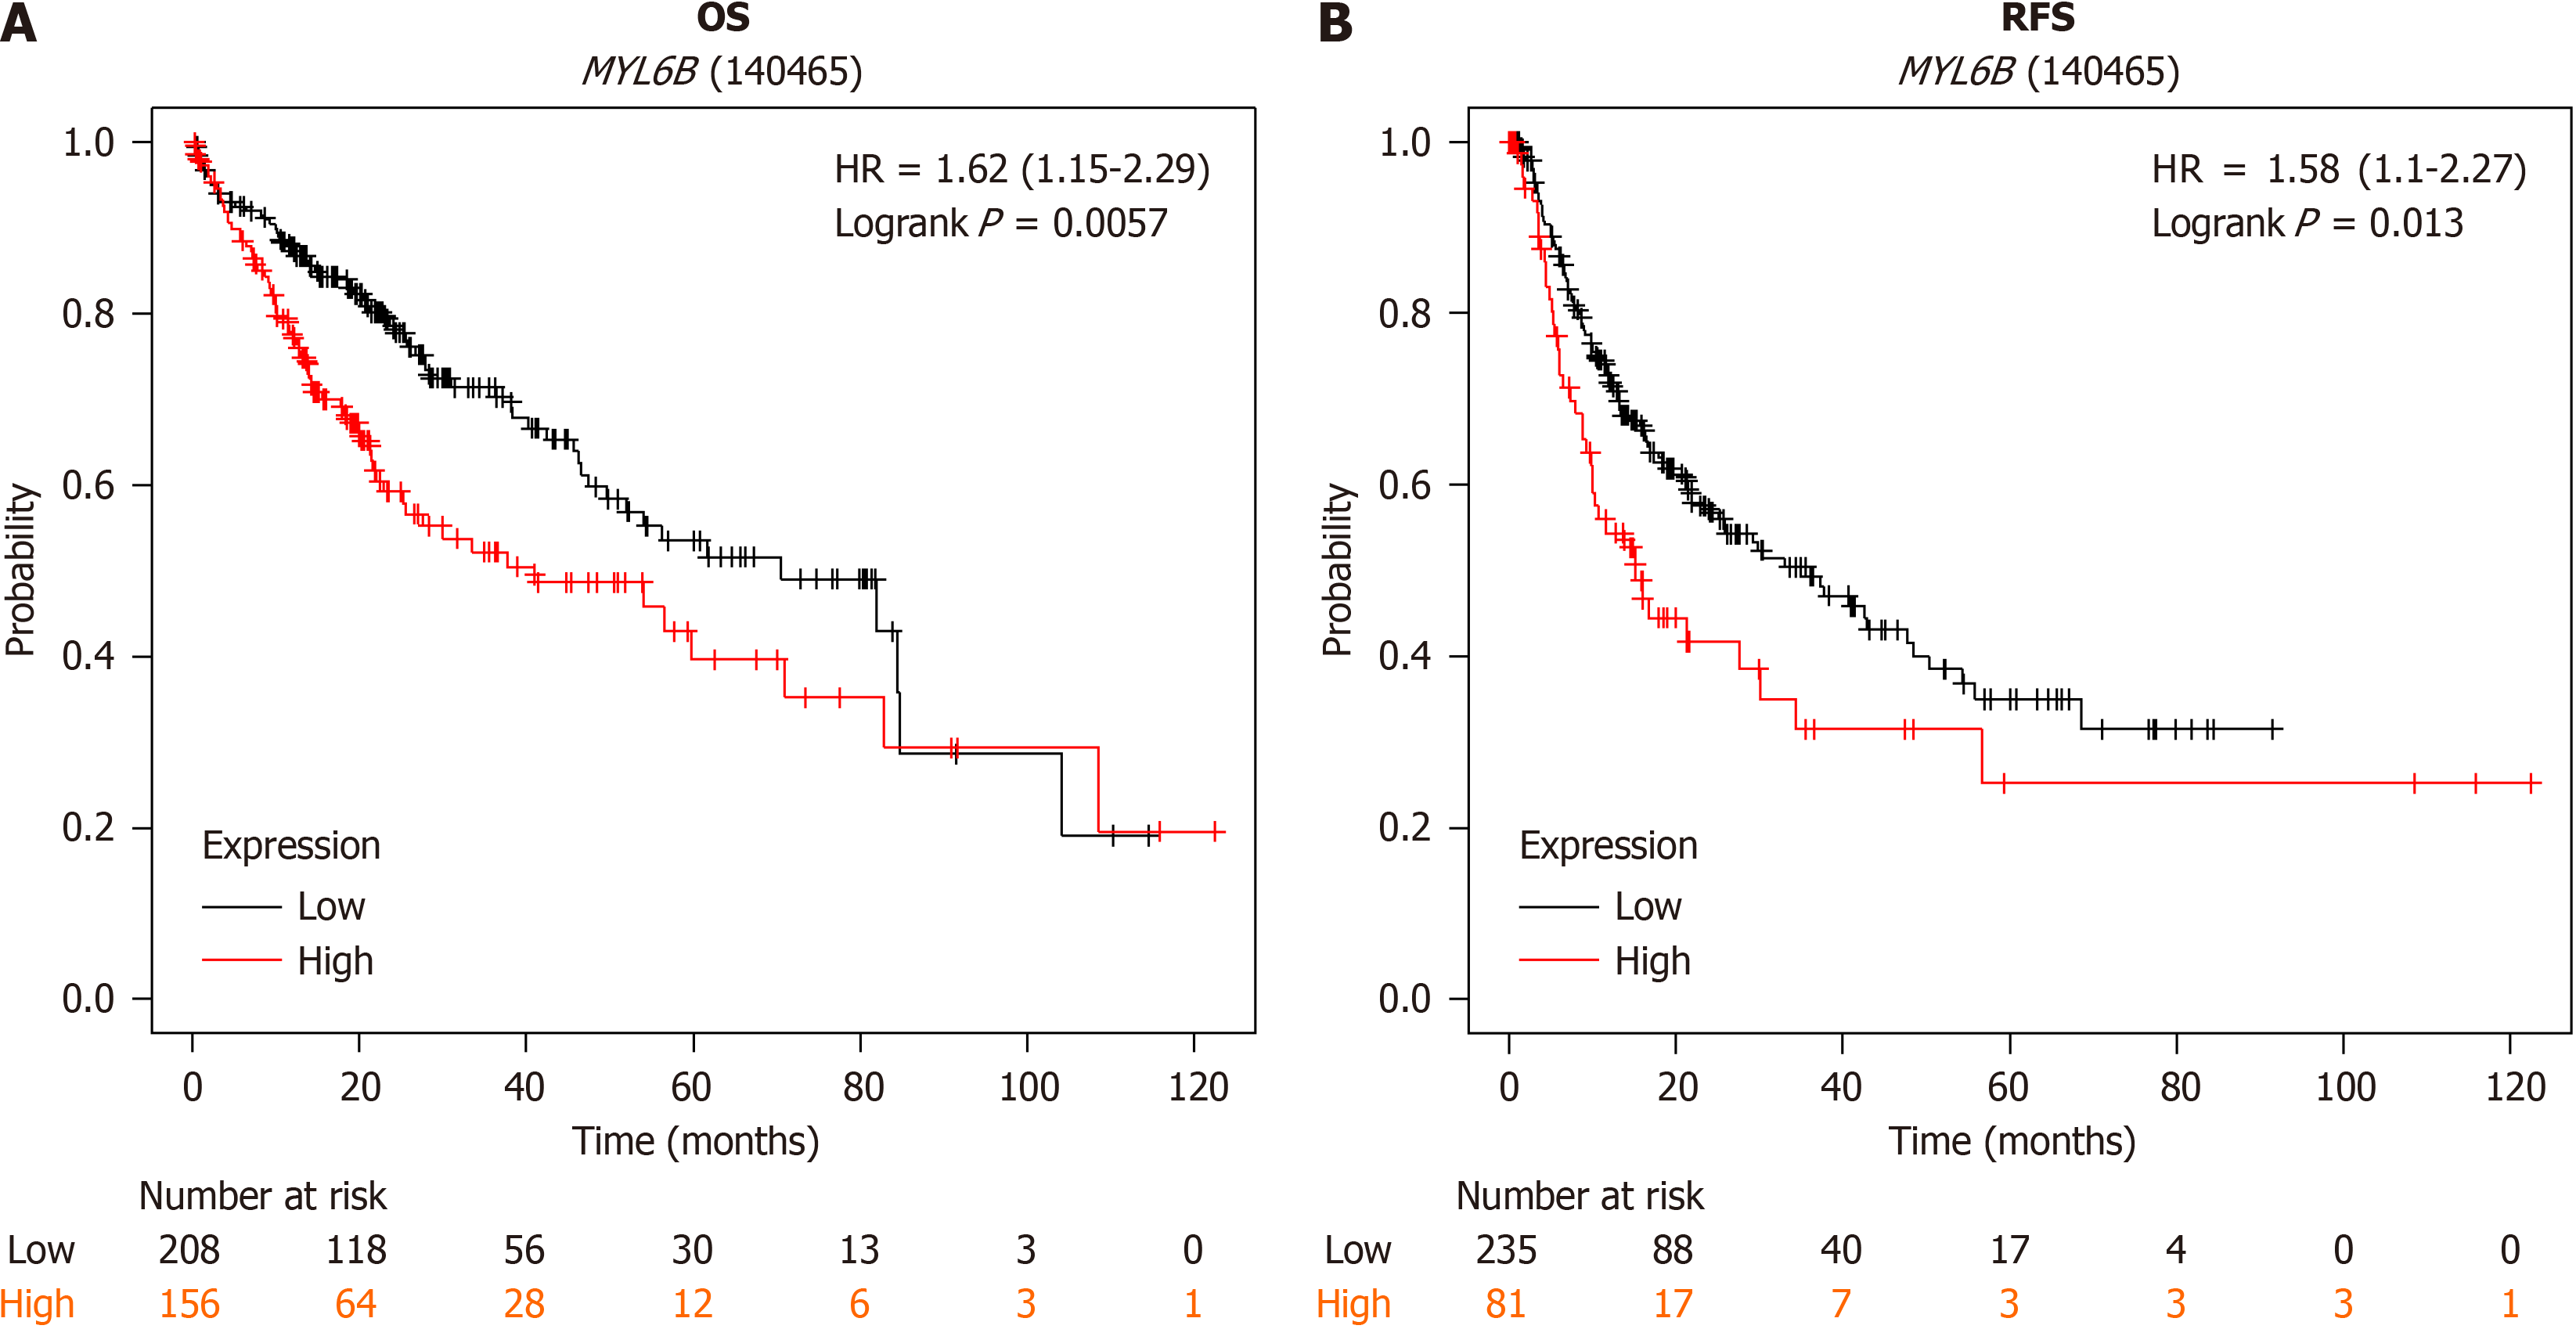
Figure 3 Relationship between MYL6B expression levels and prognosis in liver hepatocellular carcinoma.
A: Overall survival (n = 316); B: Progression-free survival (n = 370). OS: Overall survival; HR: Hazard ratio; RFS: Recurrence-free survival.
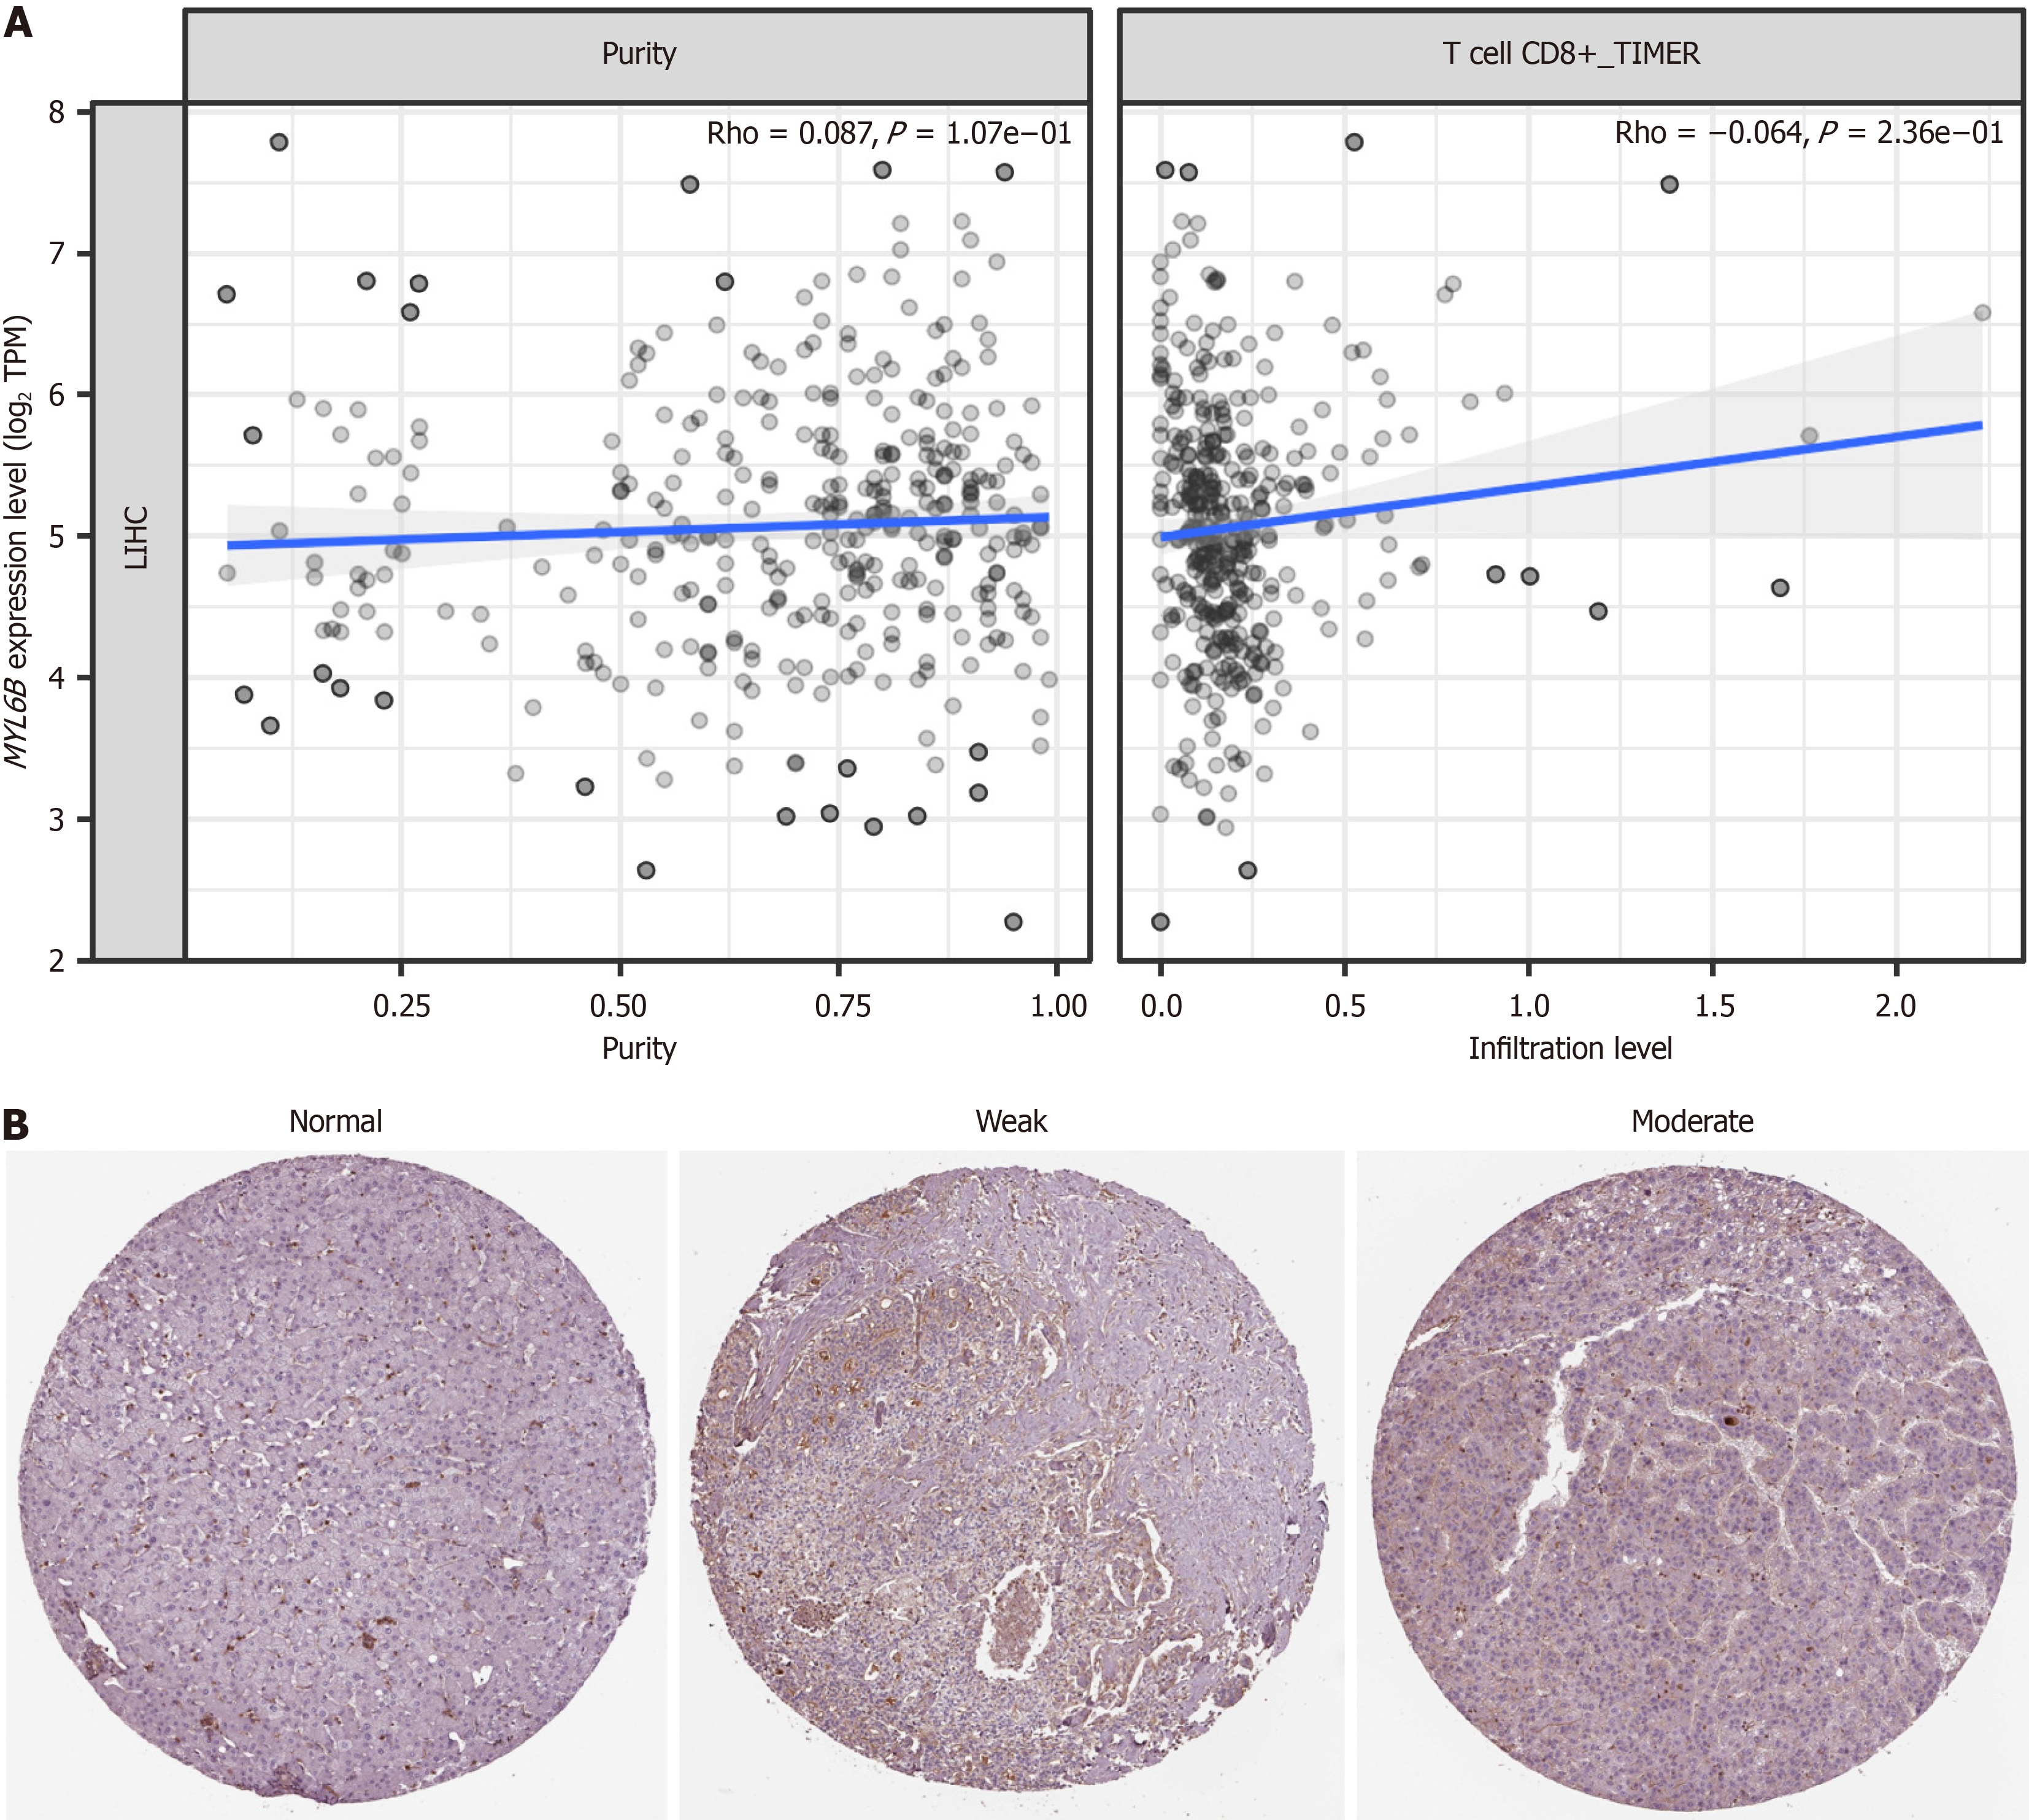
Figure 4 Immune infiltration and immunohistochemical analysis of MYL6B.
A: Relationship between CD8 + T cell immune infiltration levels and MYL6B expression levels; B: Immunohistochemical analysis of MYL6B in normal and cancer tissues.
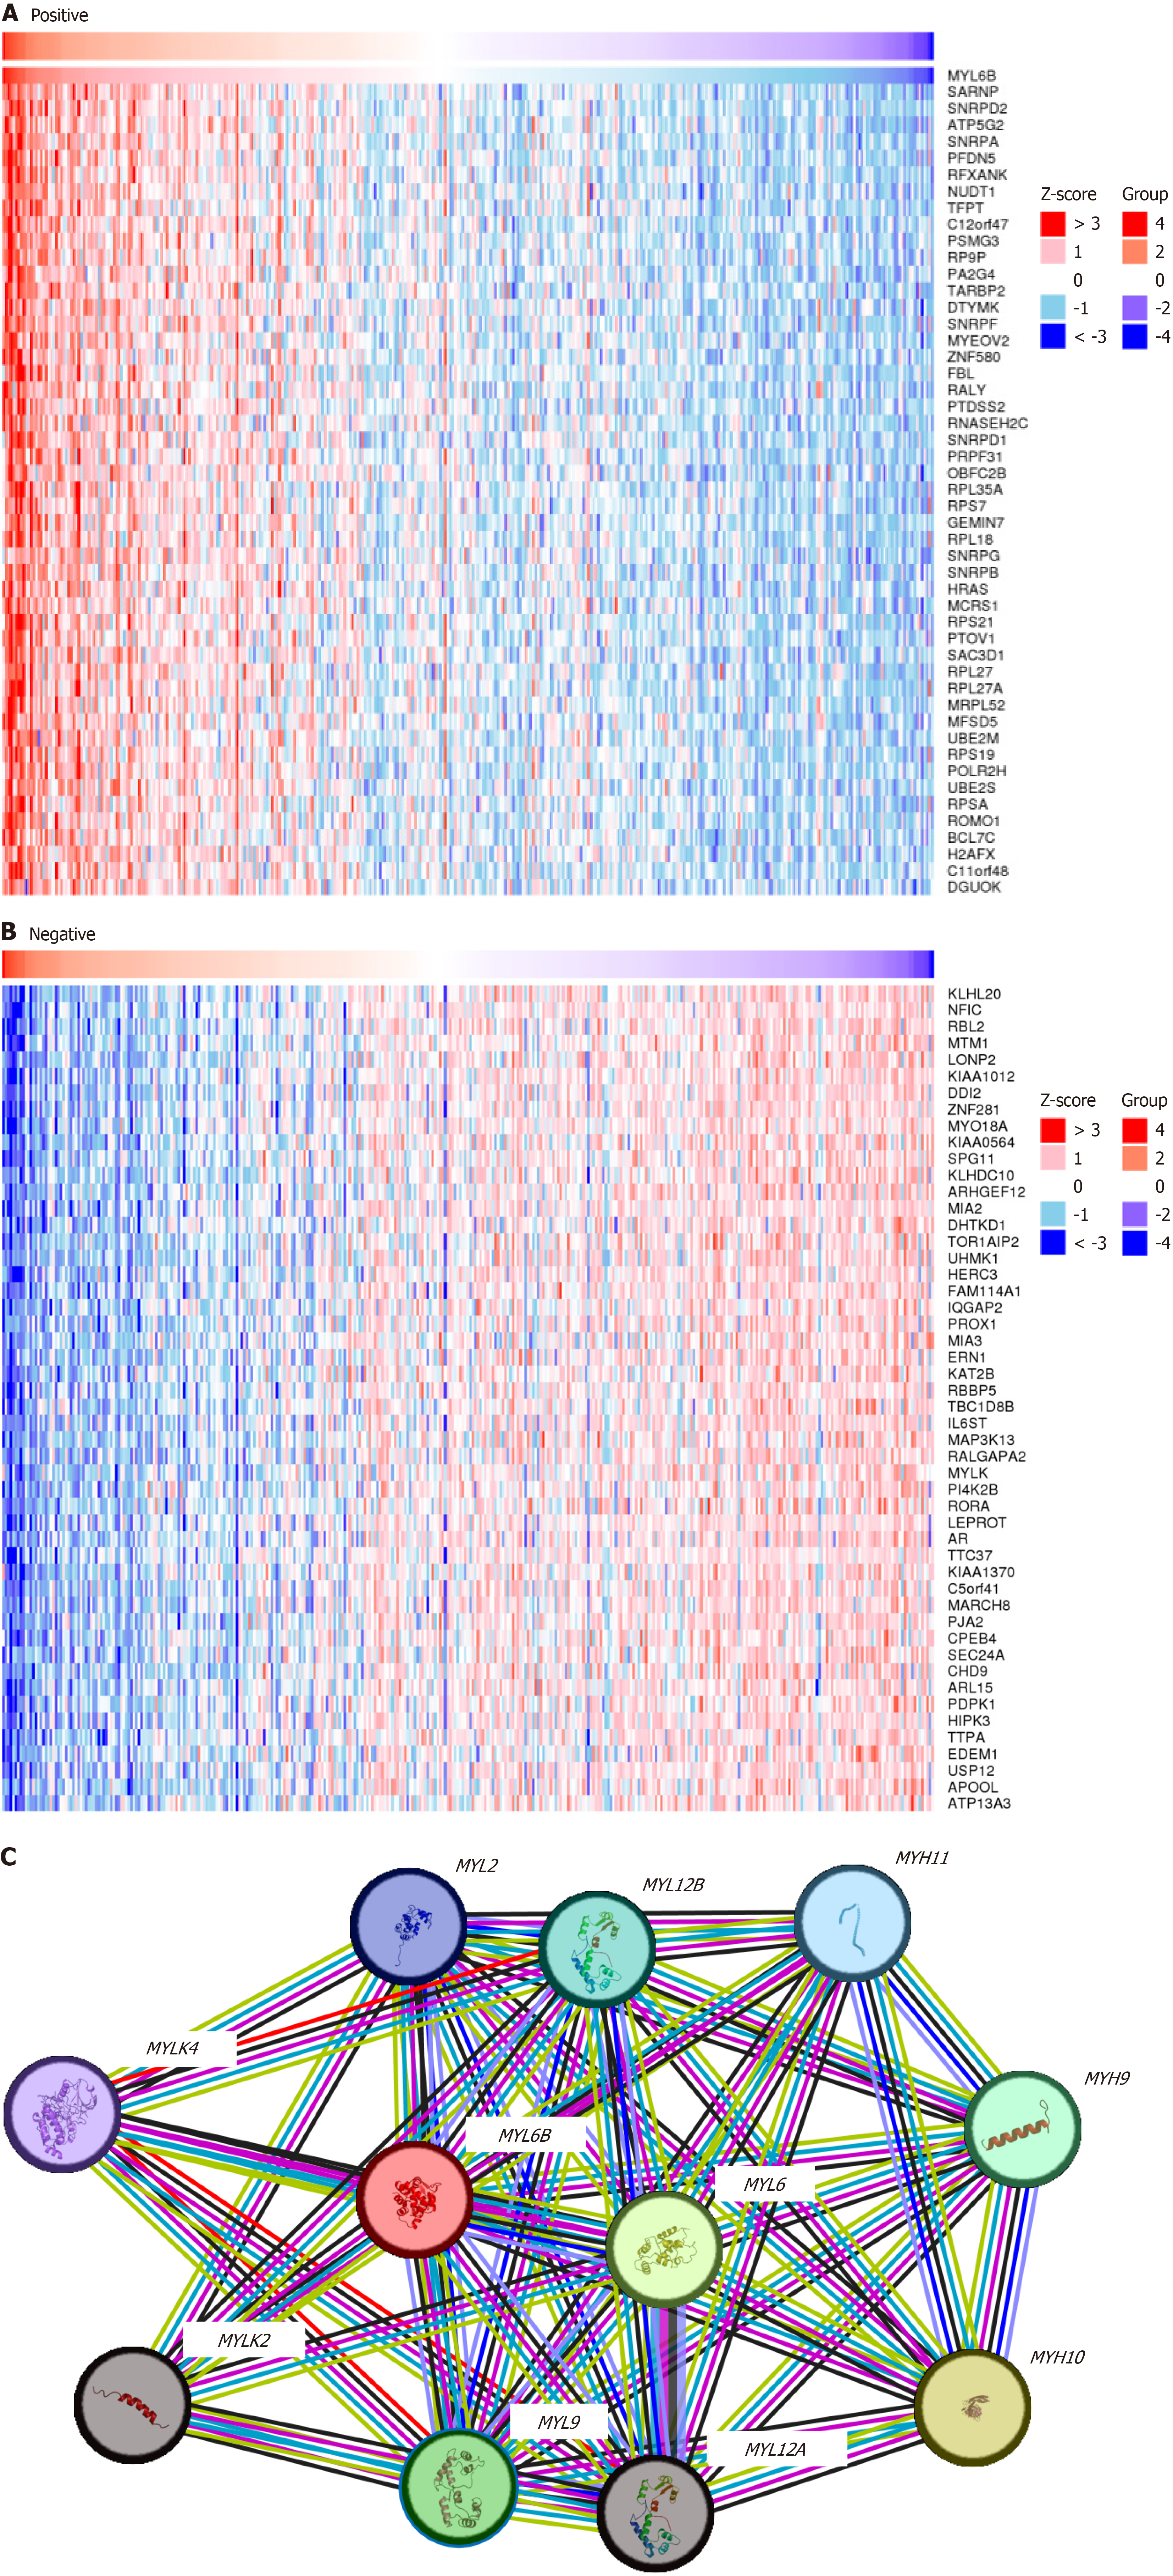
Figure 5 Expression of MYL6B-related genes and protein network.
A: Analysis of top 50 upregulated and downregulated genes related to MYL6B using LinkedOmic data; B: Analysis of MYL6B protein network using STRING database.
- Citation: Lv HB, Wu QY, Zhang YJ, Quan SW, Ma N, Dai YQ, Sun Y. Study on the expression and prognostic relationship of MYL6B in liver cancer based on bioinformatics. World J Clin Oncol 2024; 15(9): 1188-1197
- URL: https://www.wjgnet.com/2218-4333/full/v15/i9/1188.htm
- DOI: https://dx.doi.org/10.5306/wjco.v15.i9.1188


