©The Author(s) 2024.
World J Clin Oncol. Mar 24, 2024; 15(3): 447-455
Published online Mar 24, 2024. doi: 10.5306/wjco.v15.i3.447
Published online Mar 24, 2024. doi: 10.5306/wjco.v15.i3.447
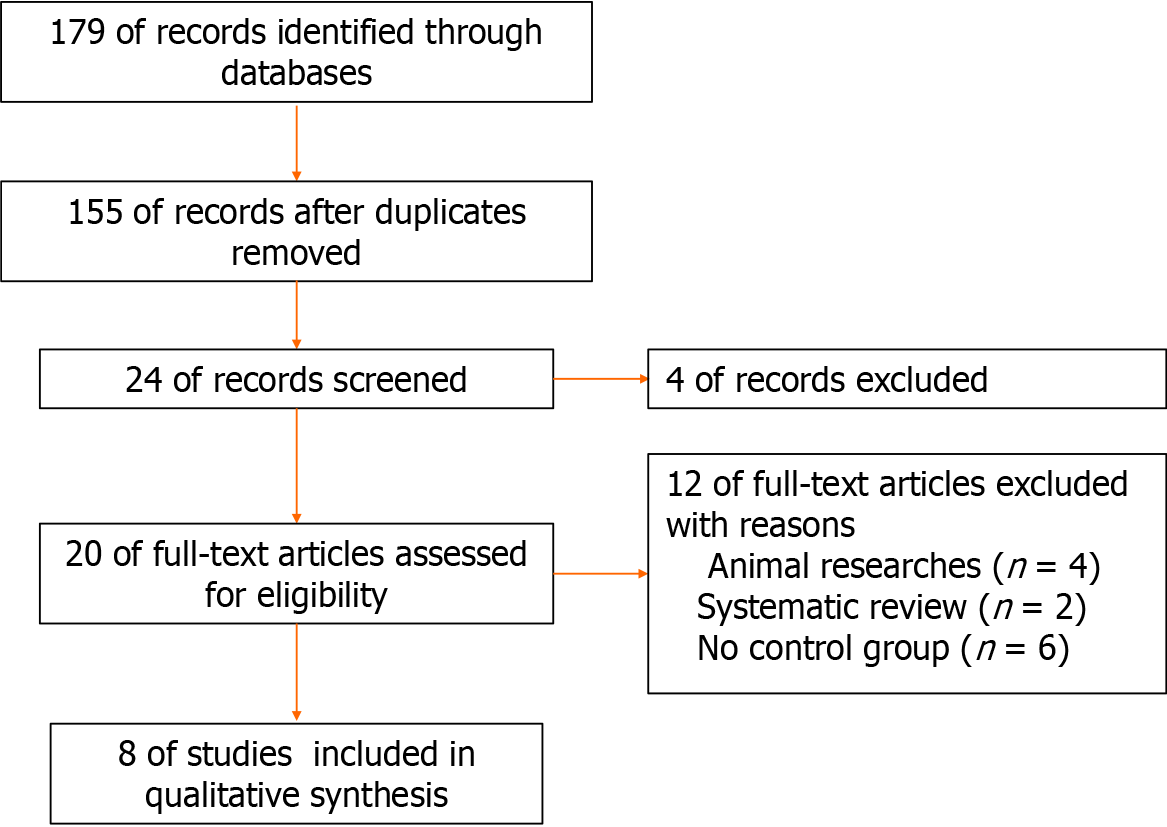
Figure 1 Flowchart of the meta-analysis.
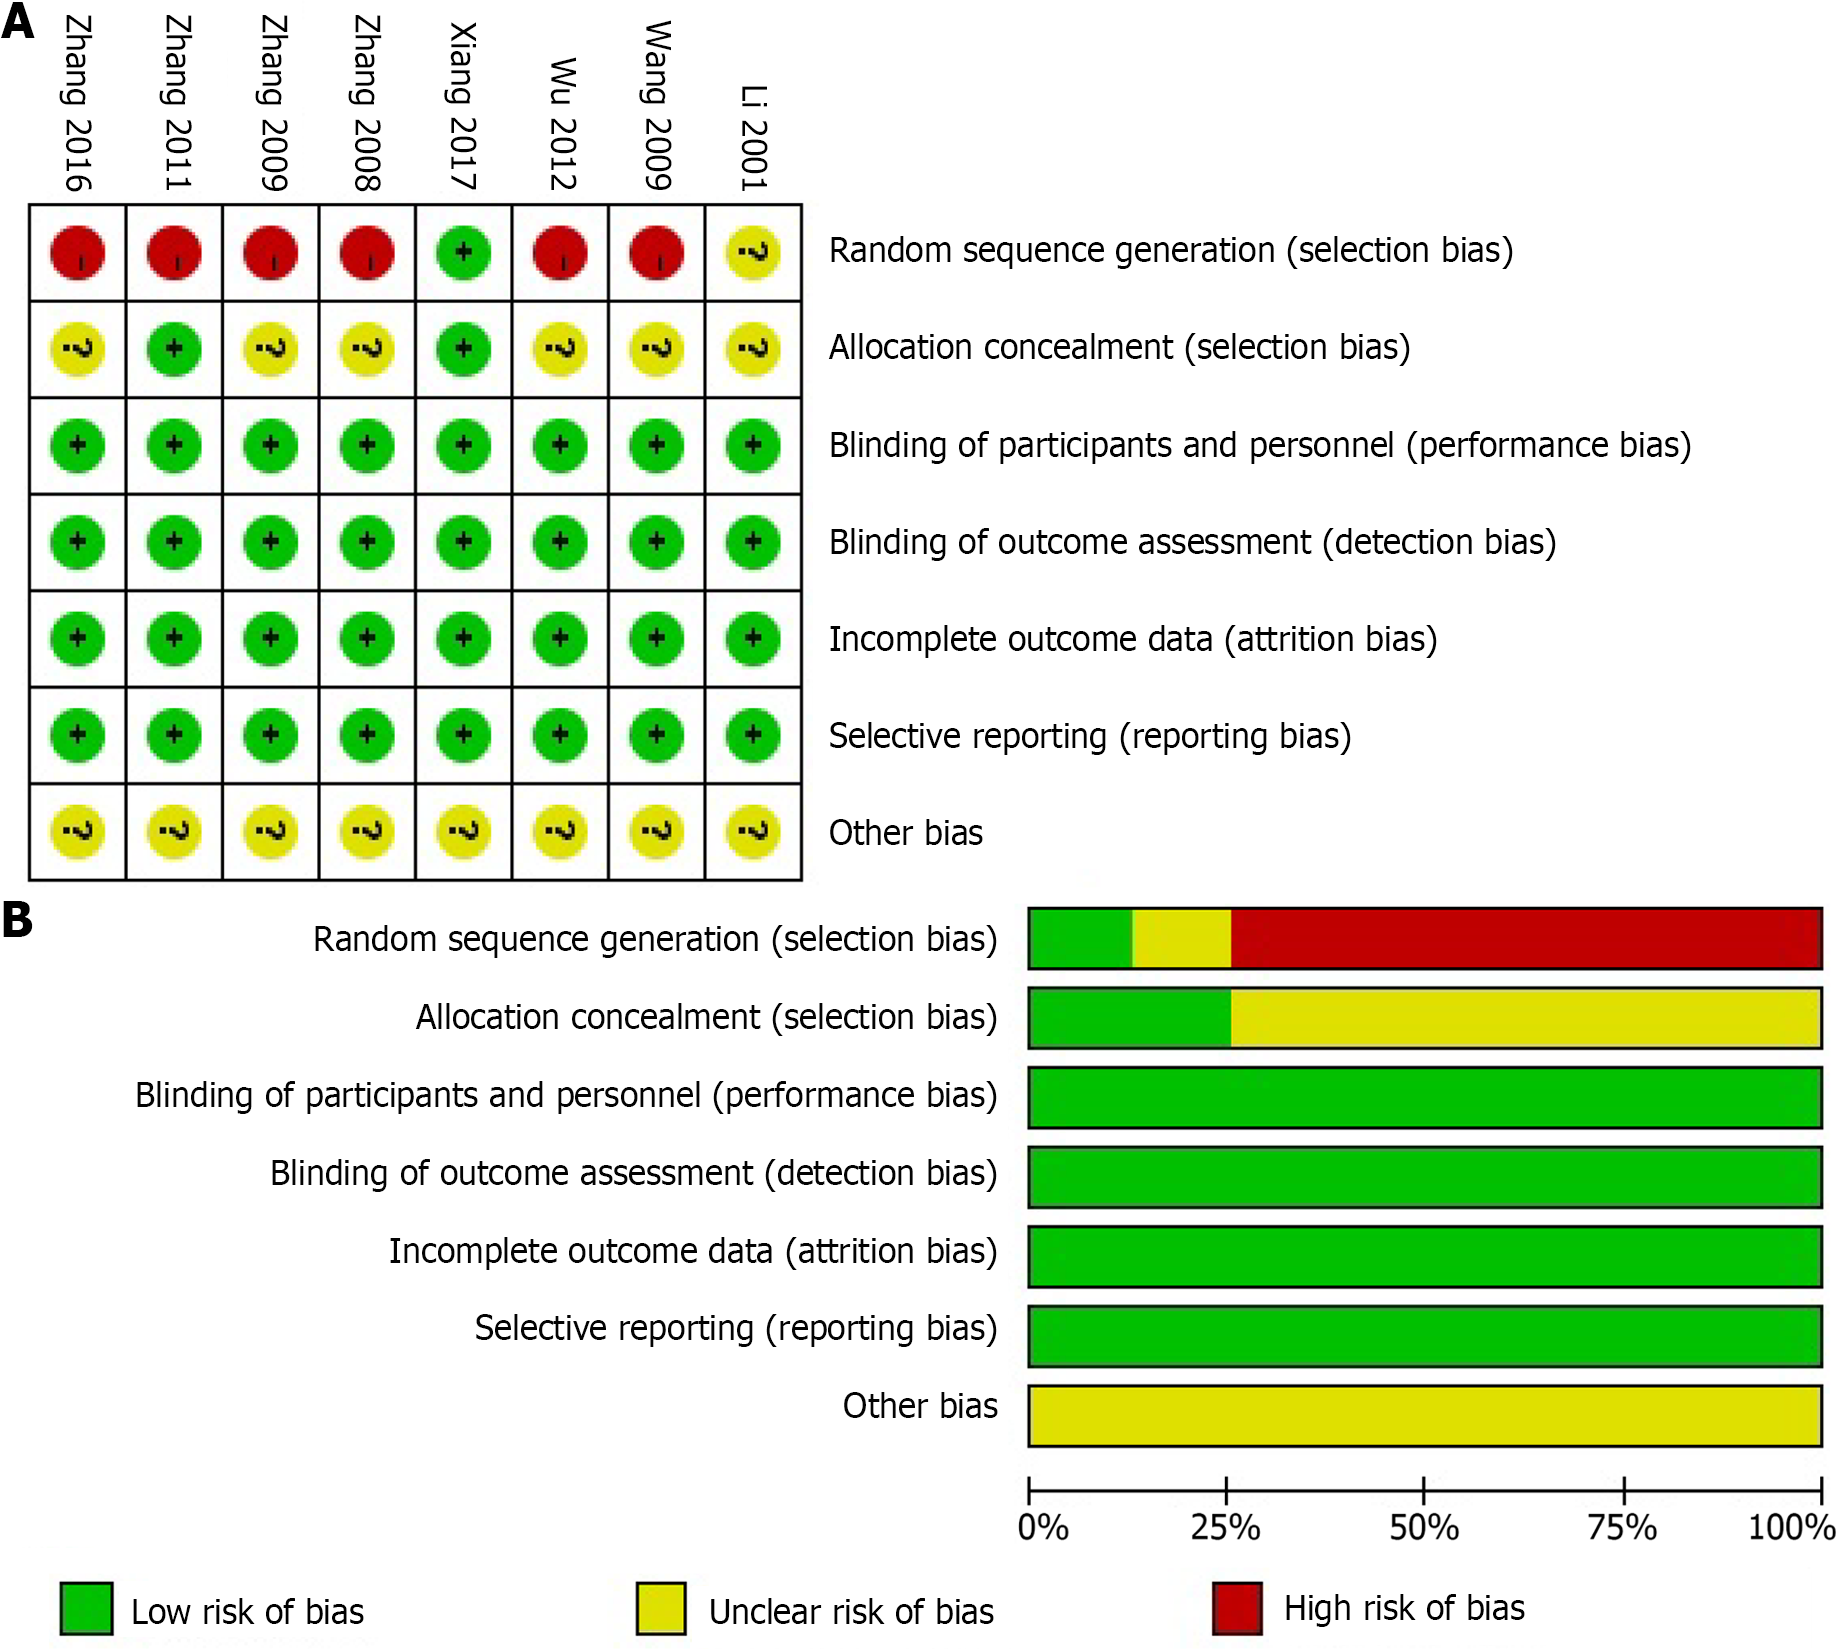
Figure 2 Risk of bias summary and bias graph.
A: Review authors’ judgements about each risk of bias item for each included study; B: Review authors' judgements about each risk of bias item presented as percentages across all included studies. −: High risk; +: Low risk; ?: Unclear risk.
Figure 3 Forest plot of changes of main portal vein pressure.
Figure 4 Forest plots of cumulative stent patency rates at 6 and 12 months.
A: 6 months; B: 12 months.
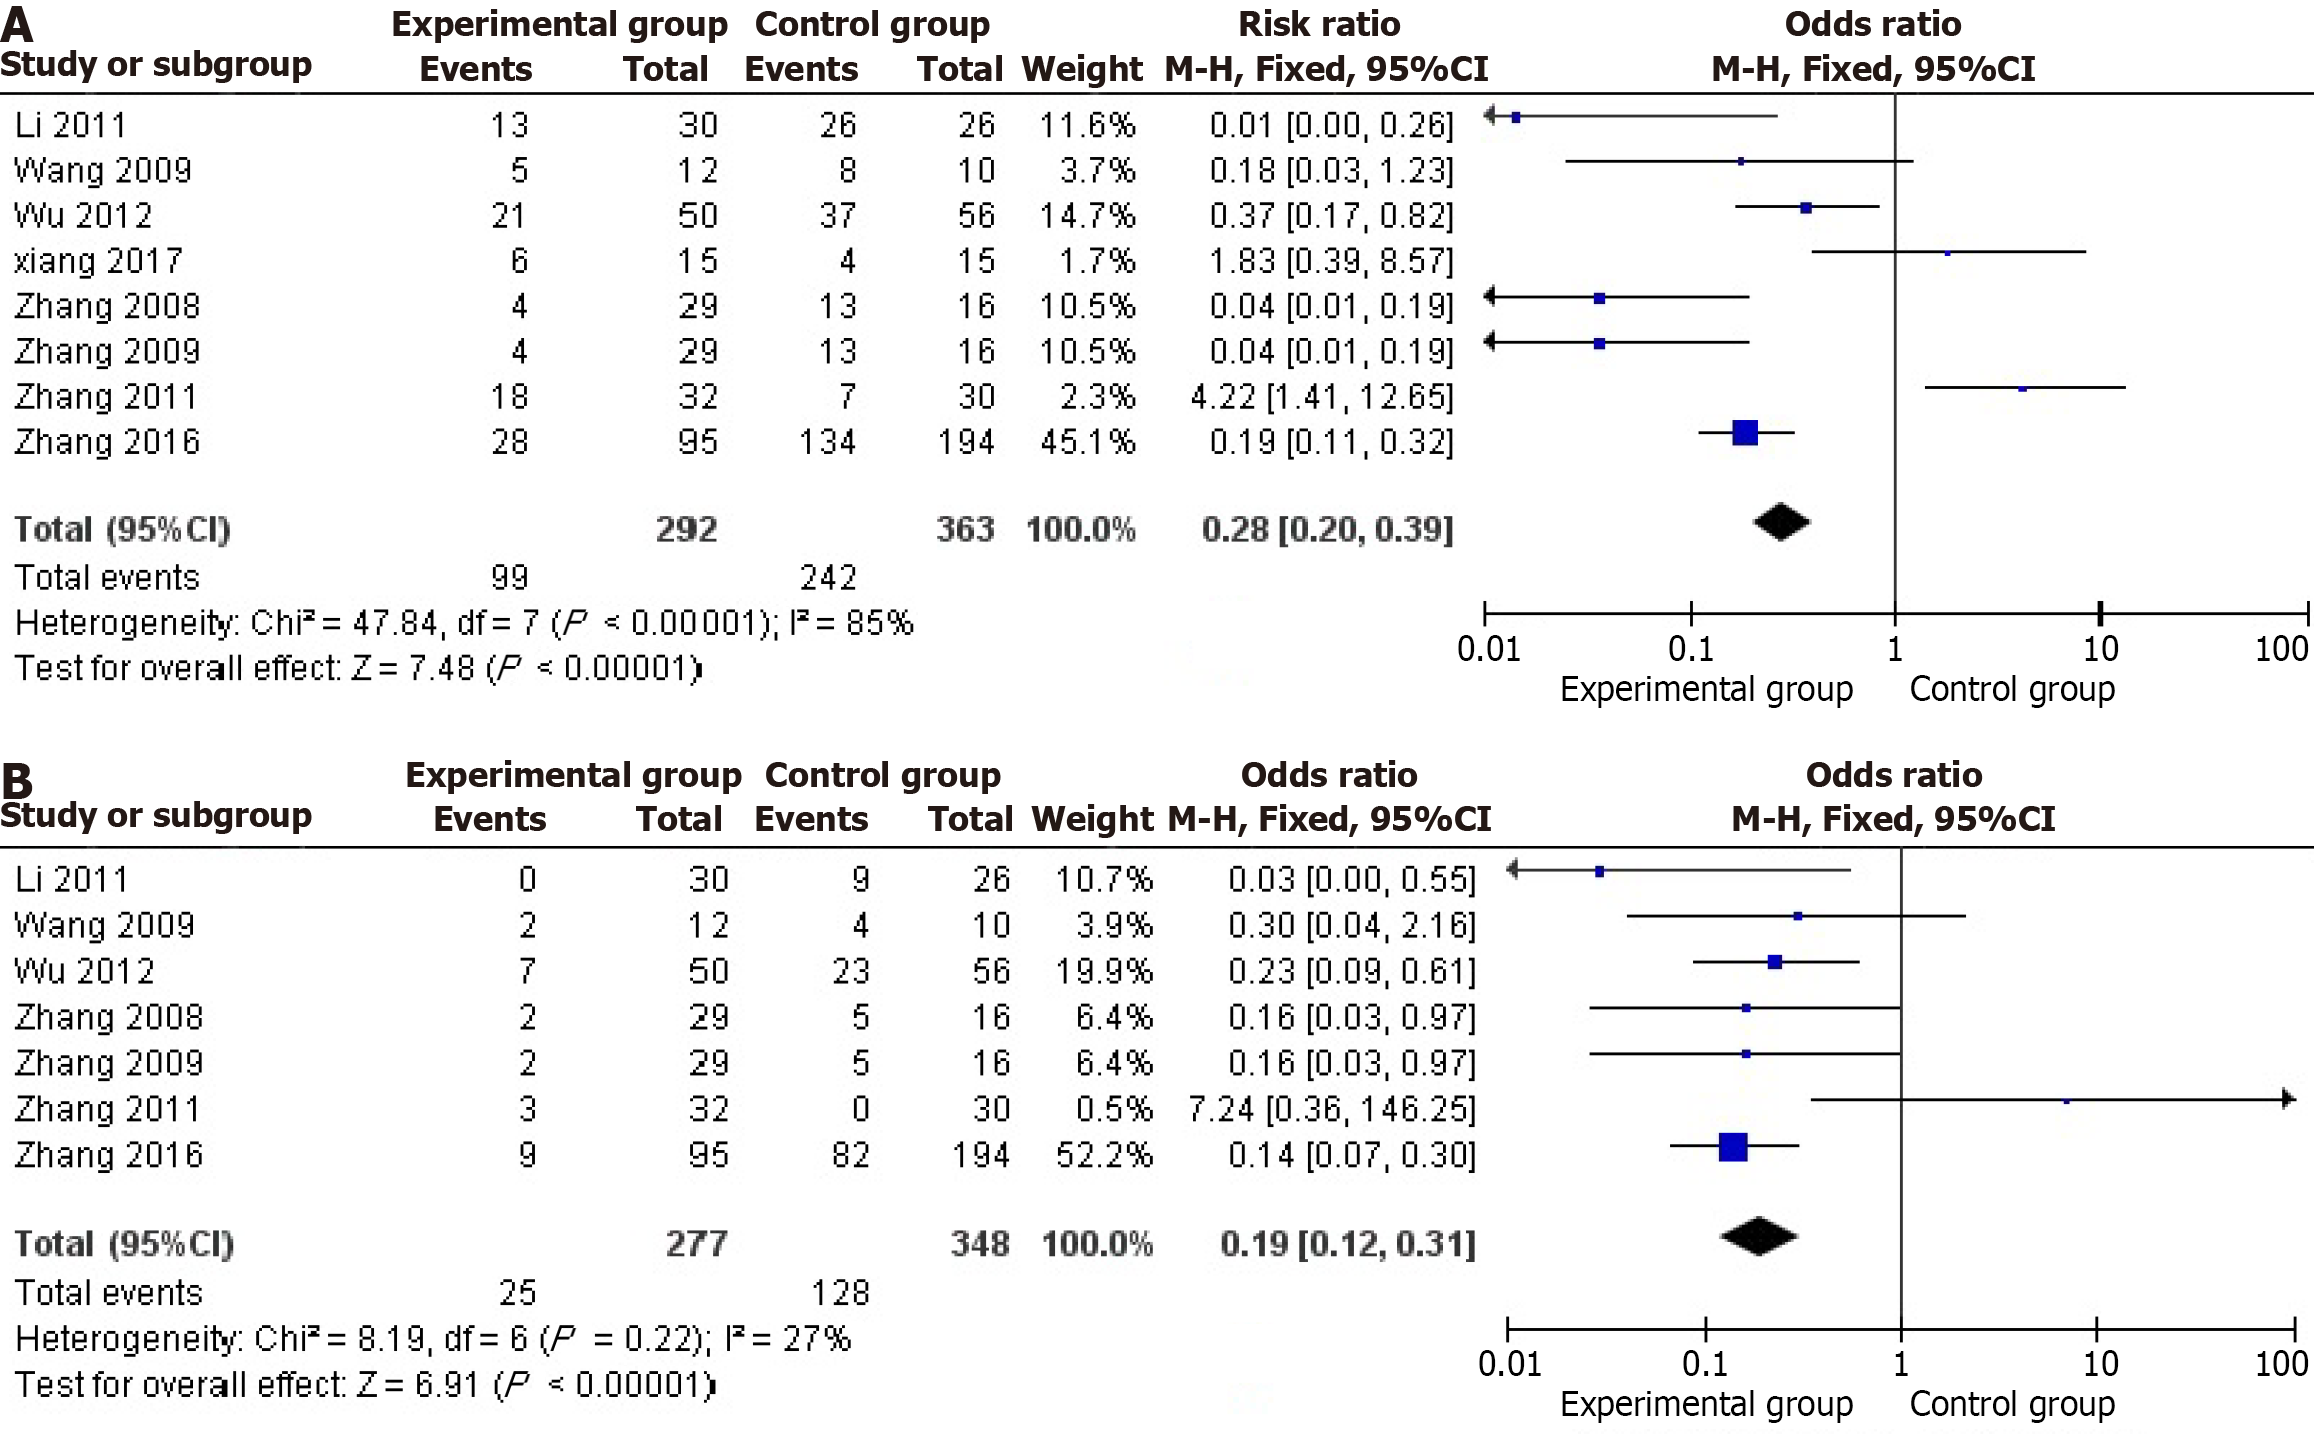
Figure 5 Forest plots of survival rates at 6 and 12 months.
A: 6 months; B: 12 months.
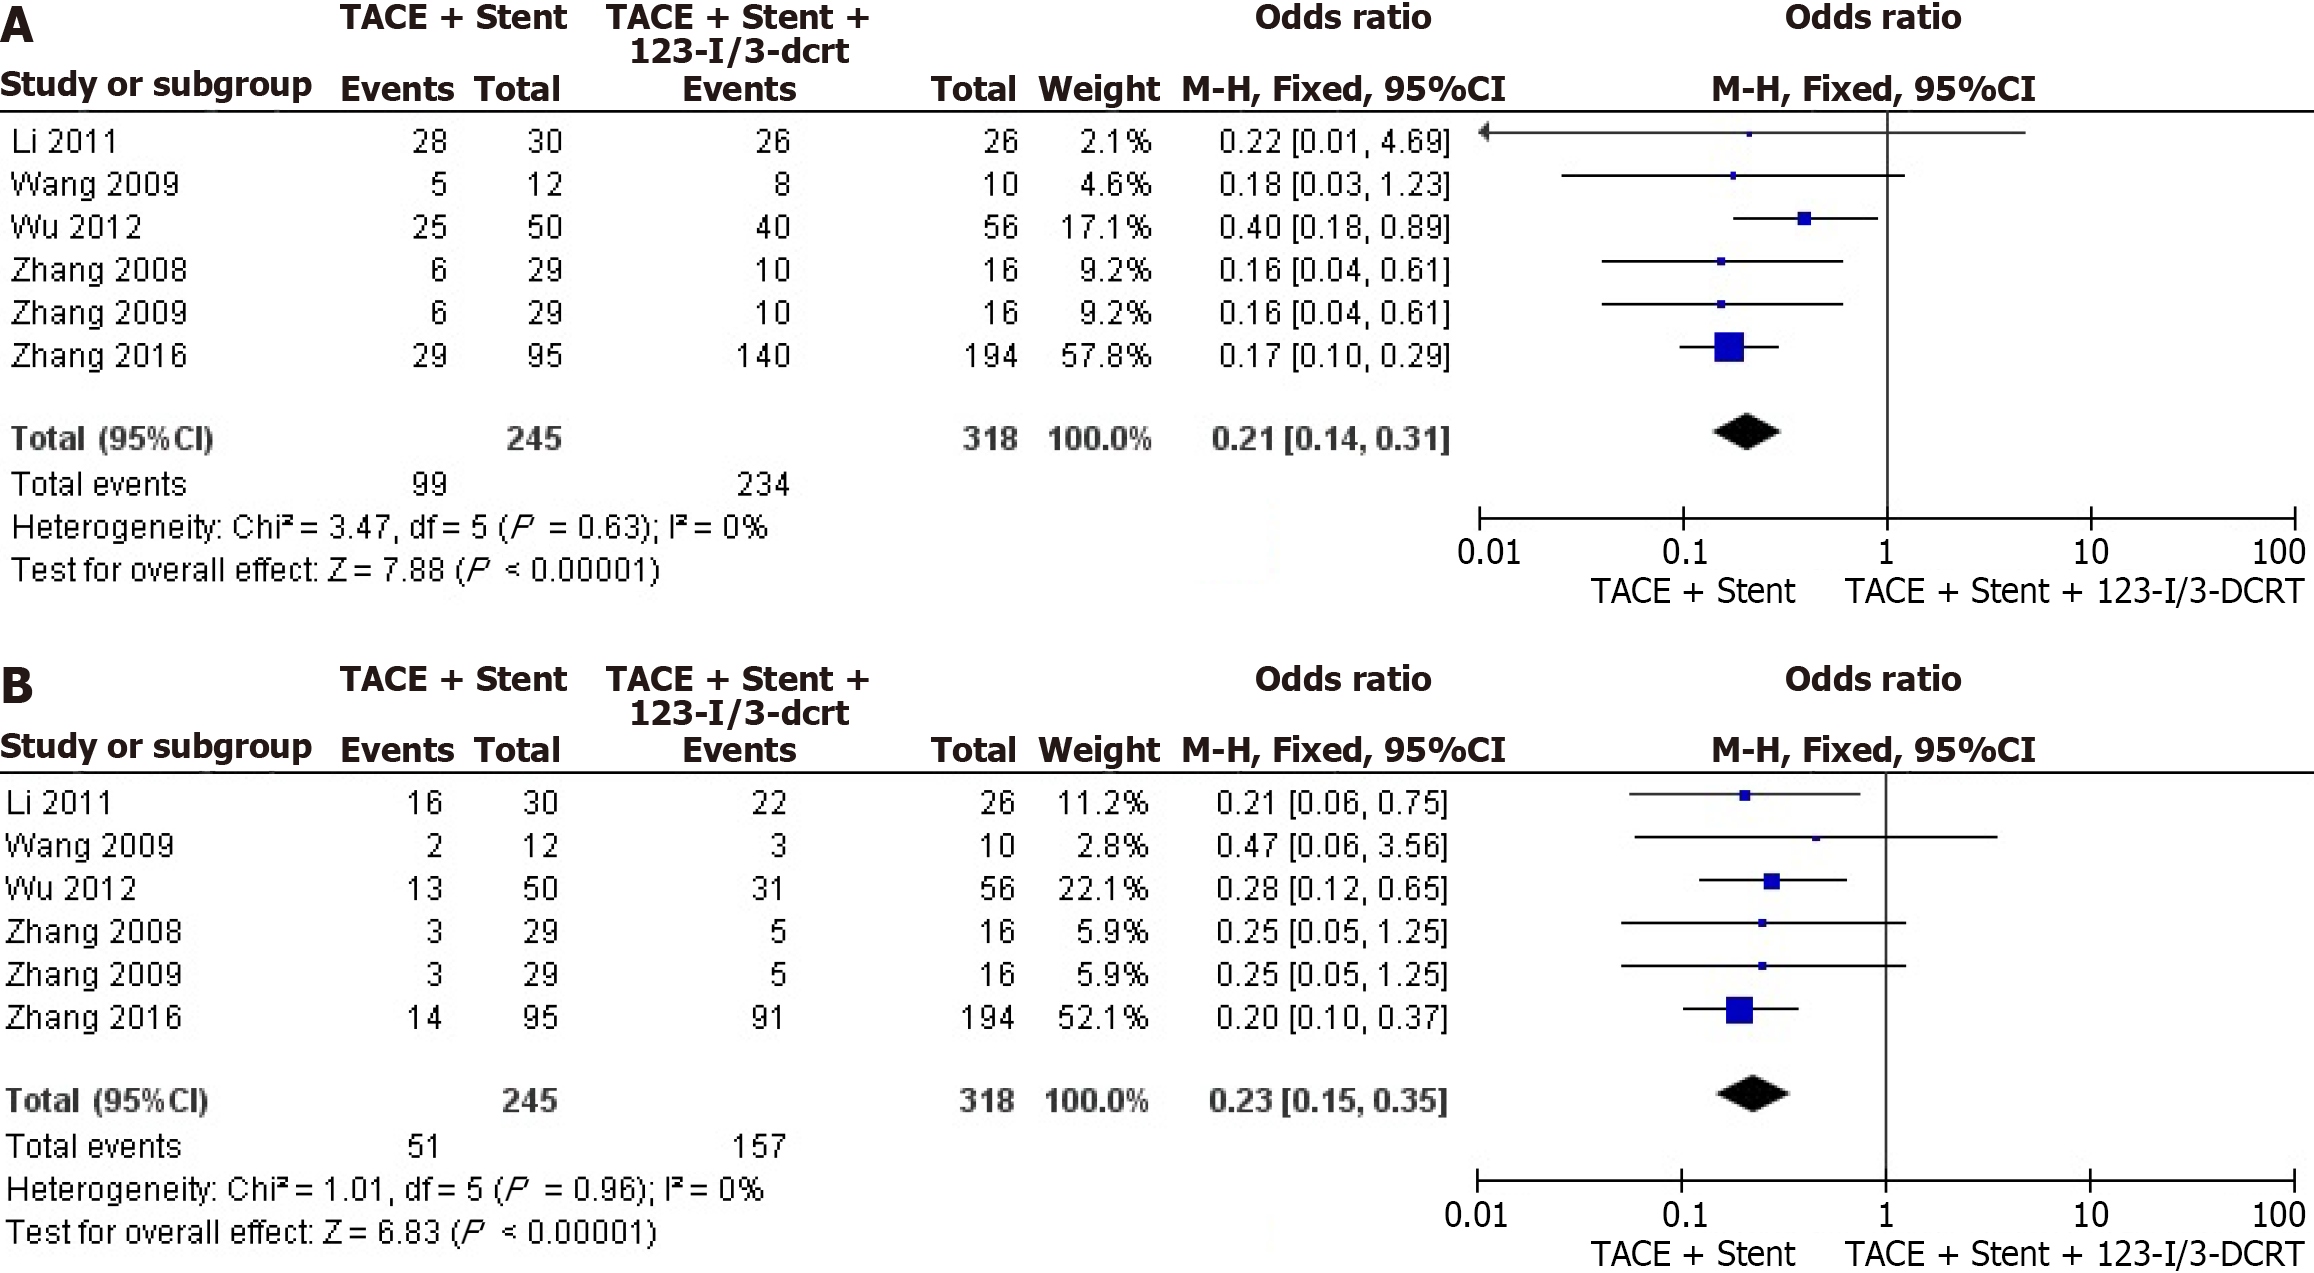
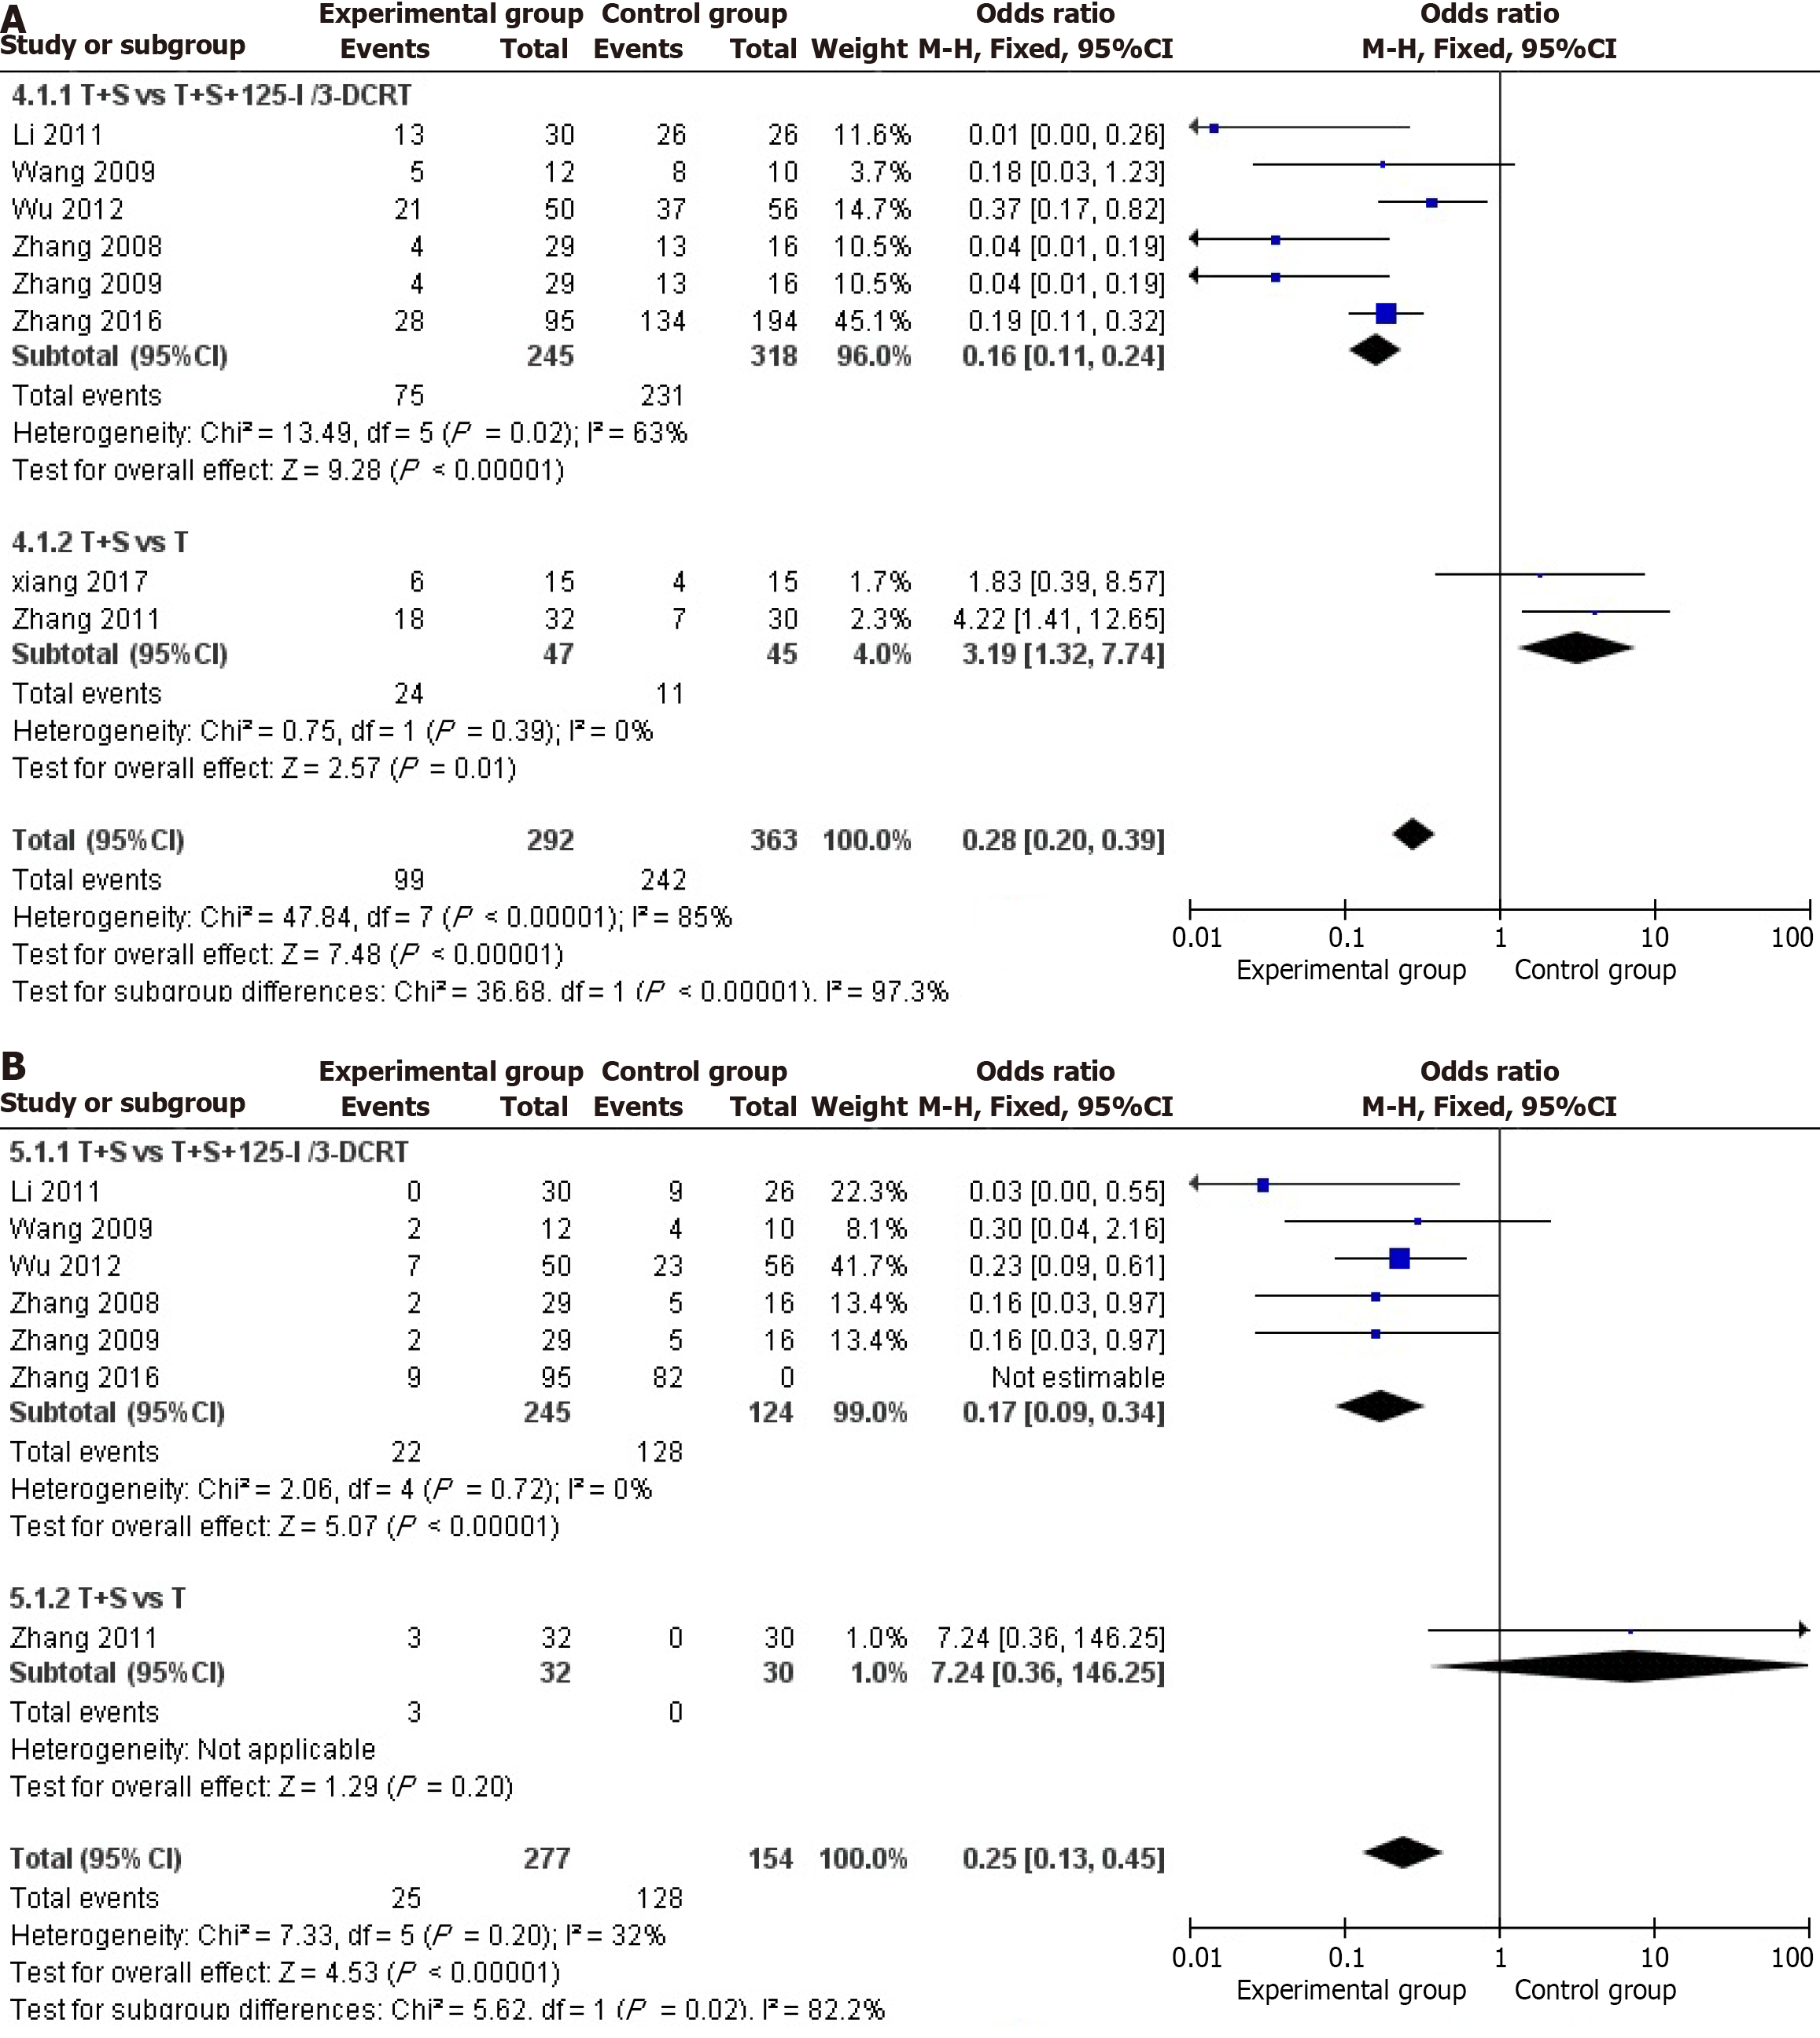
Figure 6 Forest plots of subgroup analysis.
A: 6 months; B: 12 months.
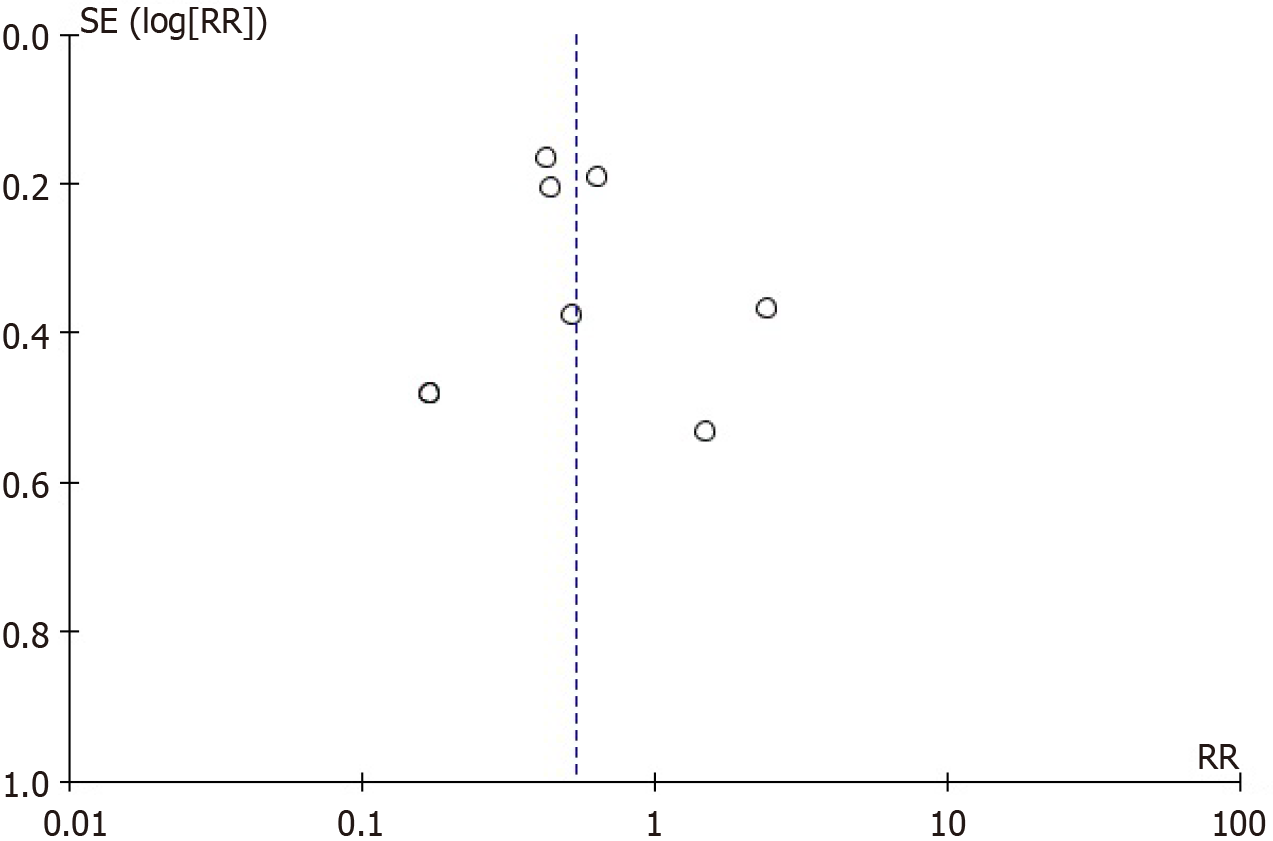
Figure 7 Funnel plot of included studies.
- Citation: Sui WF, Li JY, Fu JH. Transarterial chemoembolization plus stent placement for hepatocellular carcinoma with main portal vein tumor thrombosis: A meta-analysis. World J Clin Oncol 2024; 15(3): 447-455
- URL: https://www.wjgnet.com/2218-4333/full/v15/i3/447.htm
- DOI: https://dx.doi.org/10.5306/wjco.v15.i3.447


