Copyright
©The Author(s) 2025.
World J Radiol. Sep 28, 2025; 17(9): 112173
Published online Sep 28, 2025. doi: 10.4329/wjr.v17.i9.112173
Published online Sep 28, 2025. doi: 10.4329/wjr.v17.i9.112173
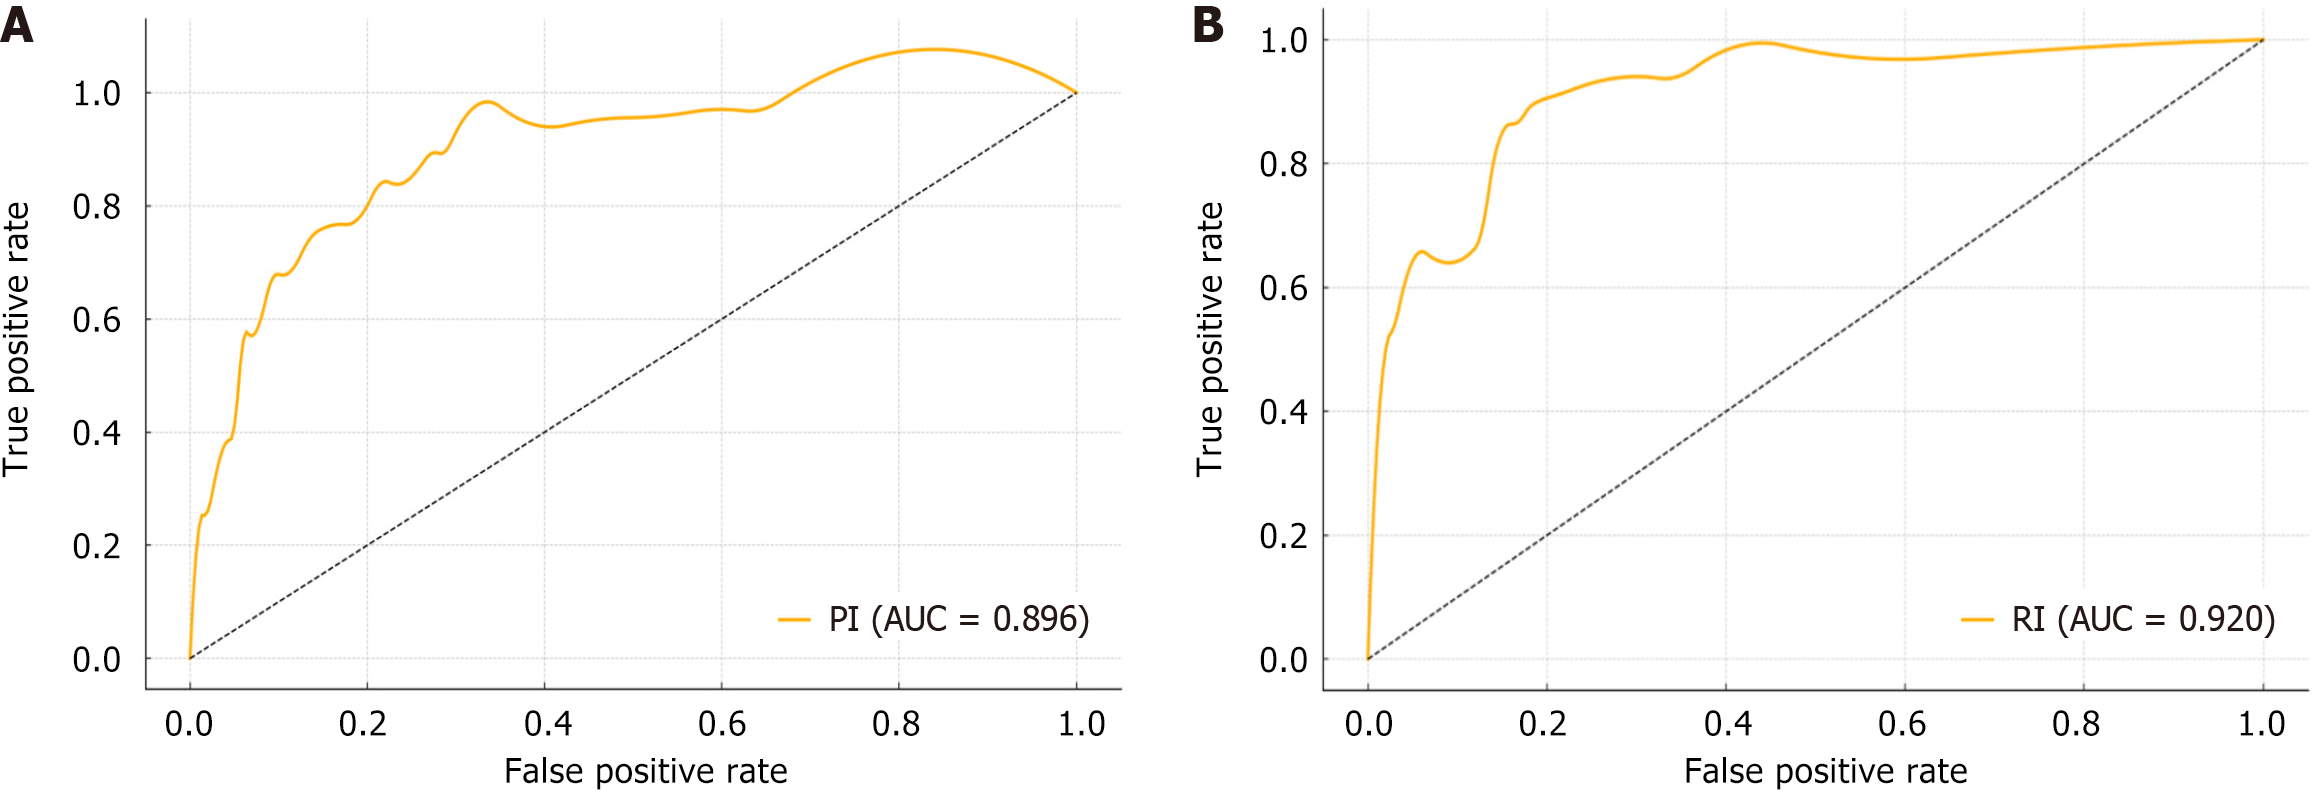
Figure 1 Diagnostic performance.
A: Pulsatility index; B: Resistive index. PI: Pulsatility index; AUC: Area under the curve; RI: Resistive index.
Figure 2 Normal and abnormal uterine artery Doppler at 13 weeks of gestation.
A: Uterine artery Doppler waveform in a 13-week pregnant woman with normal pregnancy outcome; B: High pulsatility index in uterine artery with presence of diastolic notching in a 13-week pregnant woman who subsequently developed pre-eclampsia. PS: Peak systolic velocity; ED: End diastolic velocity; TAmax: Time-averaged maximum velocity; PI: Pulsatility index; RI: Resistive index; HR: Heart rate; TAmean: Time-averaged mean velocity.
- Citation: Parry AH, Hassan I, Rehaman B, Bhat SA, Mir S, Khan NA, Bhat IM, Ashraf S. Uterine artery Doppler at 11-14 weeks of gestation in the prediction of preeclampsia: An observational study. World J Radiol 2025; 17(9): 112173
- URL: https://www.wjgnet.com/1949-8470/full/v17/i9/112173.htm
- DOI: https://dx.doi.org/10.4329/wjr.v17.i9.112173


