©The Author(s) 2024.
World J Radiol. Oct 28, 2024; 16(10): 600-607
Published online Oct 28, 2024. doi: 10.4329/wjr.v16.i10.600
Published online Oct 28, 2024. doi: 10.4329/wjr.v16.i10.600
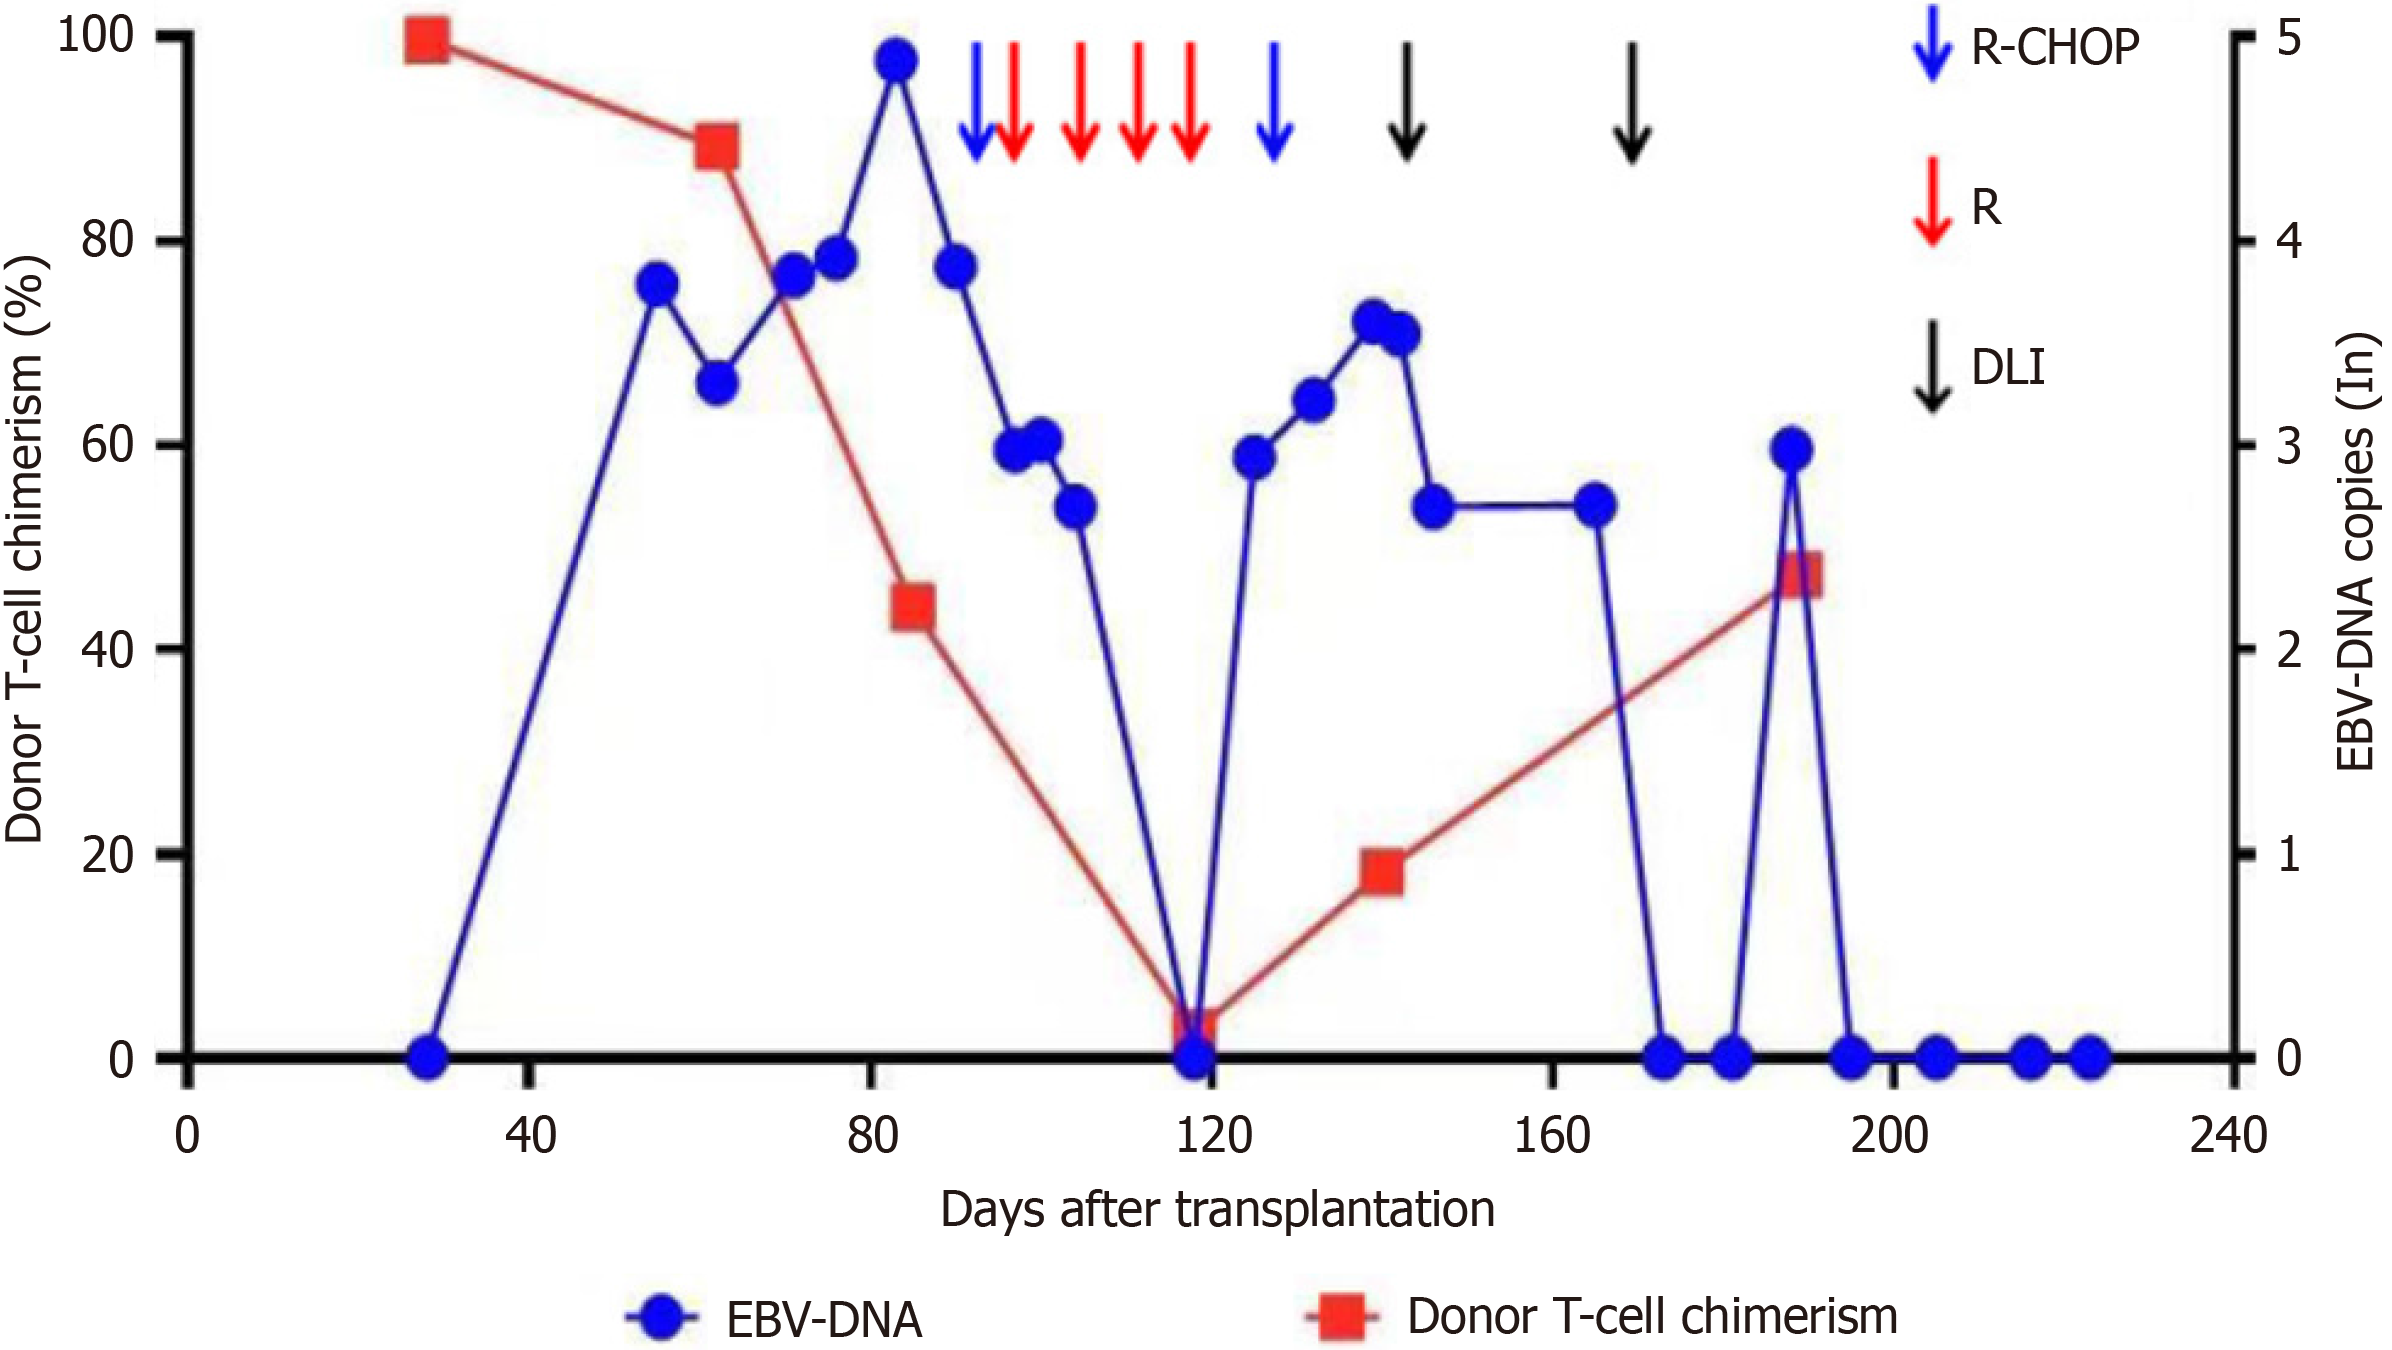
Figure 1 Treatment process, donor T-cell chimerism, and peripheral blood Epstein-Barr virus-DNA copies.
EBV: Epstein-Barr virus.
Figure 2 Lymph node biopsy showing diffuse infiltration of heterogeneous lymphoid cells with extensive necrosis and diffuse Epstein-Barr virus positivity.
A: HE staining (× 40); B: HE staining (× 200); C: CD20 positivity; D: 50% positivity for Ki-67; E: CD3 negativity; F: EBER positivity.
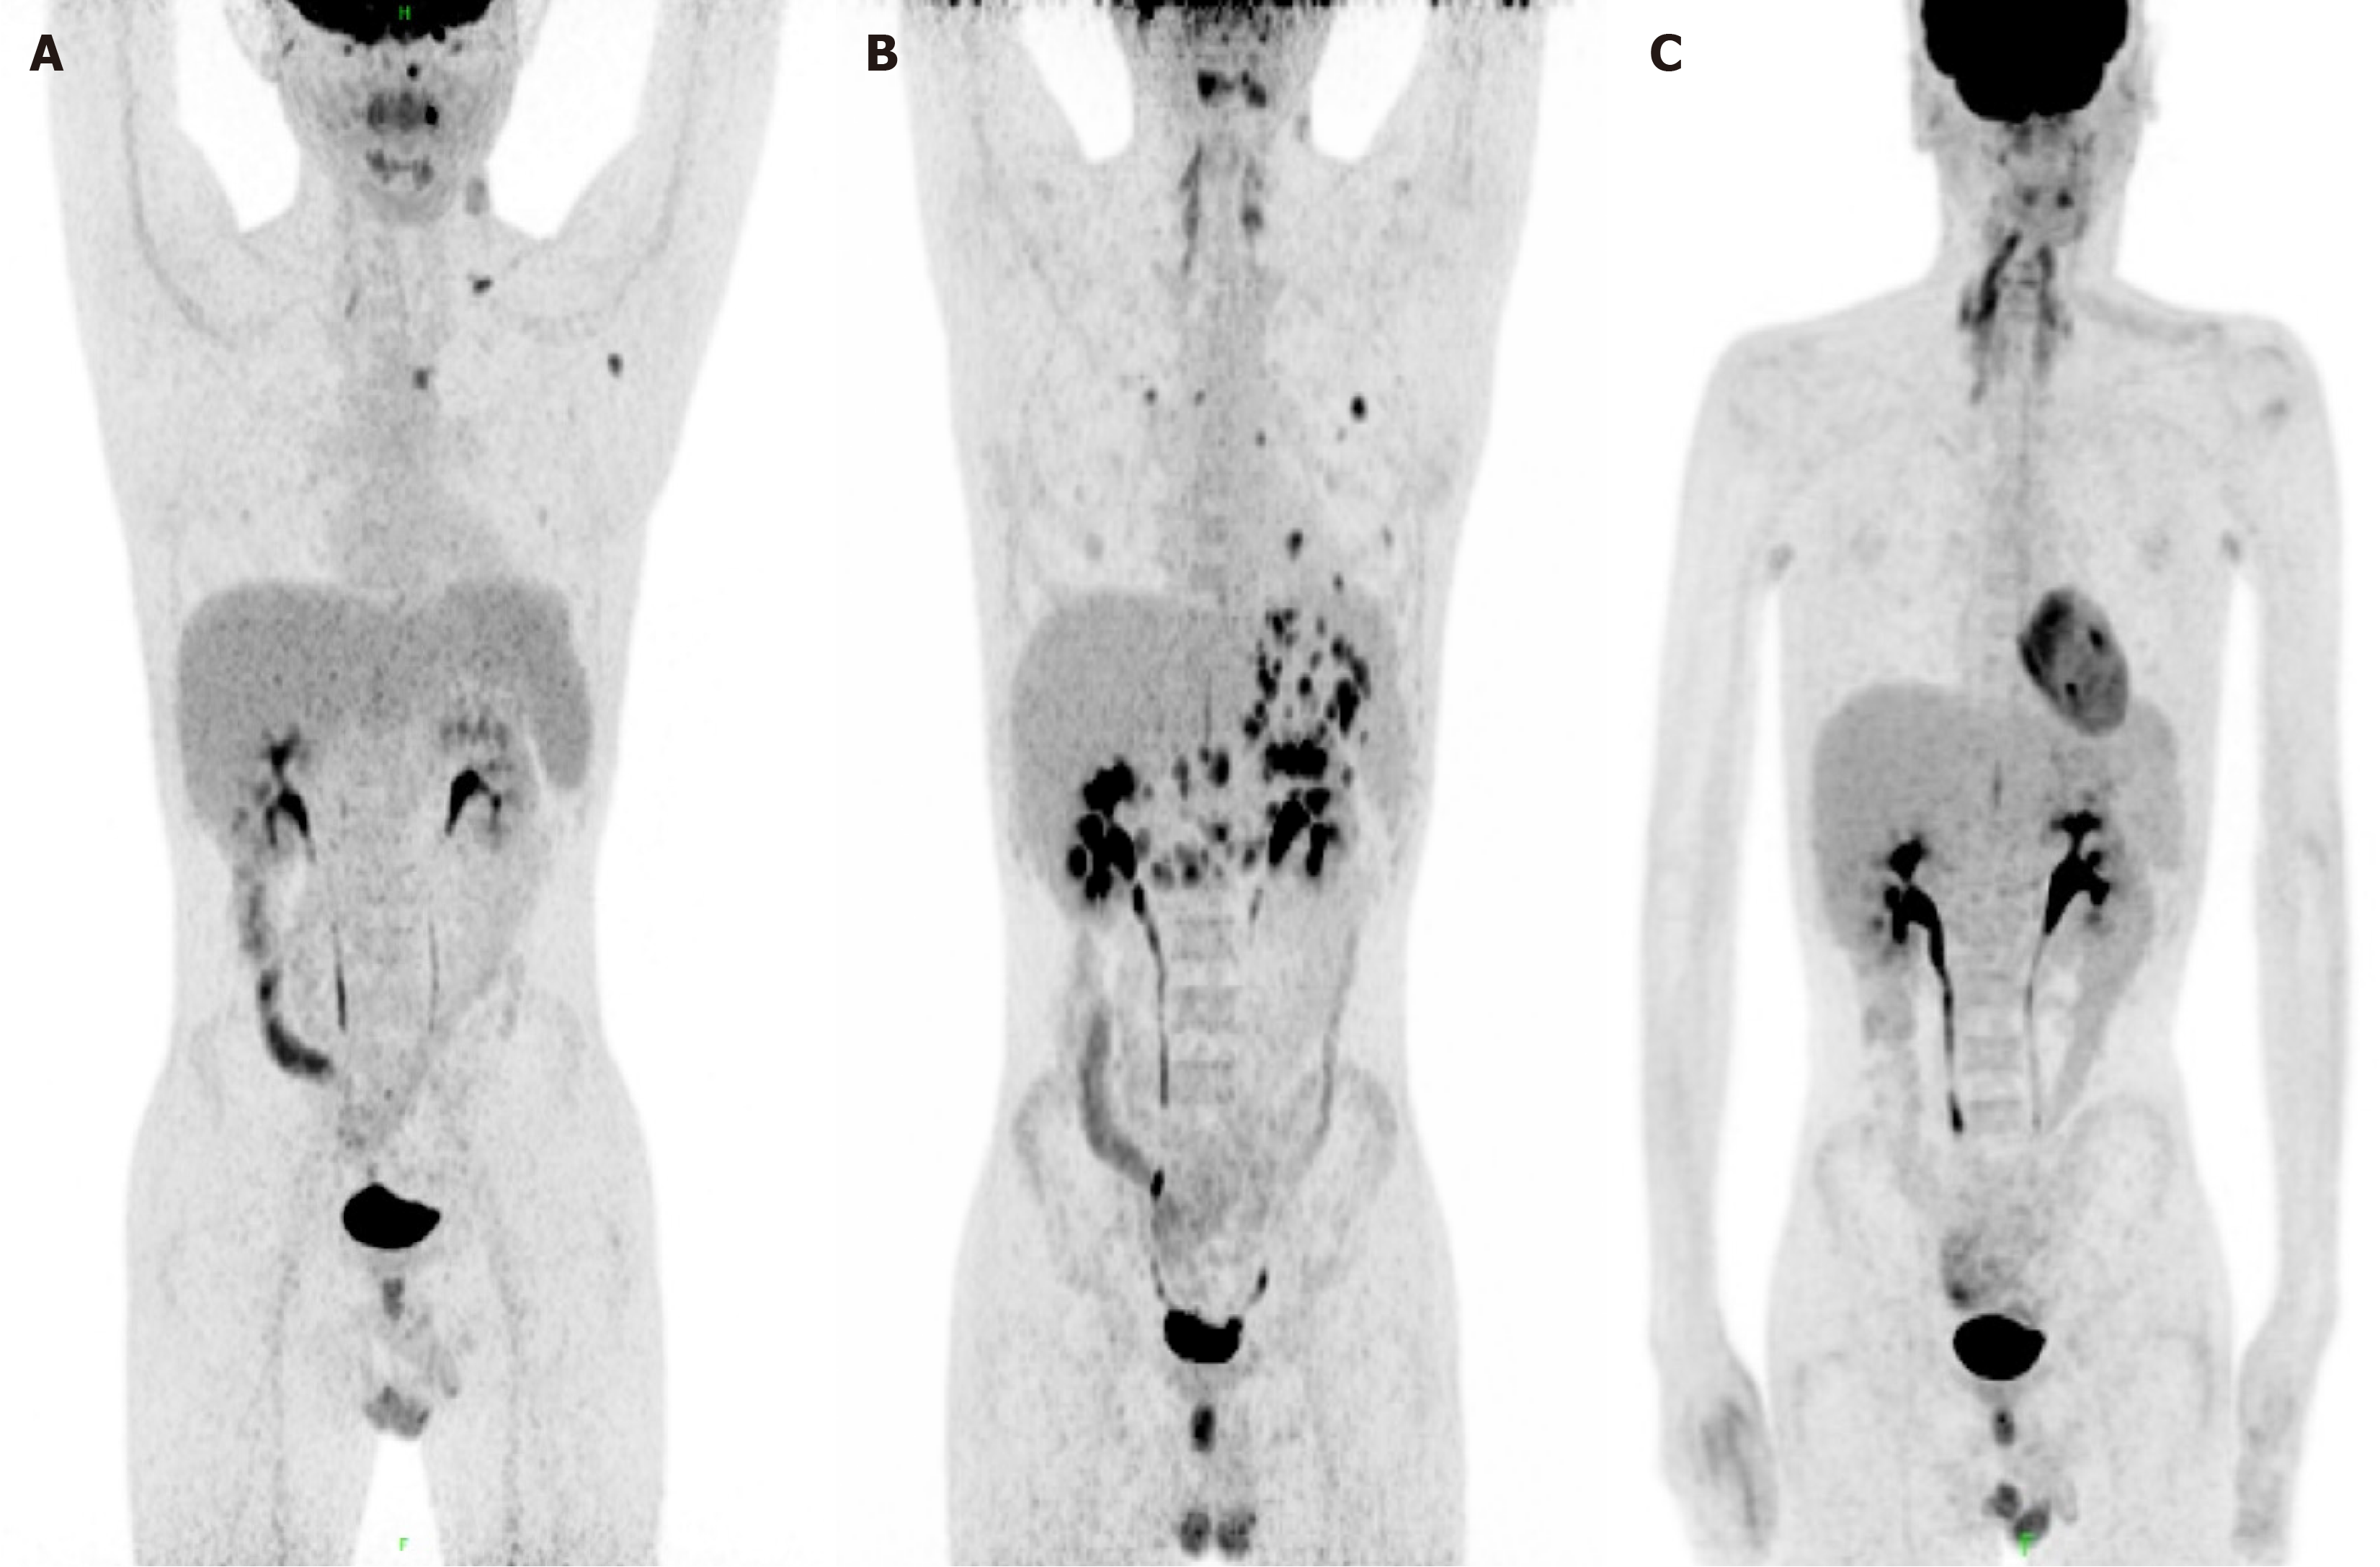
Figure 3 18F-FDG PET scan of the patient during treatment.
A: Pre-treatment; B: Newly onset of stomach and lung lesions; C: Post-treatment.
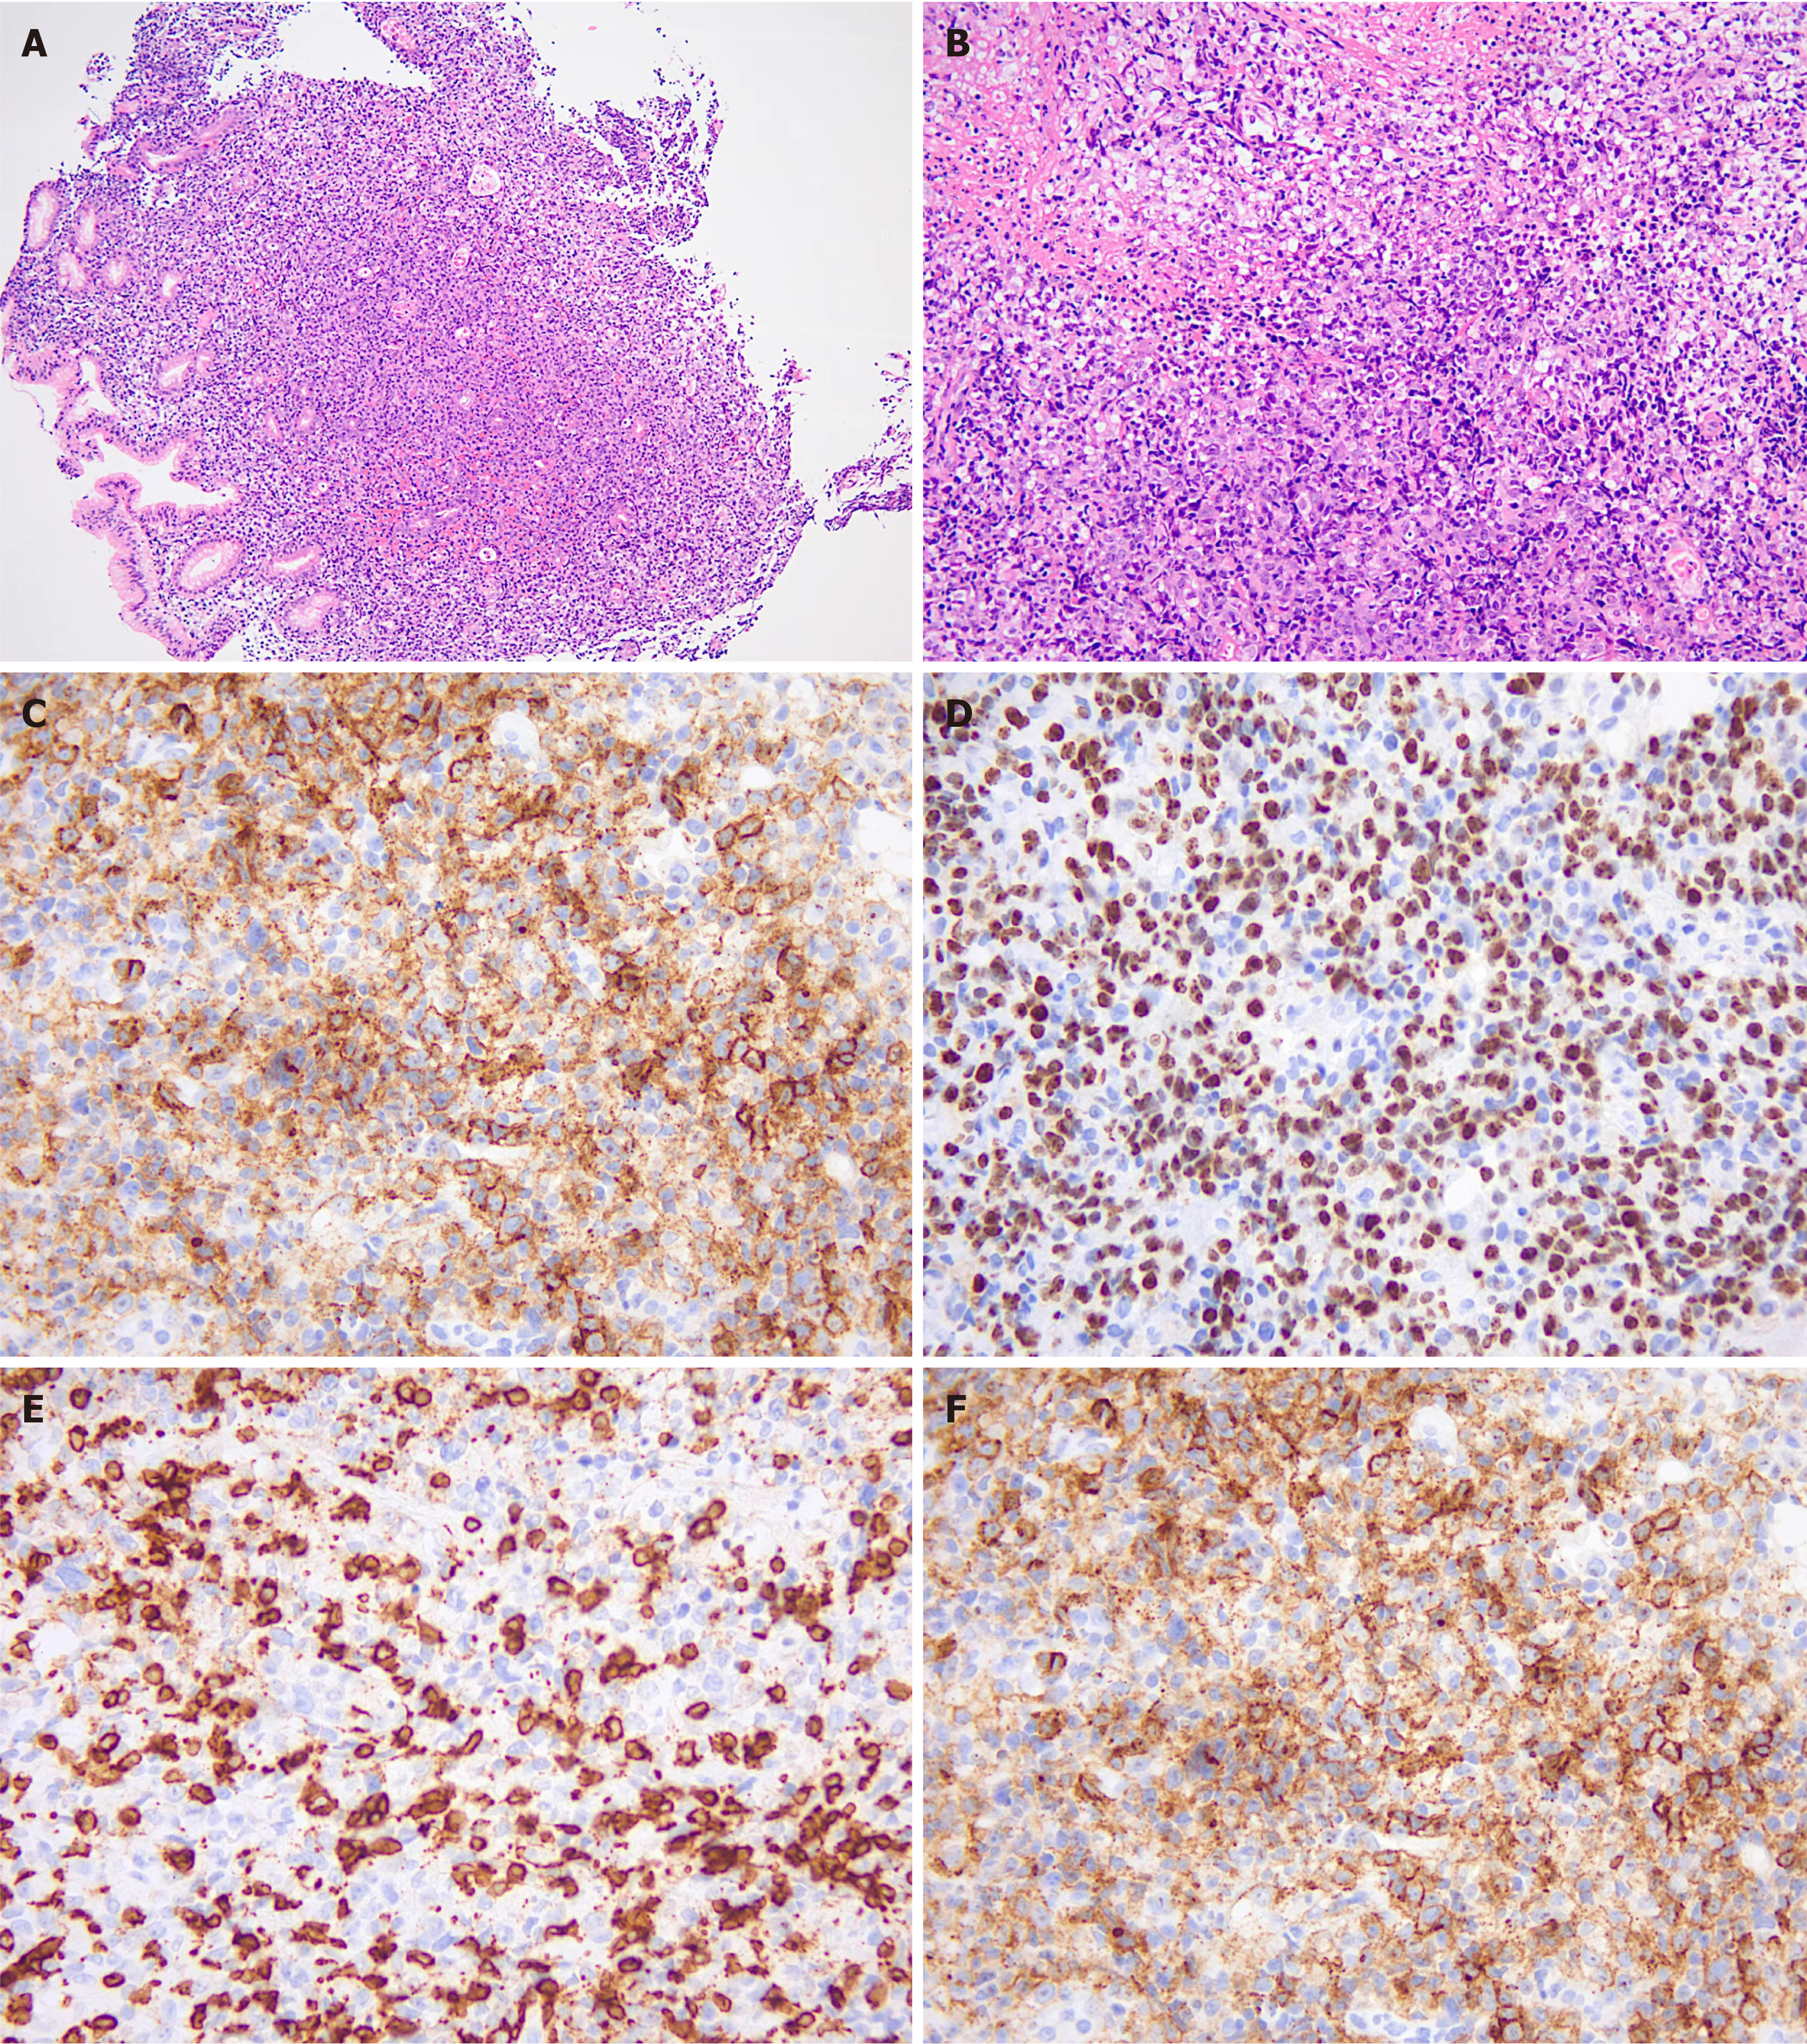
Figure 4 Gastric biopsy showing diffuse heterogeneous lymphocytic infiltration with diffuse Epstein-Barr virus infection.
A: HE staining (× 40); B: HE staining (× 200); C: CD20 positivity; D: 80% positivity for Ki-67; E: CD3 negativity; F: EBER positivity.
- Citation: Guo QN, Liu HS, Li L, Jin DG, Shi JM, Lai XY, Liu LZ, Zhao YM, Yu J, Li YY, Yu FQ, Gao Z, Yan J, Huang H, Luo Y, Ye YS. Epstein-Barr virus positive post-transplant lymphoproliferative disorder with significantly decreased T-cell chimerism early after transplantation: A case report. World J Radiol 2024; 16(10): 600-607
- URL: https://www.wjgnet.com/1949-8470/full/v16/i10/600.htm
- DOI: https://dx.doi.org/10.4329/wjr.v16.i10.600


