©The Author(s) 2024.
World J Radiol. Oct 28, 2024; 16(10): 579-585
Published online Oct 28, 2024. doi: 10.4329/wjr.v16.i10.579
Published online Oct 28, 2024. doi: 10.4329/wjr.v16.i10.579
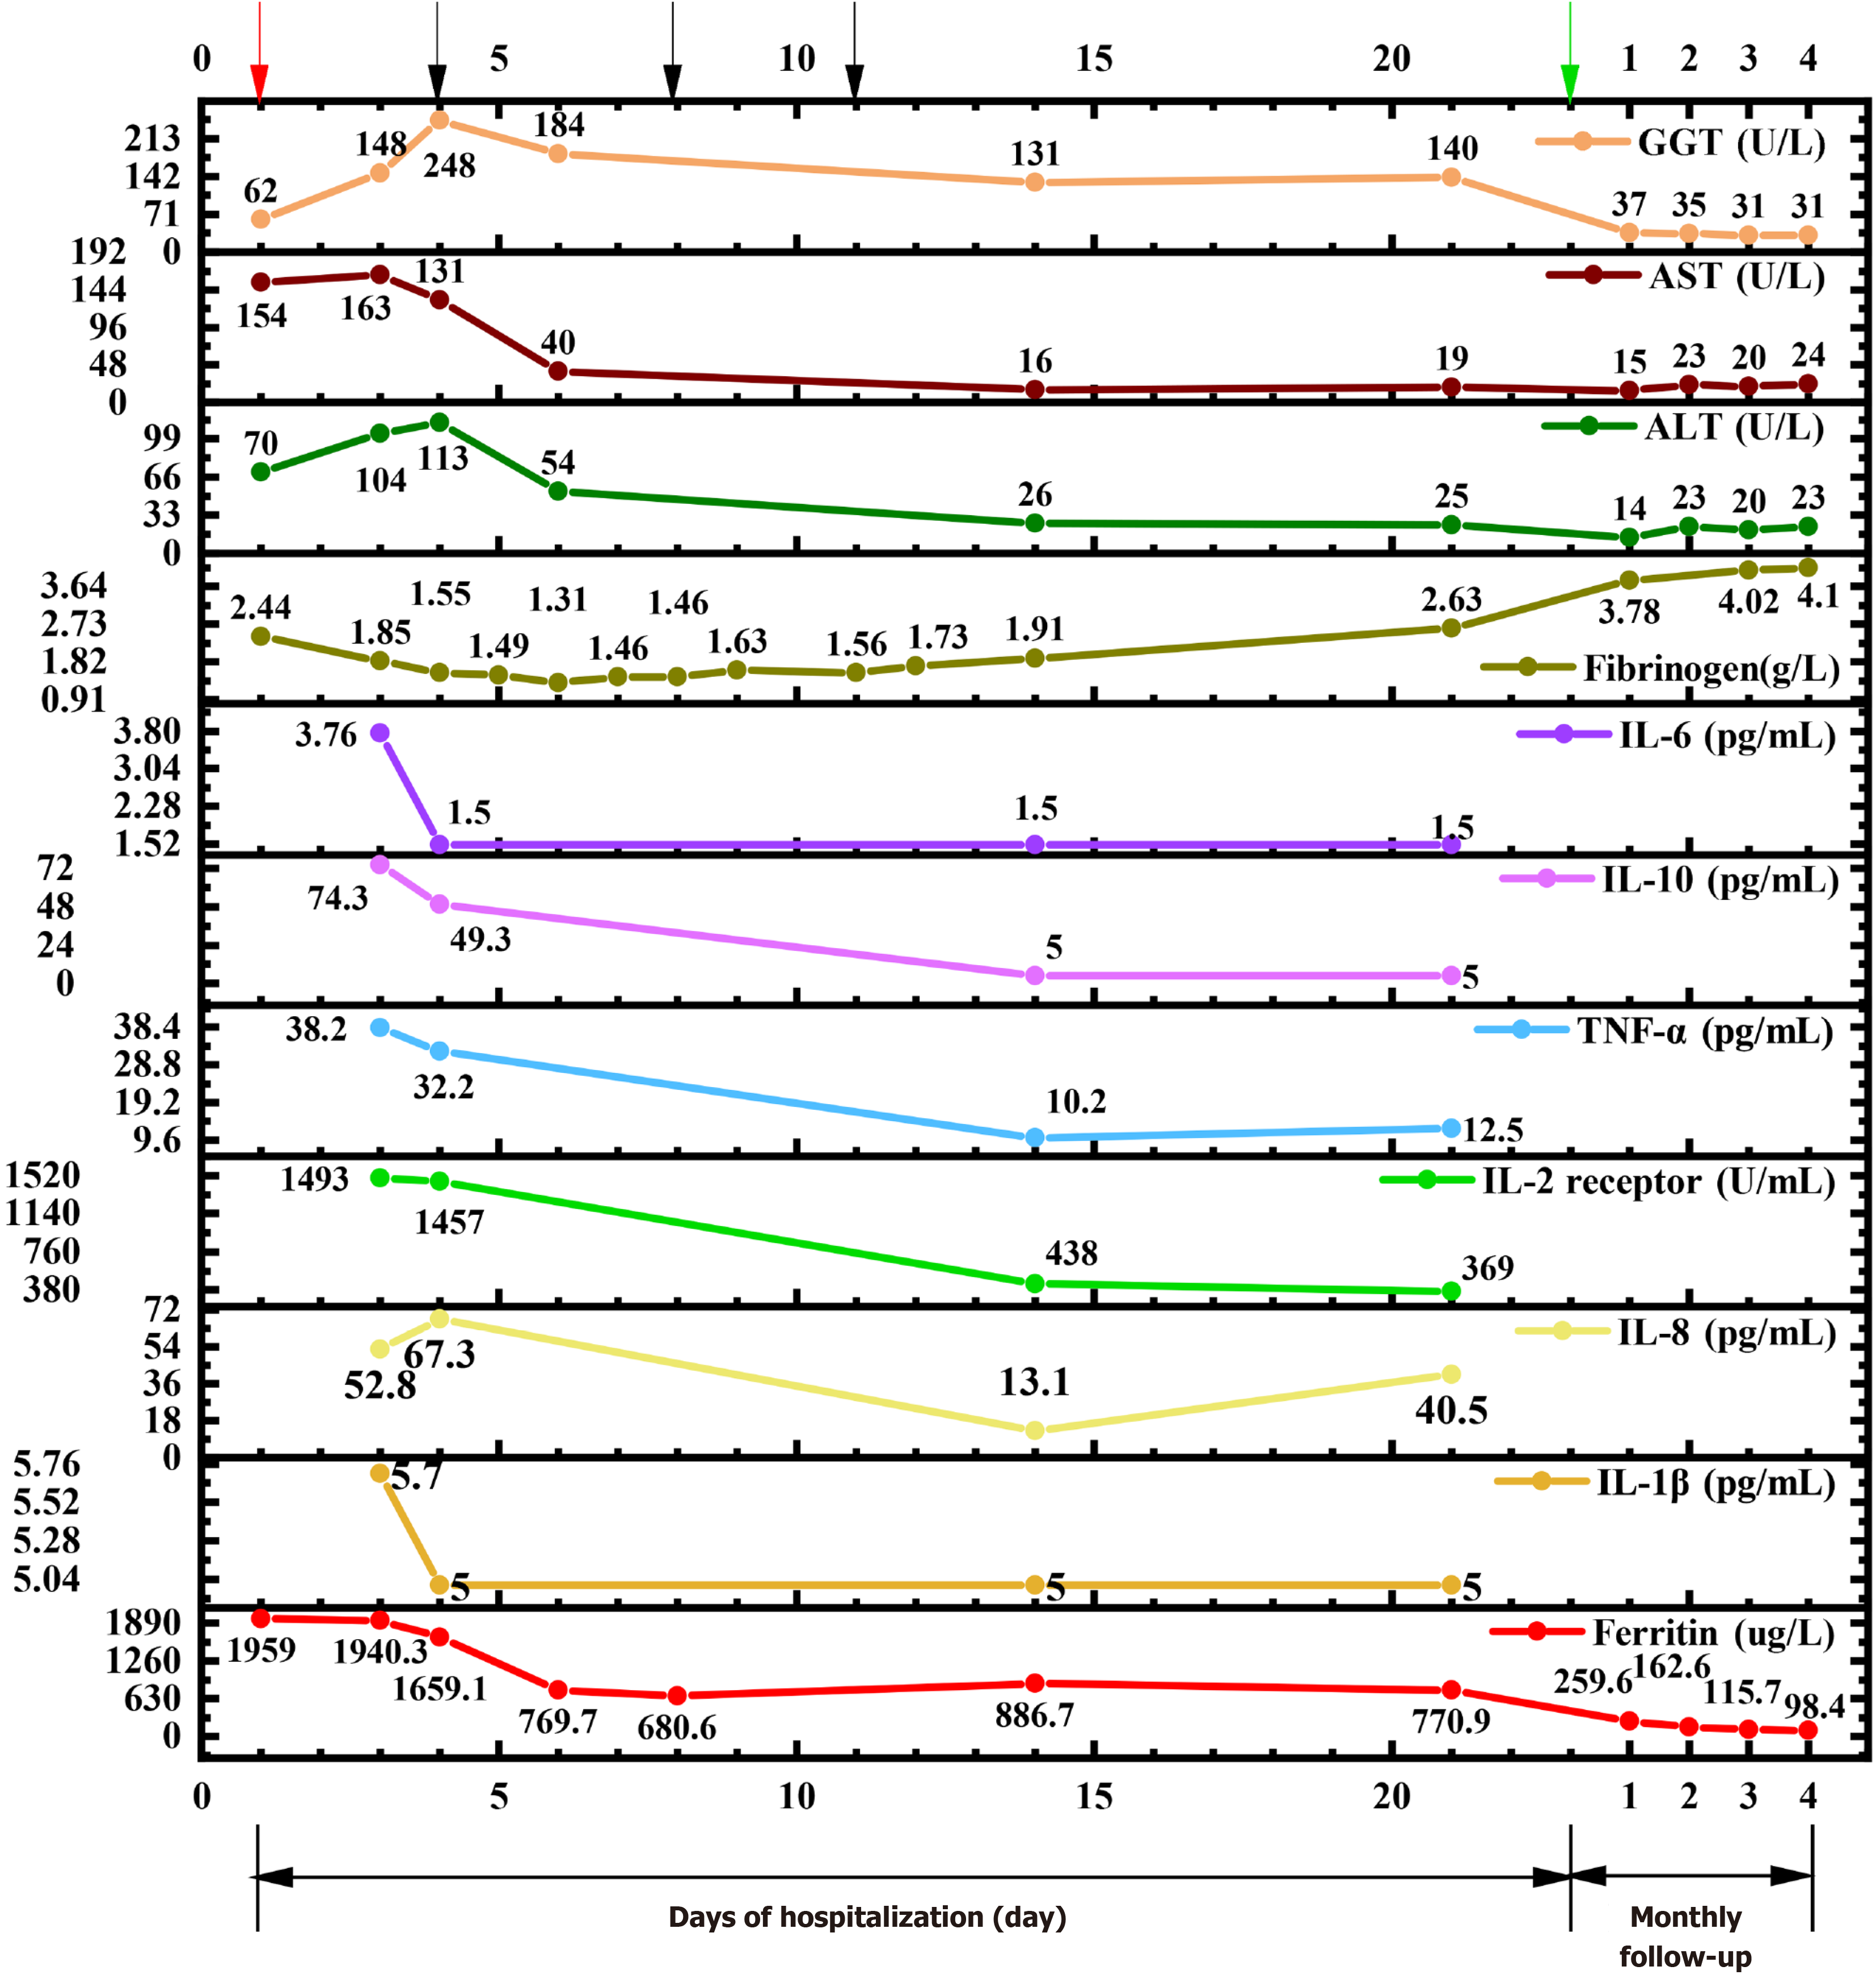
Figure 1 Key index trend before and after treatment with etoposide.
Vertical coordinates: Levels of indexes; Horizontal ordinate: Days of hospitalization or monthly follow-up. Red arrow: Admission; Black arrow: Etoposide administration; Green arrow: Discharge.
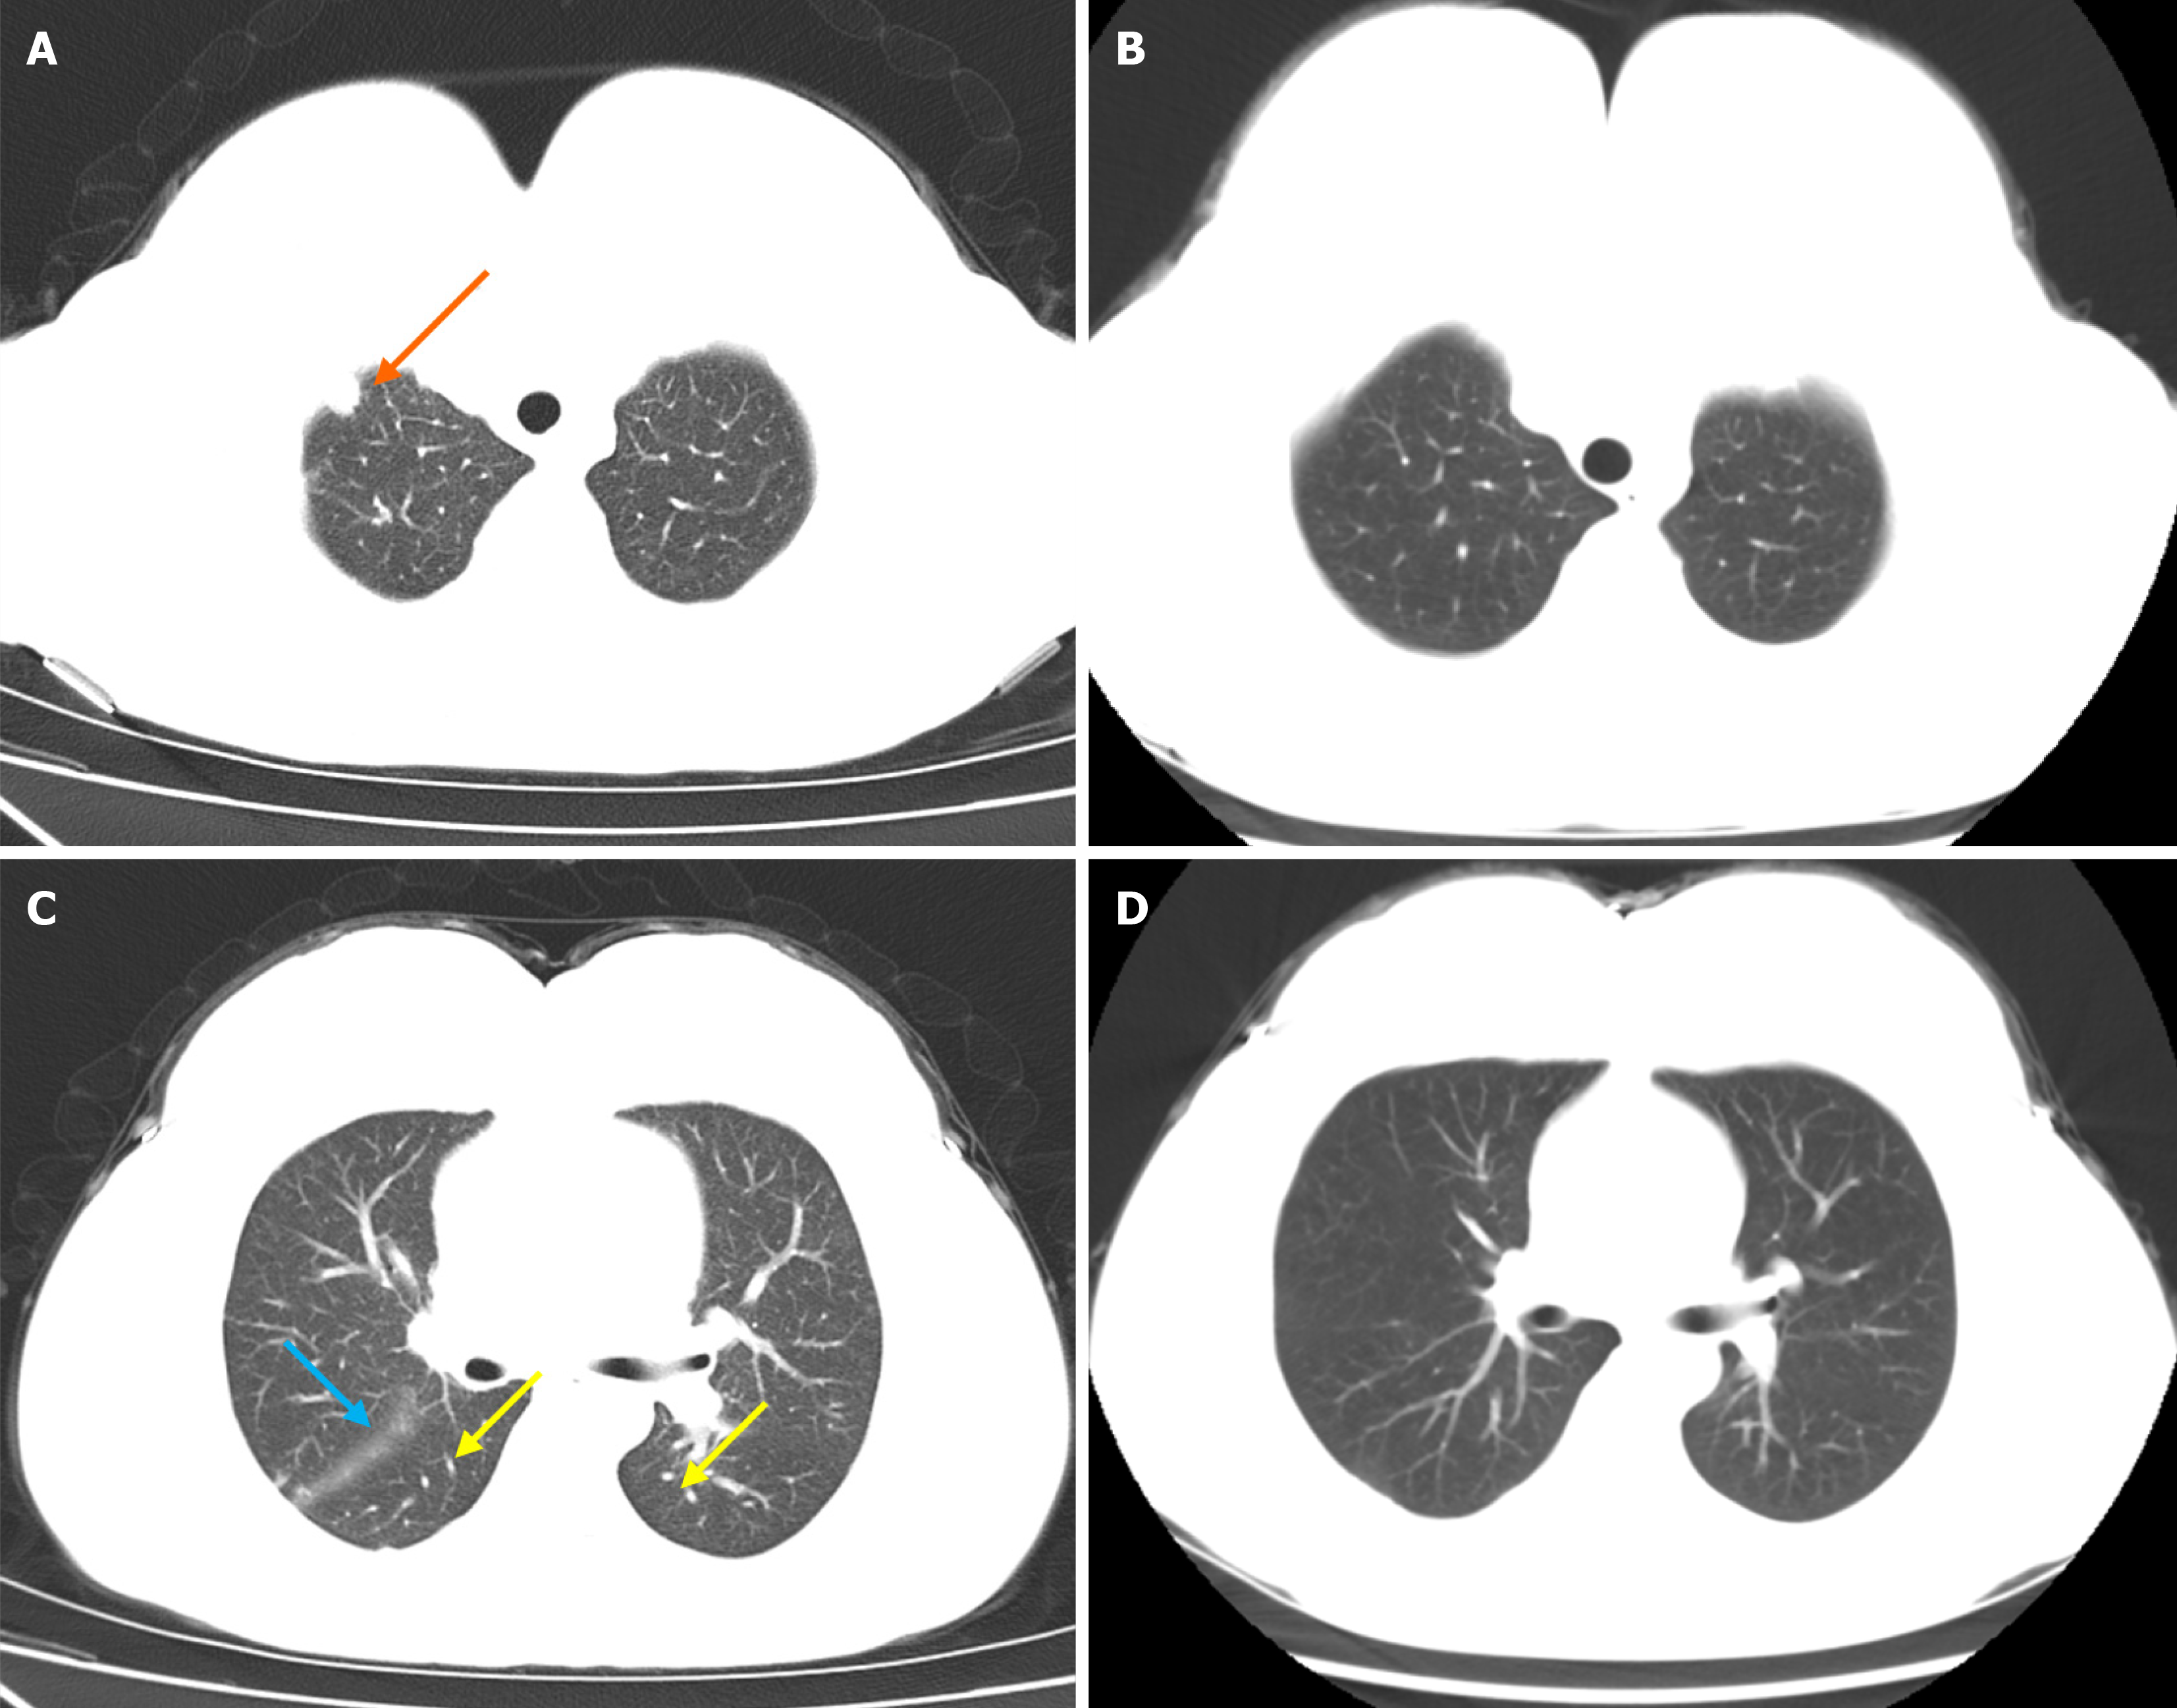
Figure 2 Chest computed tomography scan images before and after treatment.
A and C: Chest computed tomography (CT) scan images before treatment; B and D: Chest CT scan images after treatment. Arrows: Nodes or interlobular septa before treatment
- Citation: Gao SP, Luo XF, Kosari M, Li WJ, Yang L, Tu W, Zhong JX. Successful management of infection and macrophage activation syndrome patient using low-dose etoposide: A case report. World J Radiol 2024; 16(10): 579-585
- URL: https://www.wjgnet.com/1949-8470/full/v16/i10/579.htm
- DOI: https://dx.doi.org/10.4329/wjr.v16.i10.579


