Copyright
©The Author(s) 2025.
World J Cardiol. Oct 26, 2025; 17(10): 109731
Published online Oct 26, 2025. doi: 10.4330/wjc.v17.i10.109731
Published online Oct 26, 2025. doi: 10.4330/wjc.v17.i10.109731
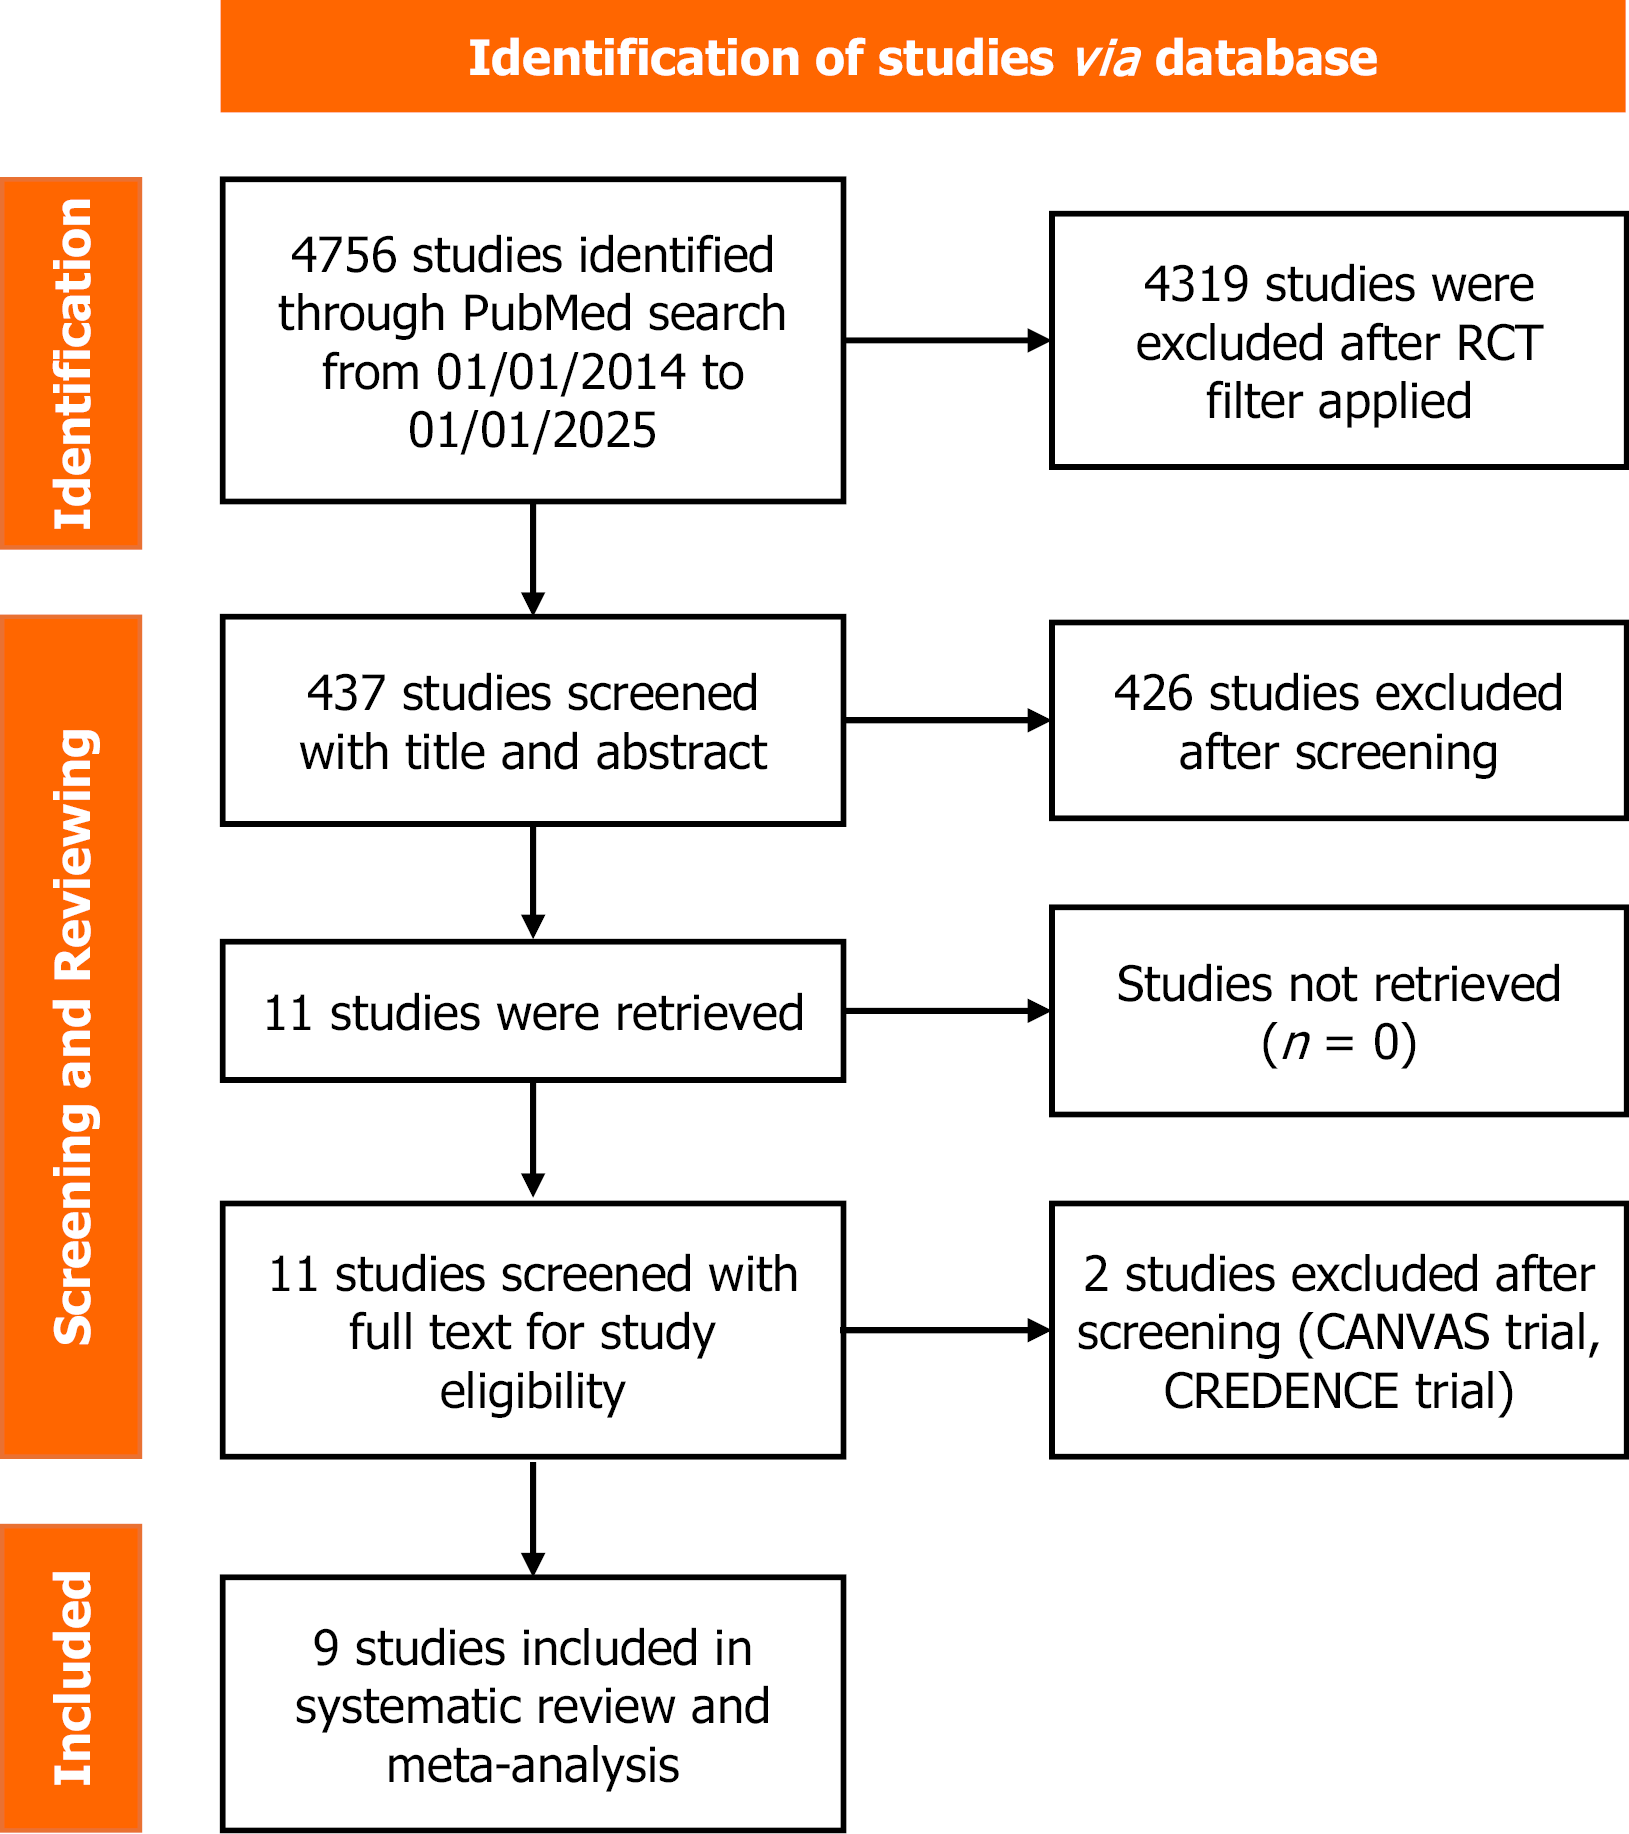
Figure 1 PRISMA flow diagram for selection criteria and search characteristics.
RCT: Randomized controlled trials.
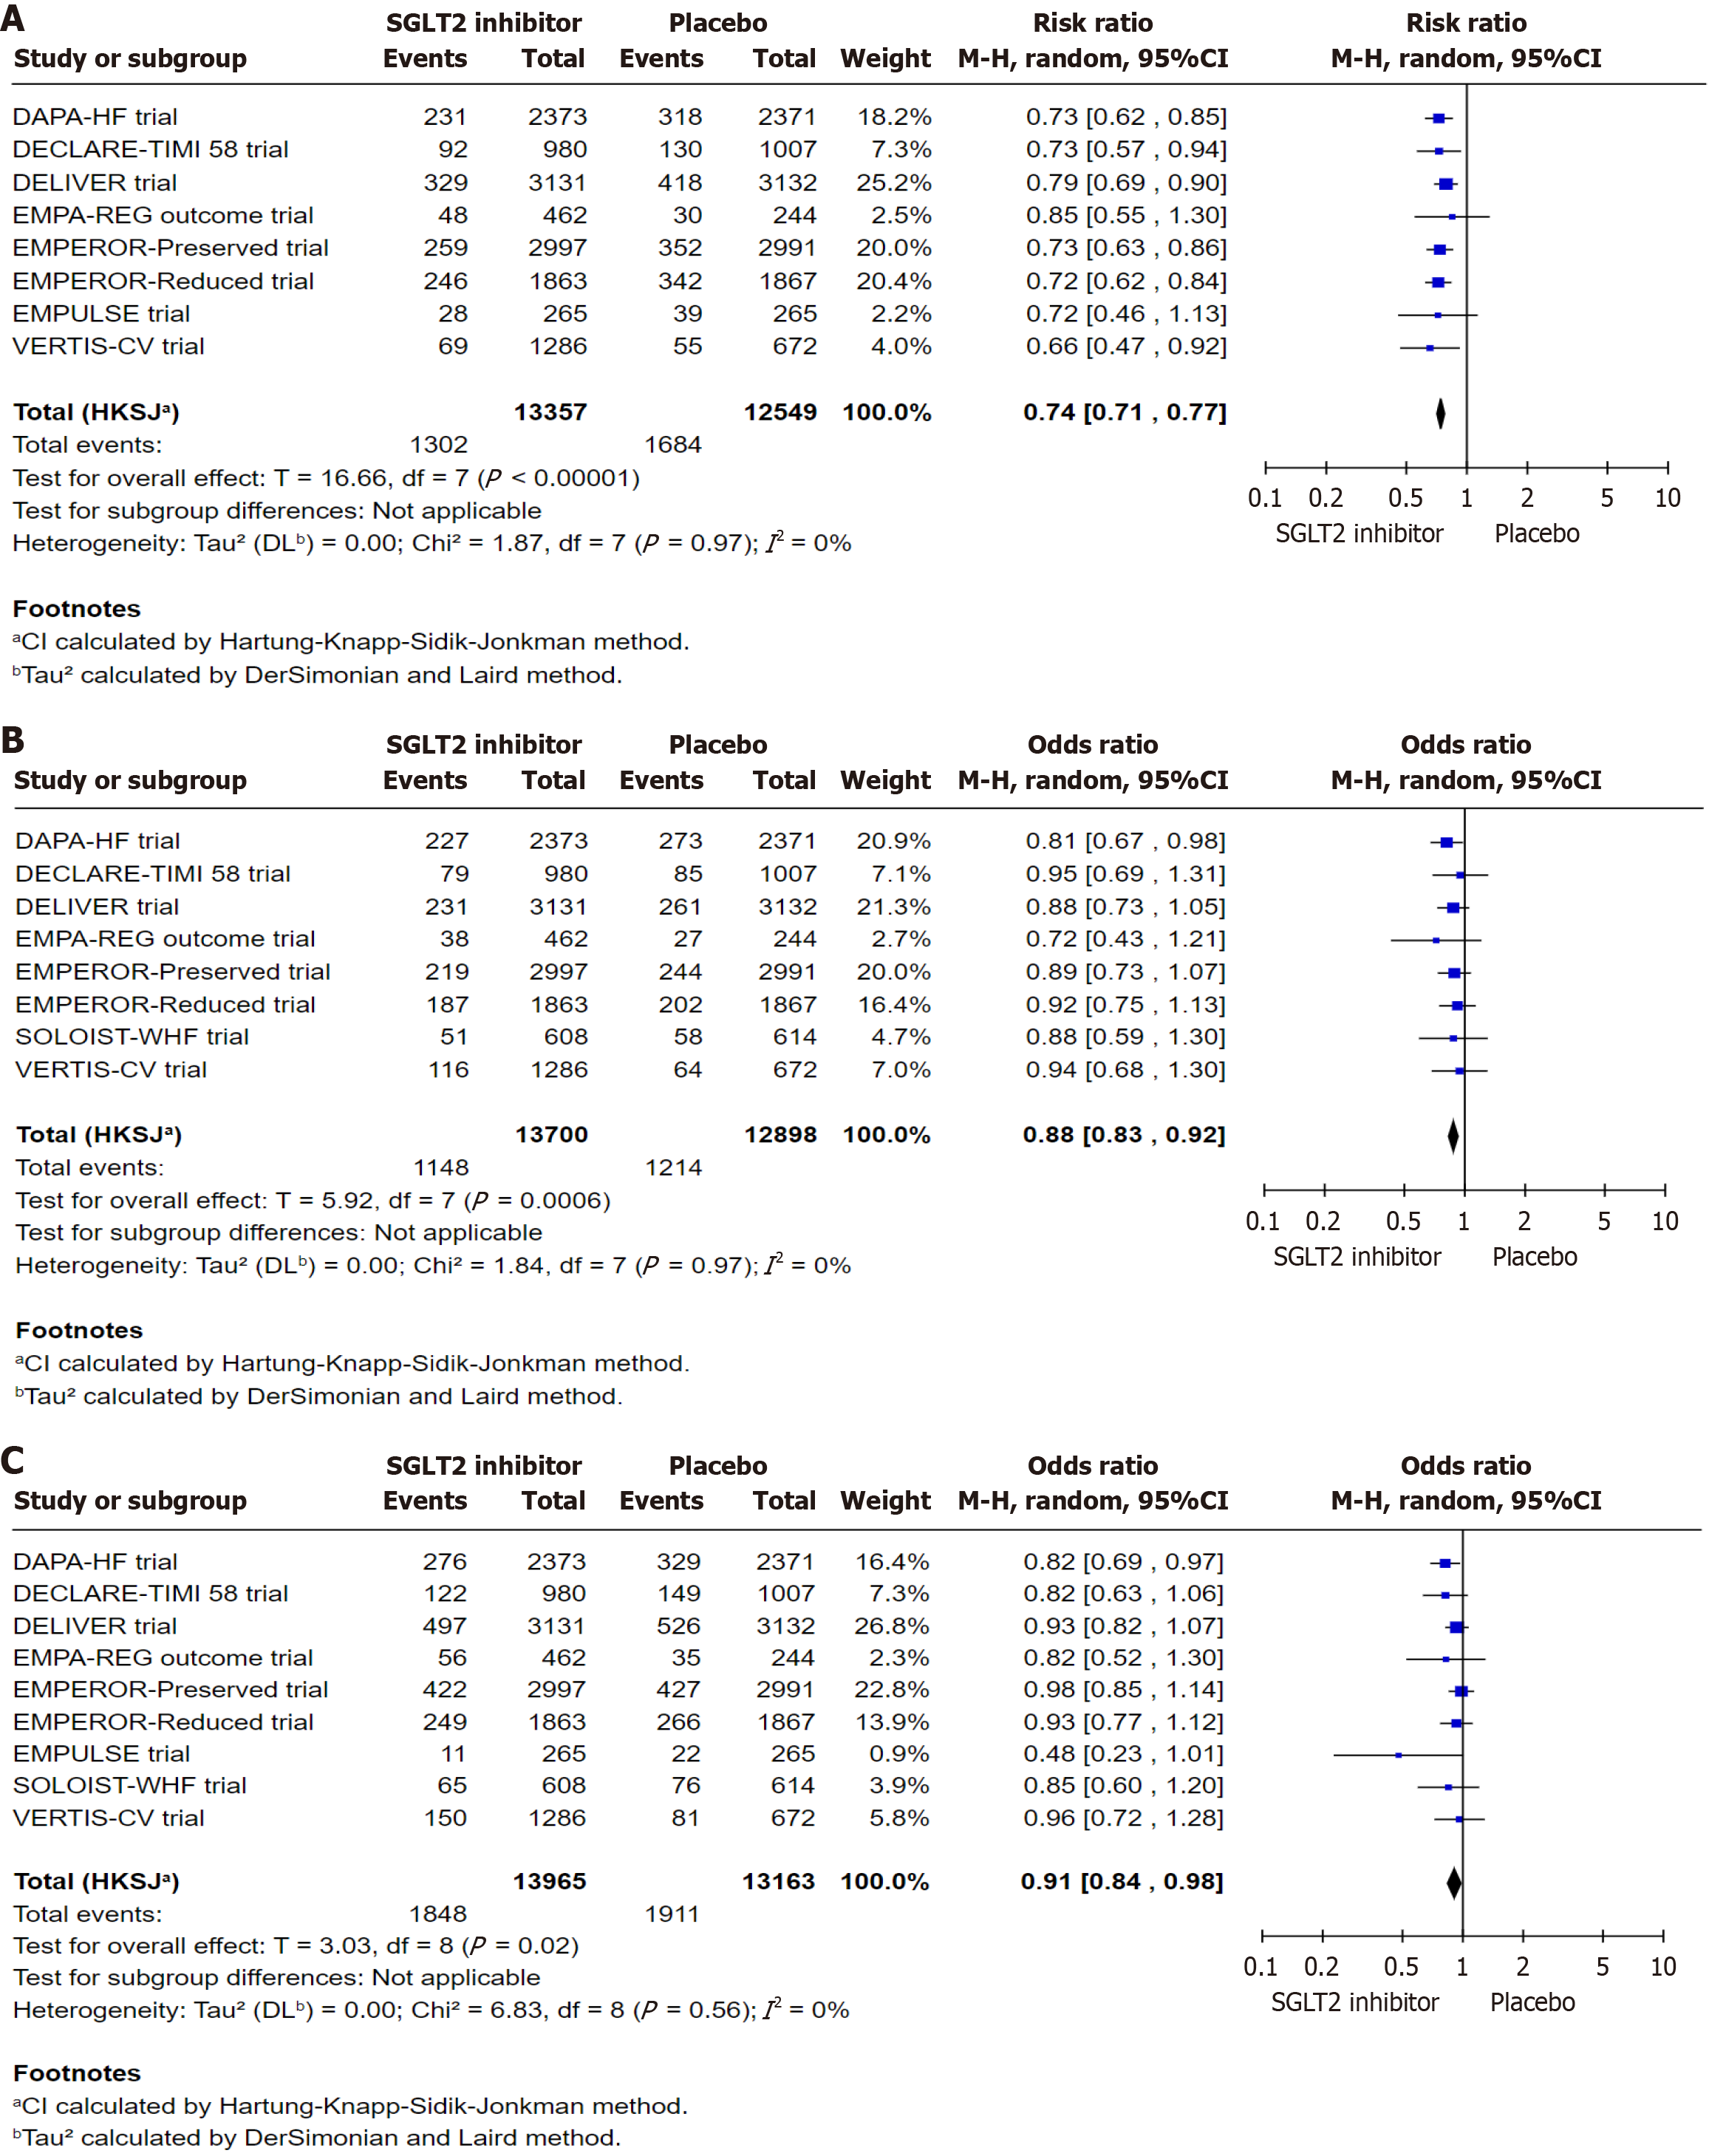
Figure 2 Statistical analysis and forest plots in randomized controlled trials.
A: The risk ratio for hospitalization for heart failure in patients receiving a Sodium-Glucose cotransporter 2 inhibitor vs placebo; B: The odds ratio for cardiovascular deaths in patients receiving Sodium-glucose cotransporter 2 inhibitor vs placebo; C: The odds ratio for all-cause mortality in patients receiving a Sodium-Glucose cotransporter 2 inhibitor vs placebo. Squares represent individual study estimates, sized by study weight; horizontal lines show 95%CI. The diamond denotes the pooled effect estimate and its 95%CI. SGLT2: Sodium-glucose cotransporter 2.
- Citation: Parsi S, Shirsat PD, Mahali LP, Surani S, Kashyap R. Sodium-glucose cotransporter 2 inhibitor in heart failure patients and their outcomes: A meta-analysis of randomized controlled trials. World J Cardiol 2025; 17(10): 109731
- URL: https://www.wjgnet.com/1949-8462/full/v17/i10/109731.htm
- DOI: https://dx.doi.org/10.4330/wjc.v17.i10.109731


