Copyright
©The Author(s) 2025.
World J Gastrointest Surg. Jul 27, 2025; 17(7): 106901
Published online Jul 27, 2025. doi: 10.4240/wjgs.v17.i7.106901
Published online Jul 27, 2025. doi: 10.4240/wjgs.v17.i7.106901
Figure 1 Comparison of anesthesia quality.
A: Comparison of anesthesia induction time; B: Comparison of recovery time; C: Comparison of orientation recovery time. bP < 0.01, compared to the control group.
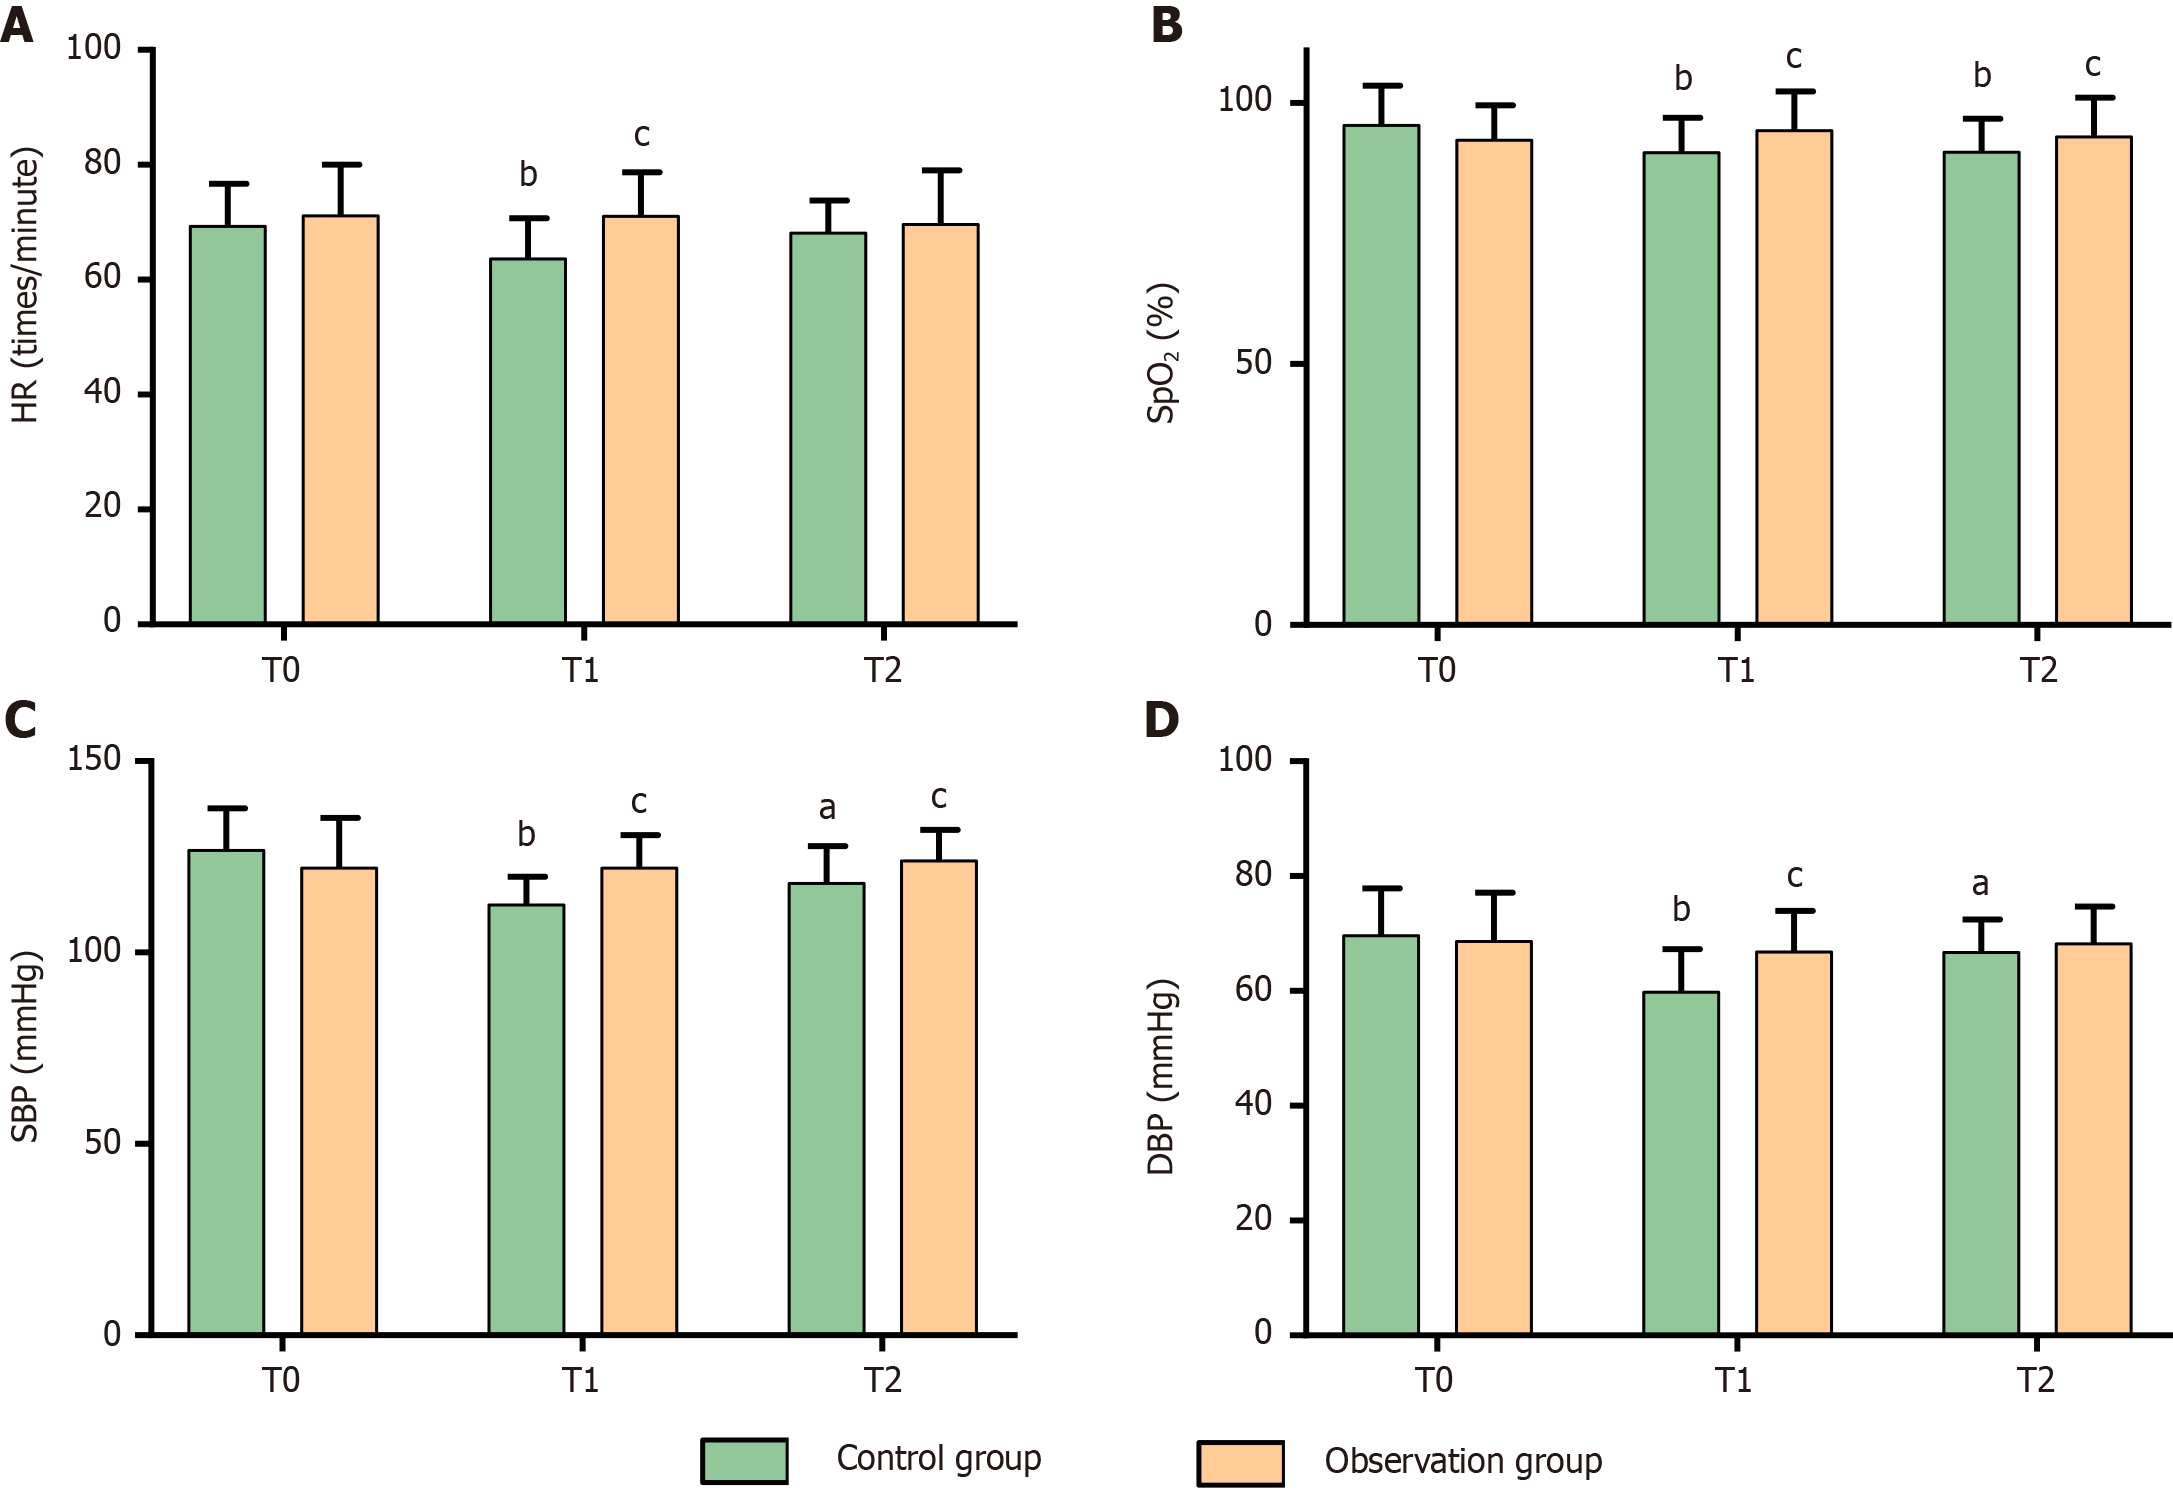
Figure 2 Comparison of hemodynamic parameters.
A: Heart rate levels across time points; B: Oxygen saturation levels across time points; C: Systolic blood pressure levels across time points; D: Diastolic blood pressure levels across time points. aP < 0.05 compared to T0; bP < 0.01 compared to T0; cP < 0.05, compared to the control group; HR: Heart rate; SpO2: Oxygen saturation; SBP: Systolic blood pressure; DBP: Diastolic blood pressure.
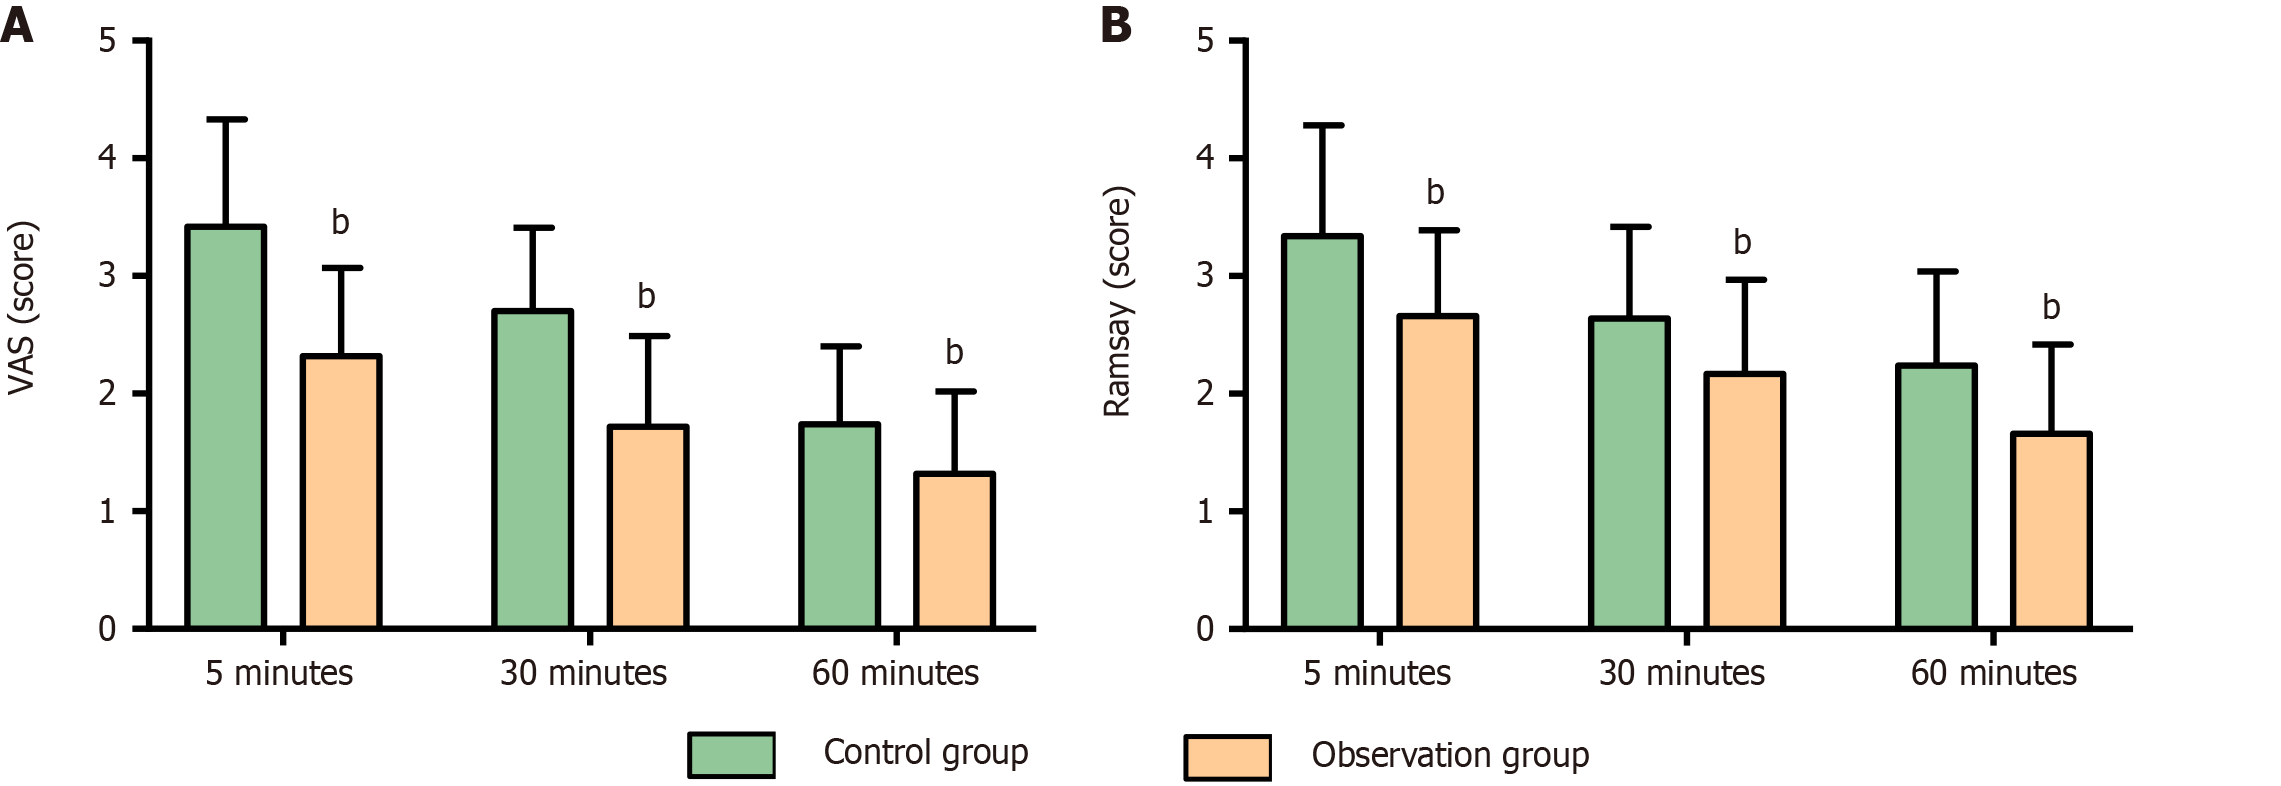
Figure 3 Comparison of analgesic and sedative effects.
A: Visual analog scale scores across time points; B: Ramsay scores across time points. bP < 0.01, compared to the control group; VAS: Visual analog scale.
- Citation: Zhang YY. Etomidate-propofol combination in painless gastrointestinal endoscopy for elderly patients: A comparative study. World J Gastrointest Surg 2025; 17(7): 106901
- URL: https://www.wjgnet.com/1948-9366/full/v17/i7/106901.htm
- DOI: https://dx.doi.org/10.4240/wjgs.v17.i7.106901


