Copyright
©The Author(s) 2025.
World J Gastrointest Surg. May 27, 2025; 17(5): 103758
Published online May 27, 2025. doi: 10.4240/wjgs.v17.i5.103758
Published online May 27, 2025. doi: 10.4240/wjgs.v17.i5.103758
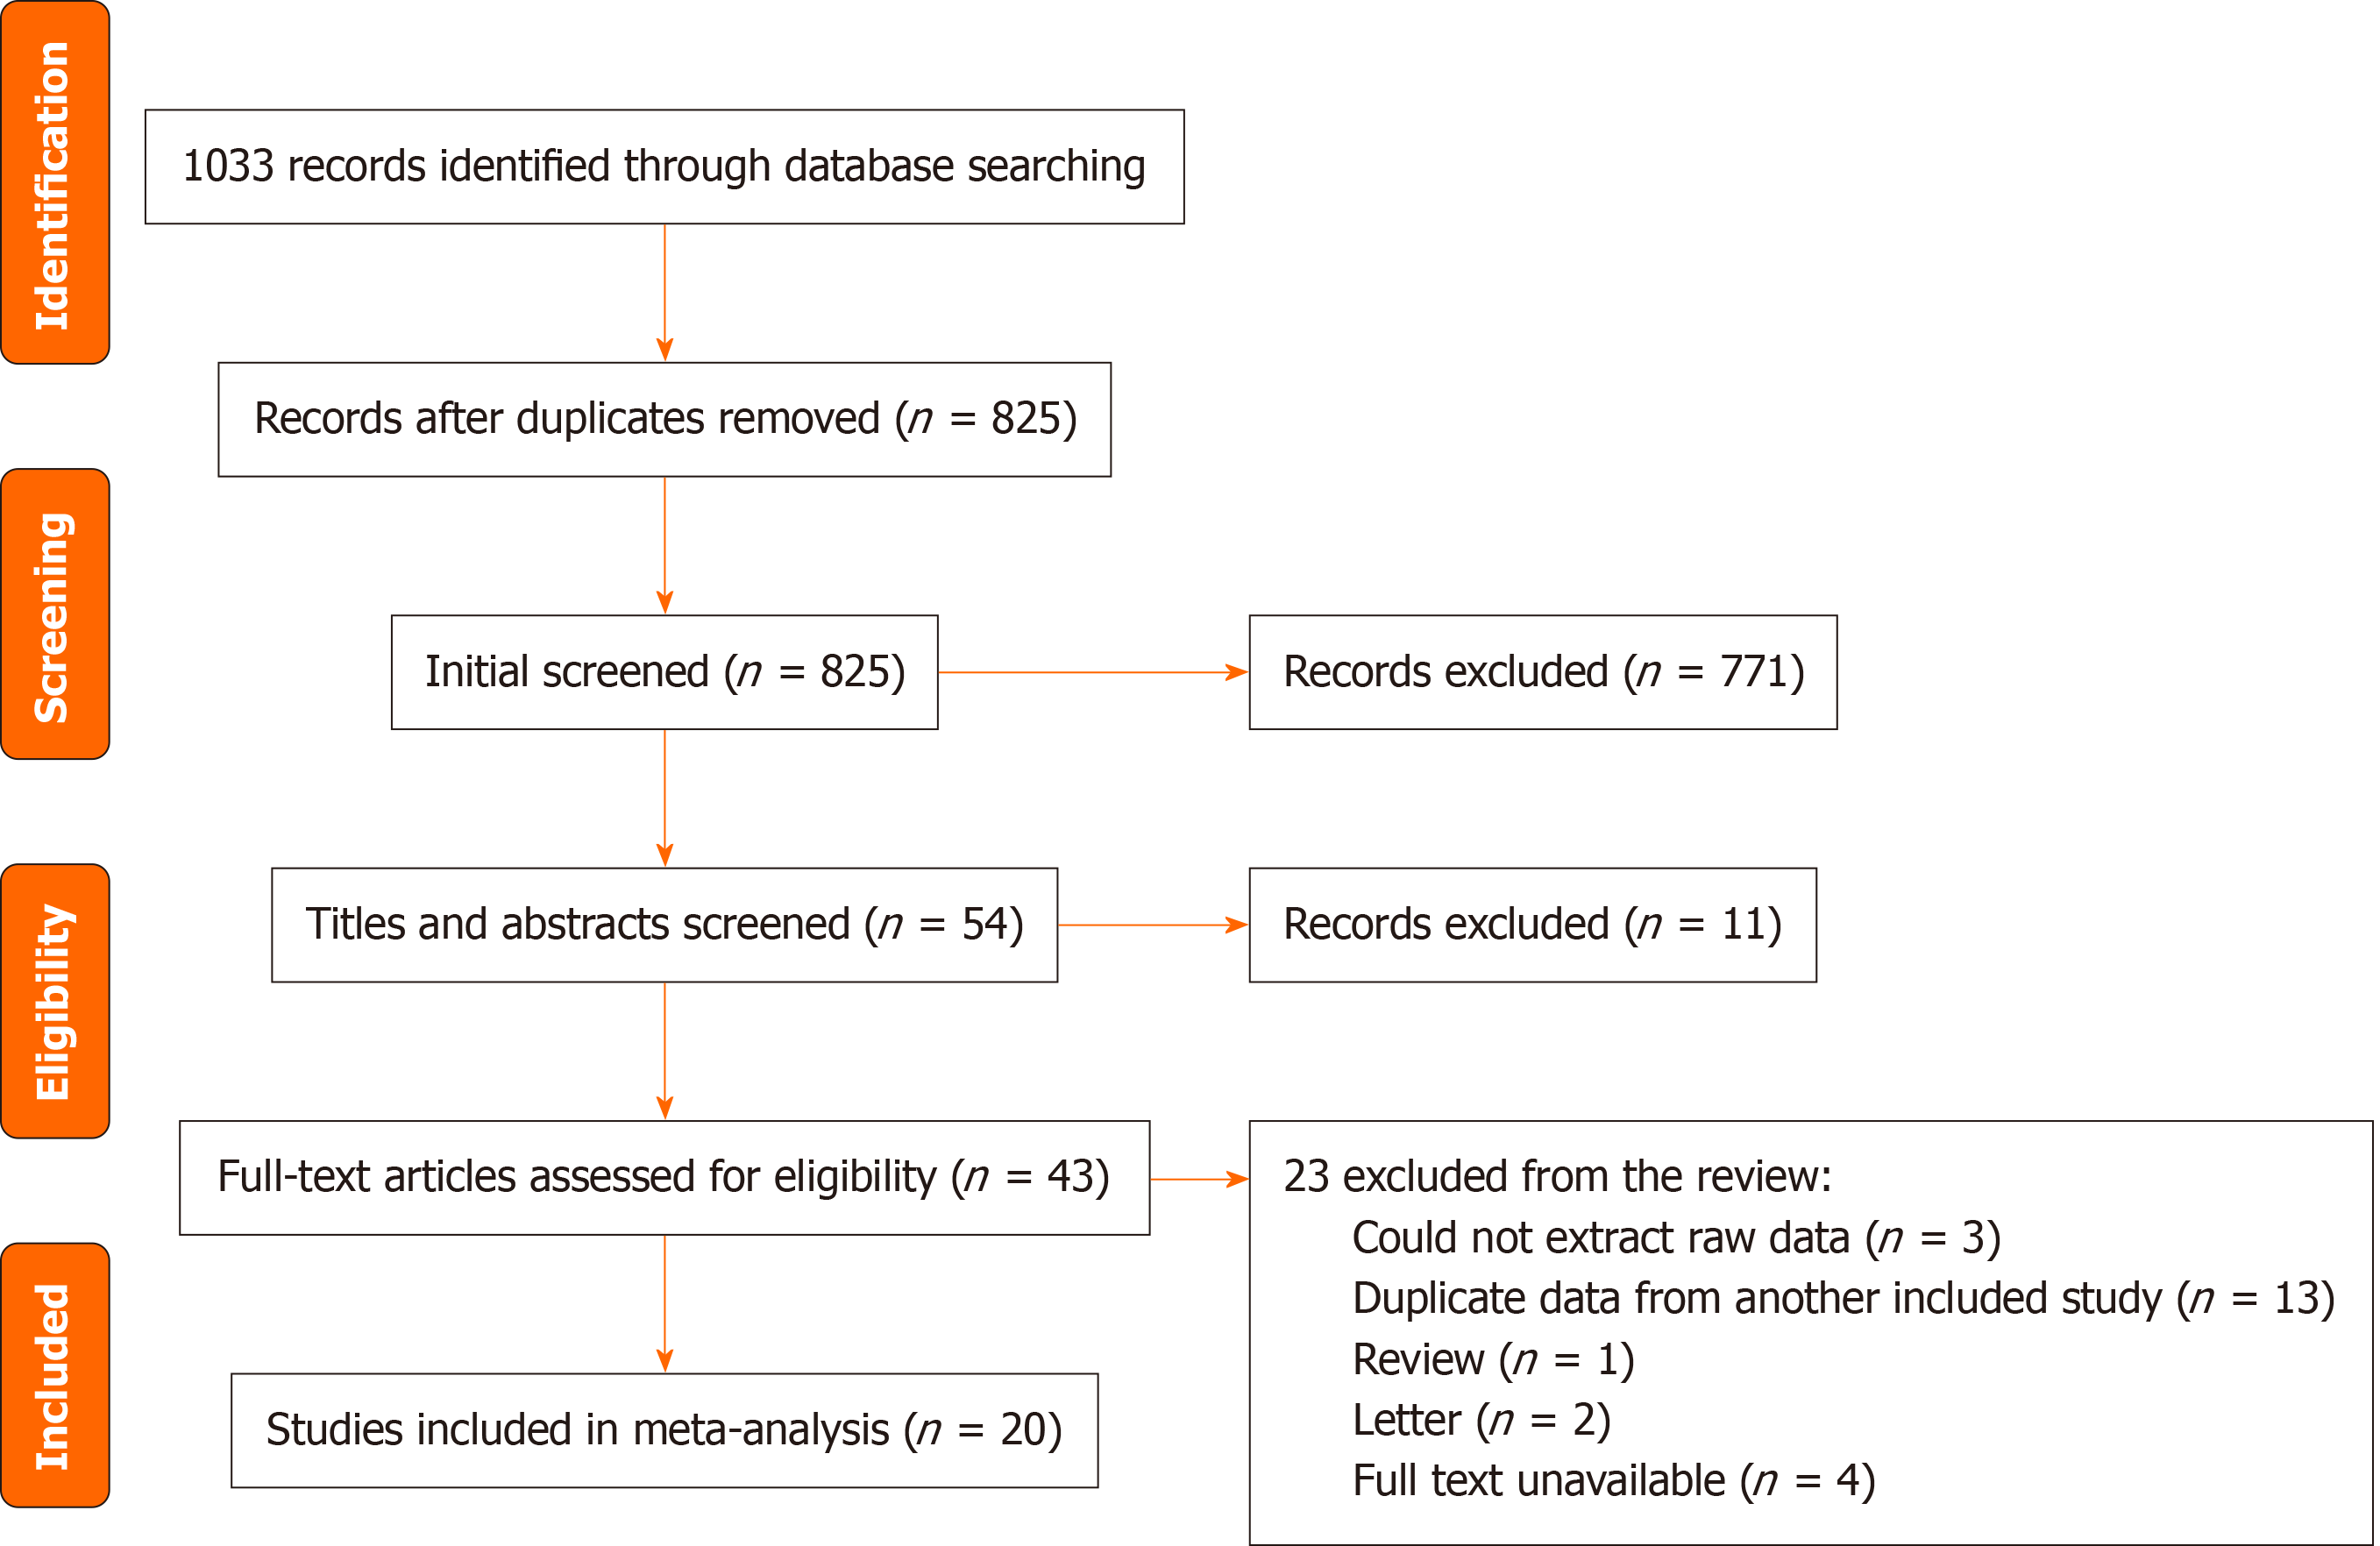
Figure 1 Flow diagram of the literature search.
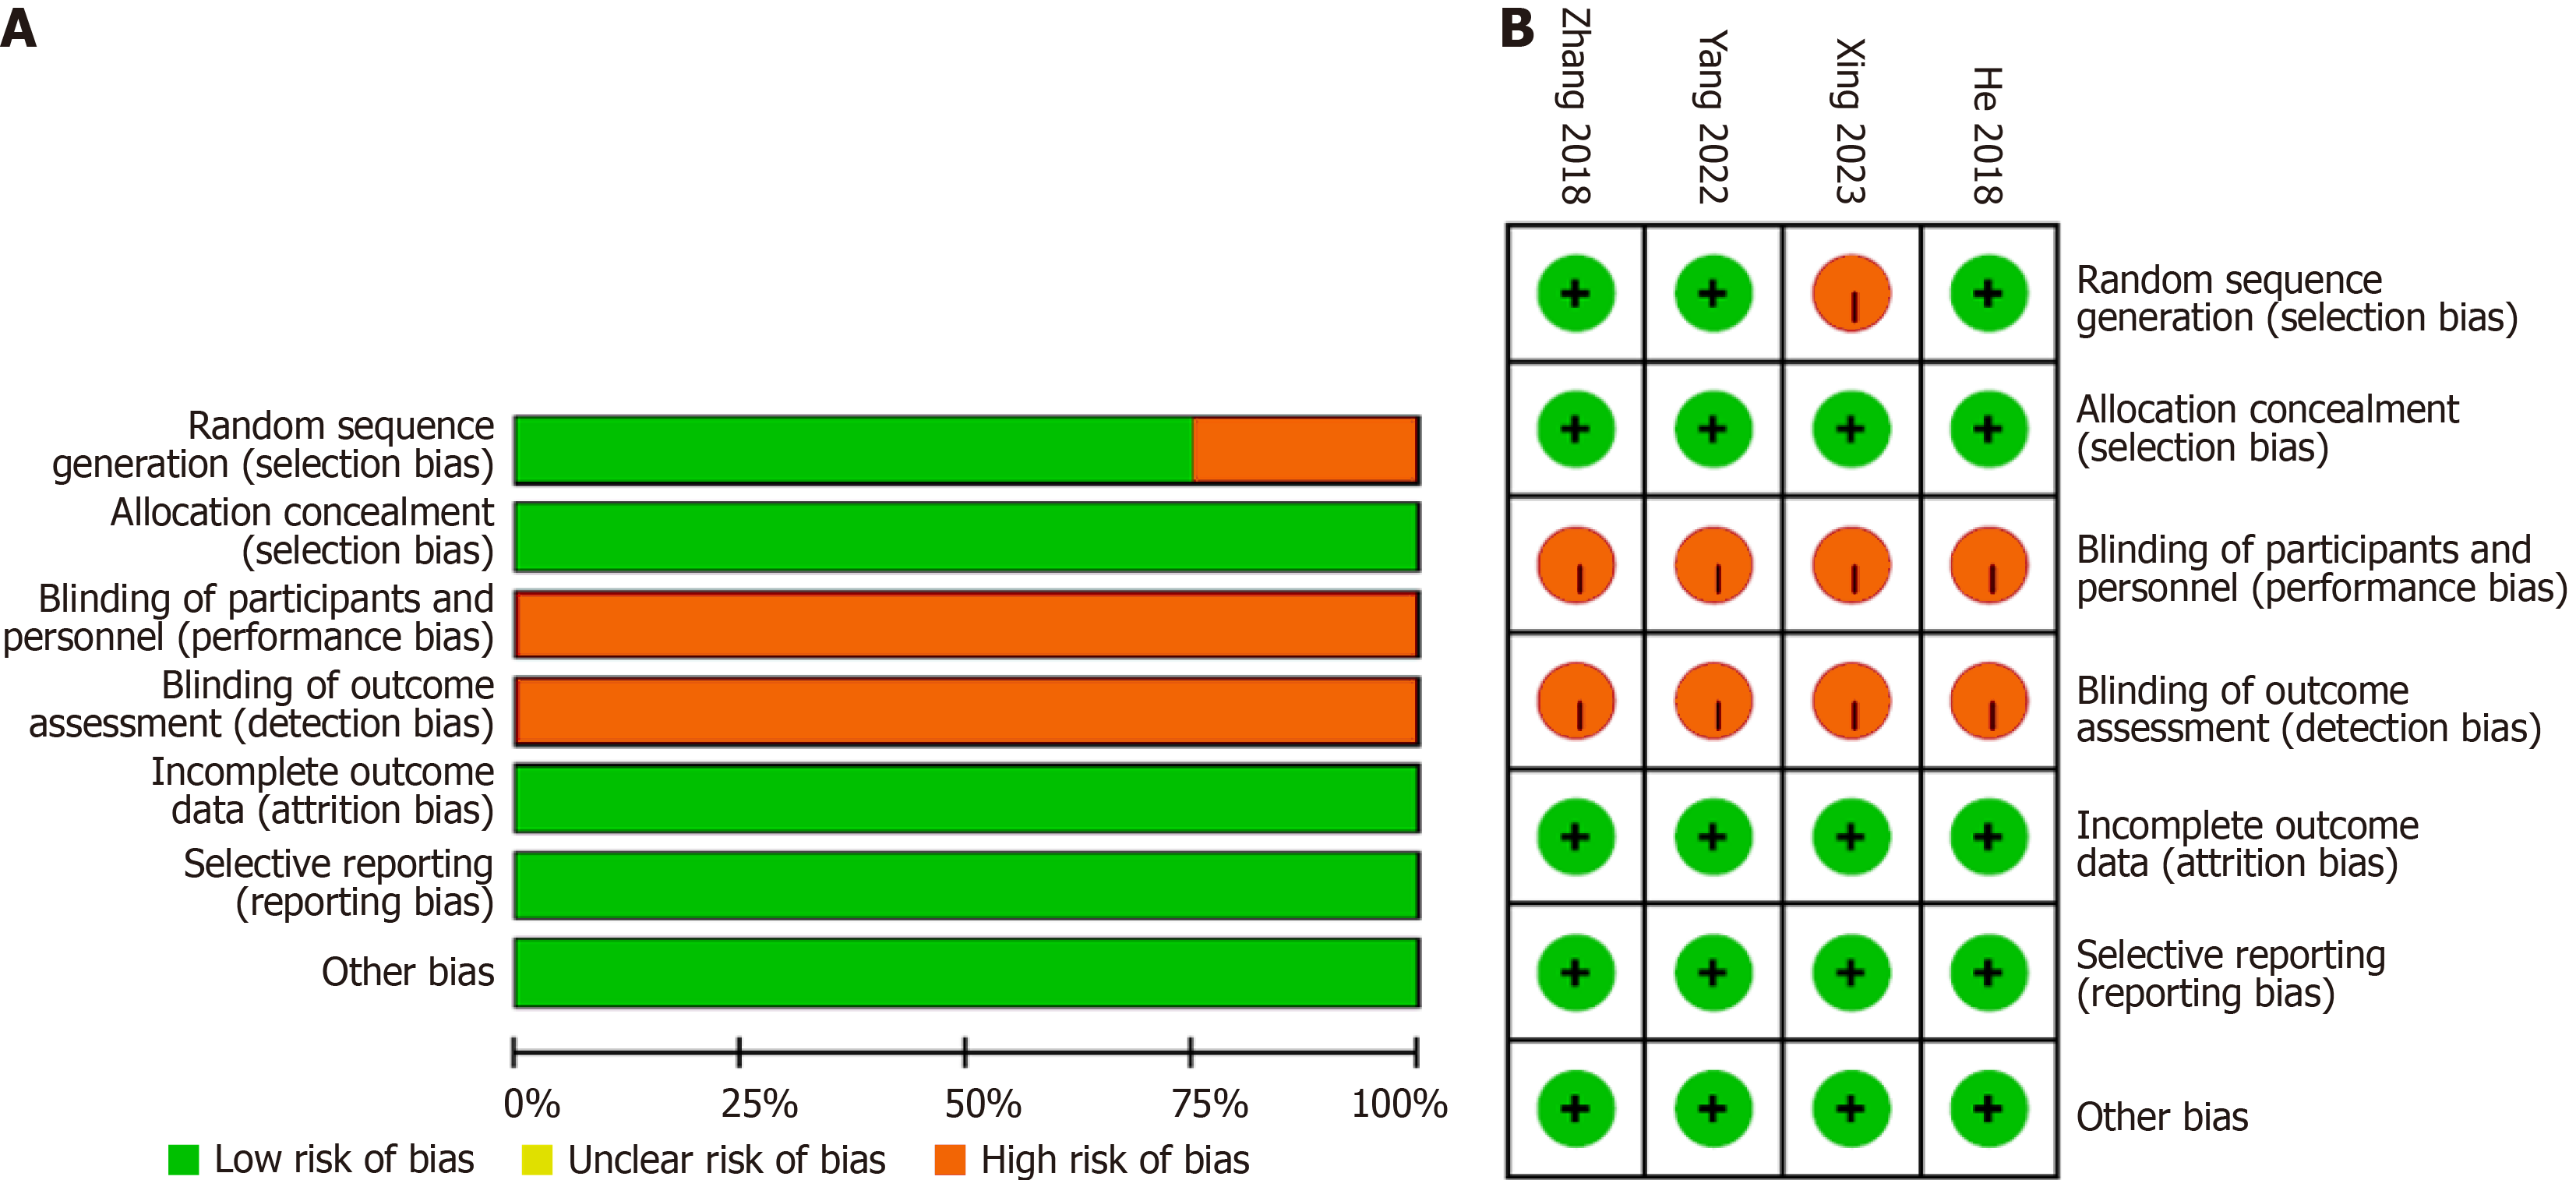
Figure 2 Quality assessment of the included articles according to the Cochrane risk of bias assessment tool.
A: Risk of bias graph; B: Risk of bias summary.
Figure 3 Primary outcome and secondary outcomes.
A: Anastomotic leakage (primary outcome); B: Length of the operation; C: Intraoperative blood loss; D: Length of hospital stay; E: Anal exhaust time; F: Anastomotic bleeding; G: Anastomotic stricture; H: Intestinal obstruction; I: Infection; J: Reoperation. CI: Confidence interval.
Figure 4 Comparison of grade C leakage rate.
CI: Confidence interval.
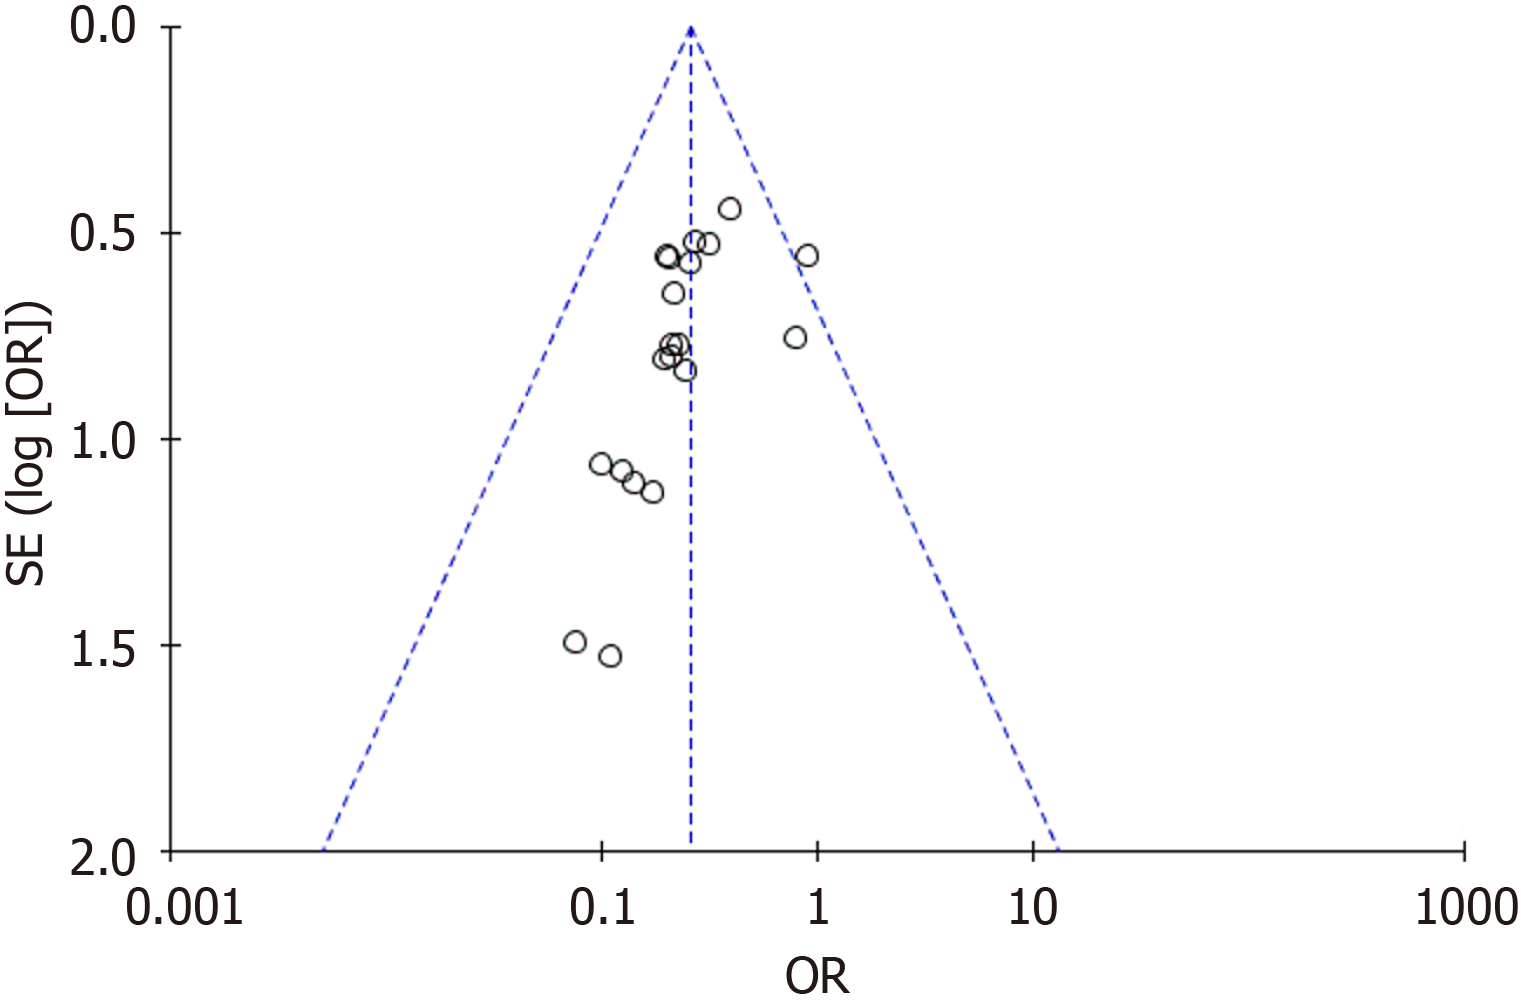
Figure 5 Funnel plot for publication bias basing on anastomotic leakage in included studies.
OR: Odds ratio.
- Citation: Zhuang ZX, Zhang Y, Yang XY, Wang ZQ, Deng XB, Zhang MM. Efficacy of reinforcing sutures in preventing anastomotic leakage after surgery for rectal cancer: A systematic review and metaanalysis. World J Gastrointest Surg 2025; 17(5): 103758
- URL: https://www.wjgnet.com/1948-9366/full/v17/i5/103758.htm
- DOI: https://dx.doi.org/10.4240/wjgs.v17.i5.103758


