©The Author(s) 2025.
World J Gastrointest Surg. Nov 27, 2025; 17(11): 110036
Published online Nov 27, 2025. doi: 10.4240/wjgs.v17.i11.110036
Published online Nov 27, 2025. doi: 10.4240/wjgs.v17.i11.110036
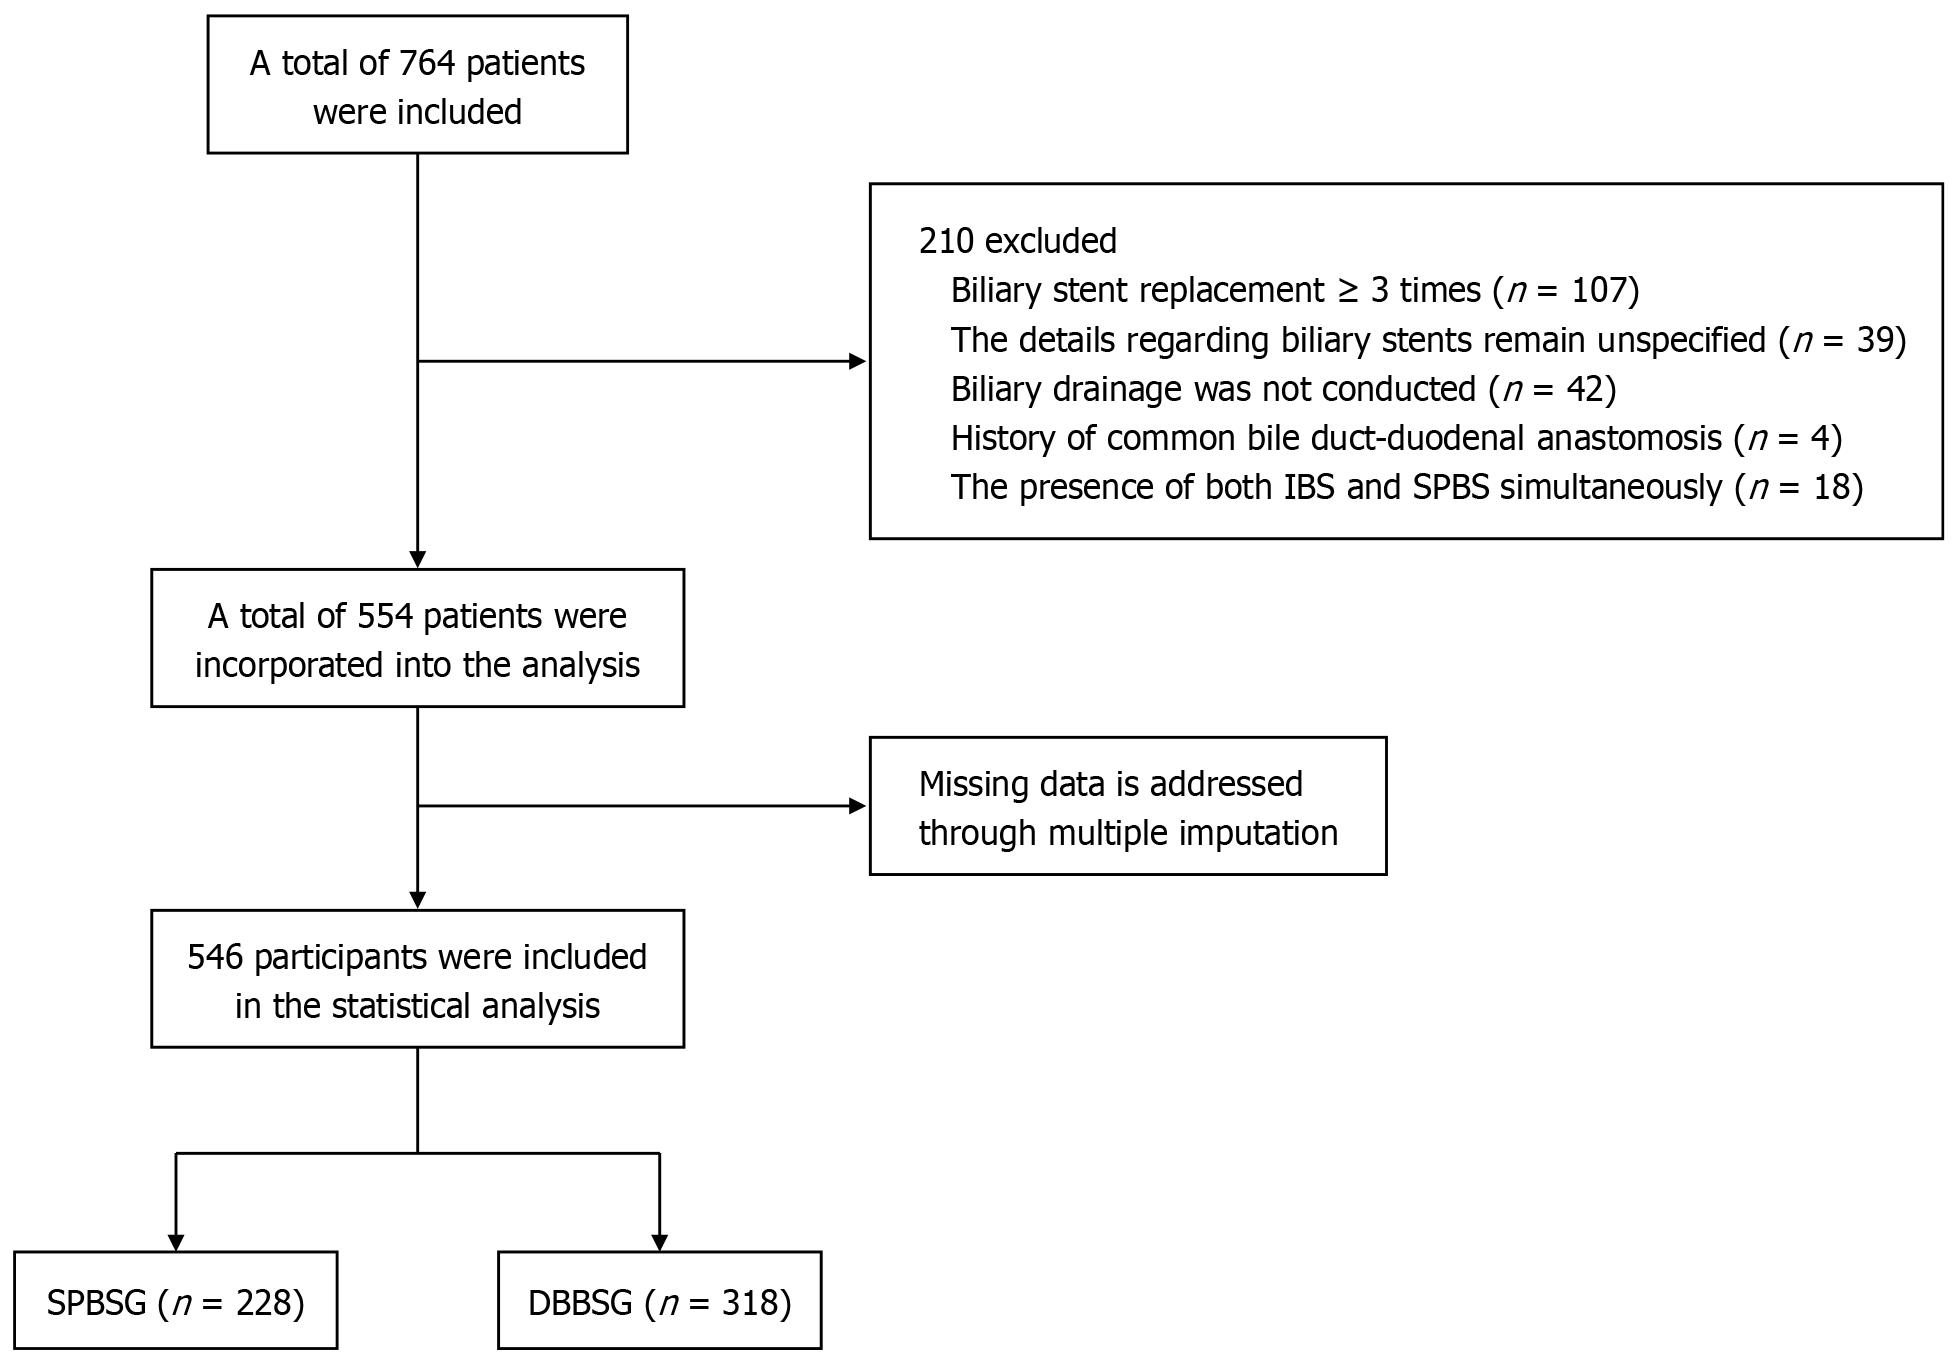
Figure 1 Flow diagram of patient selection.
IBS: Integrated bile duct stent; SPBS: Single pigtail biliary stent; SPBSG: Single pigtail biliary stent group; DBBSG: Duodenal bend biliary stent group.
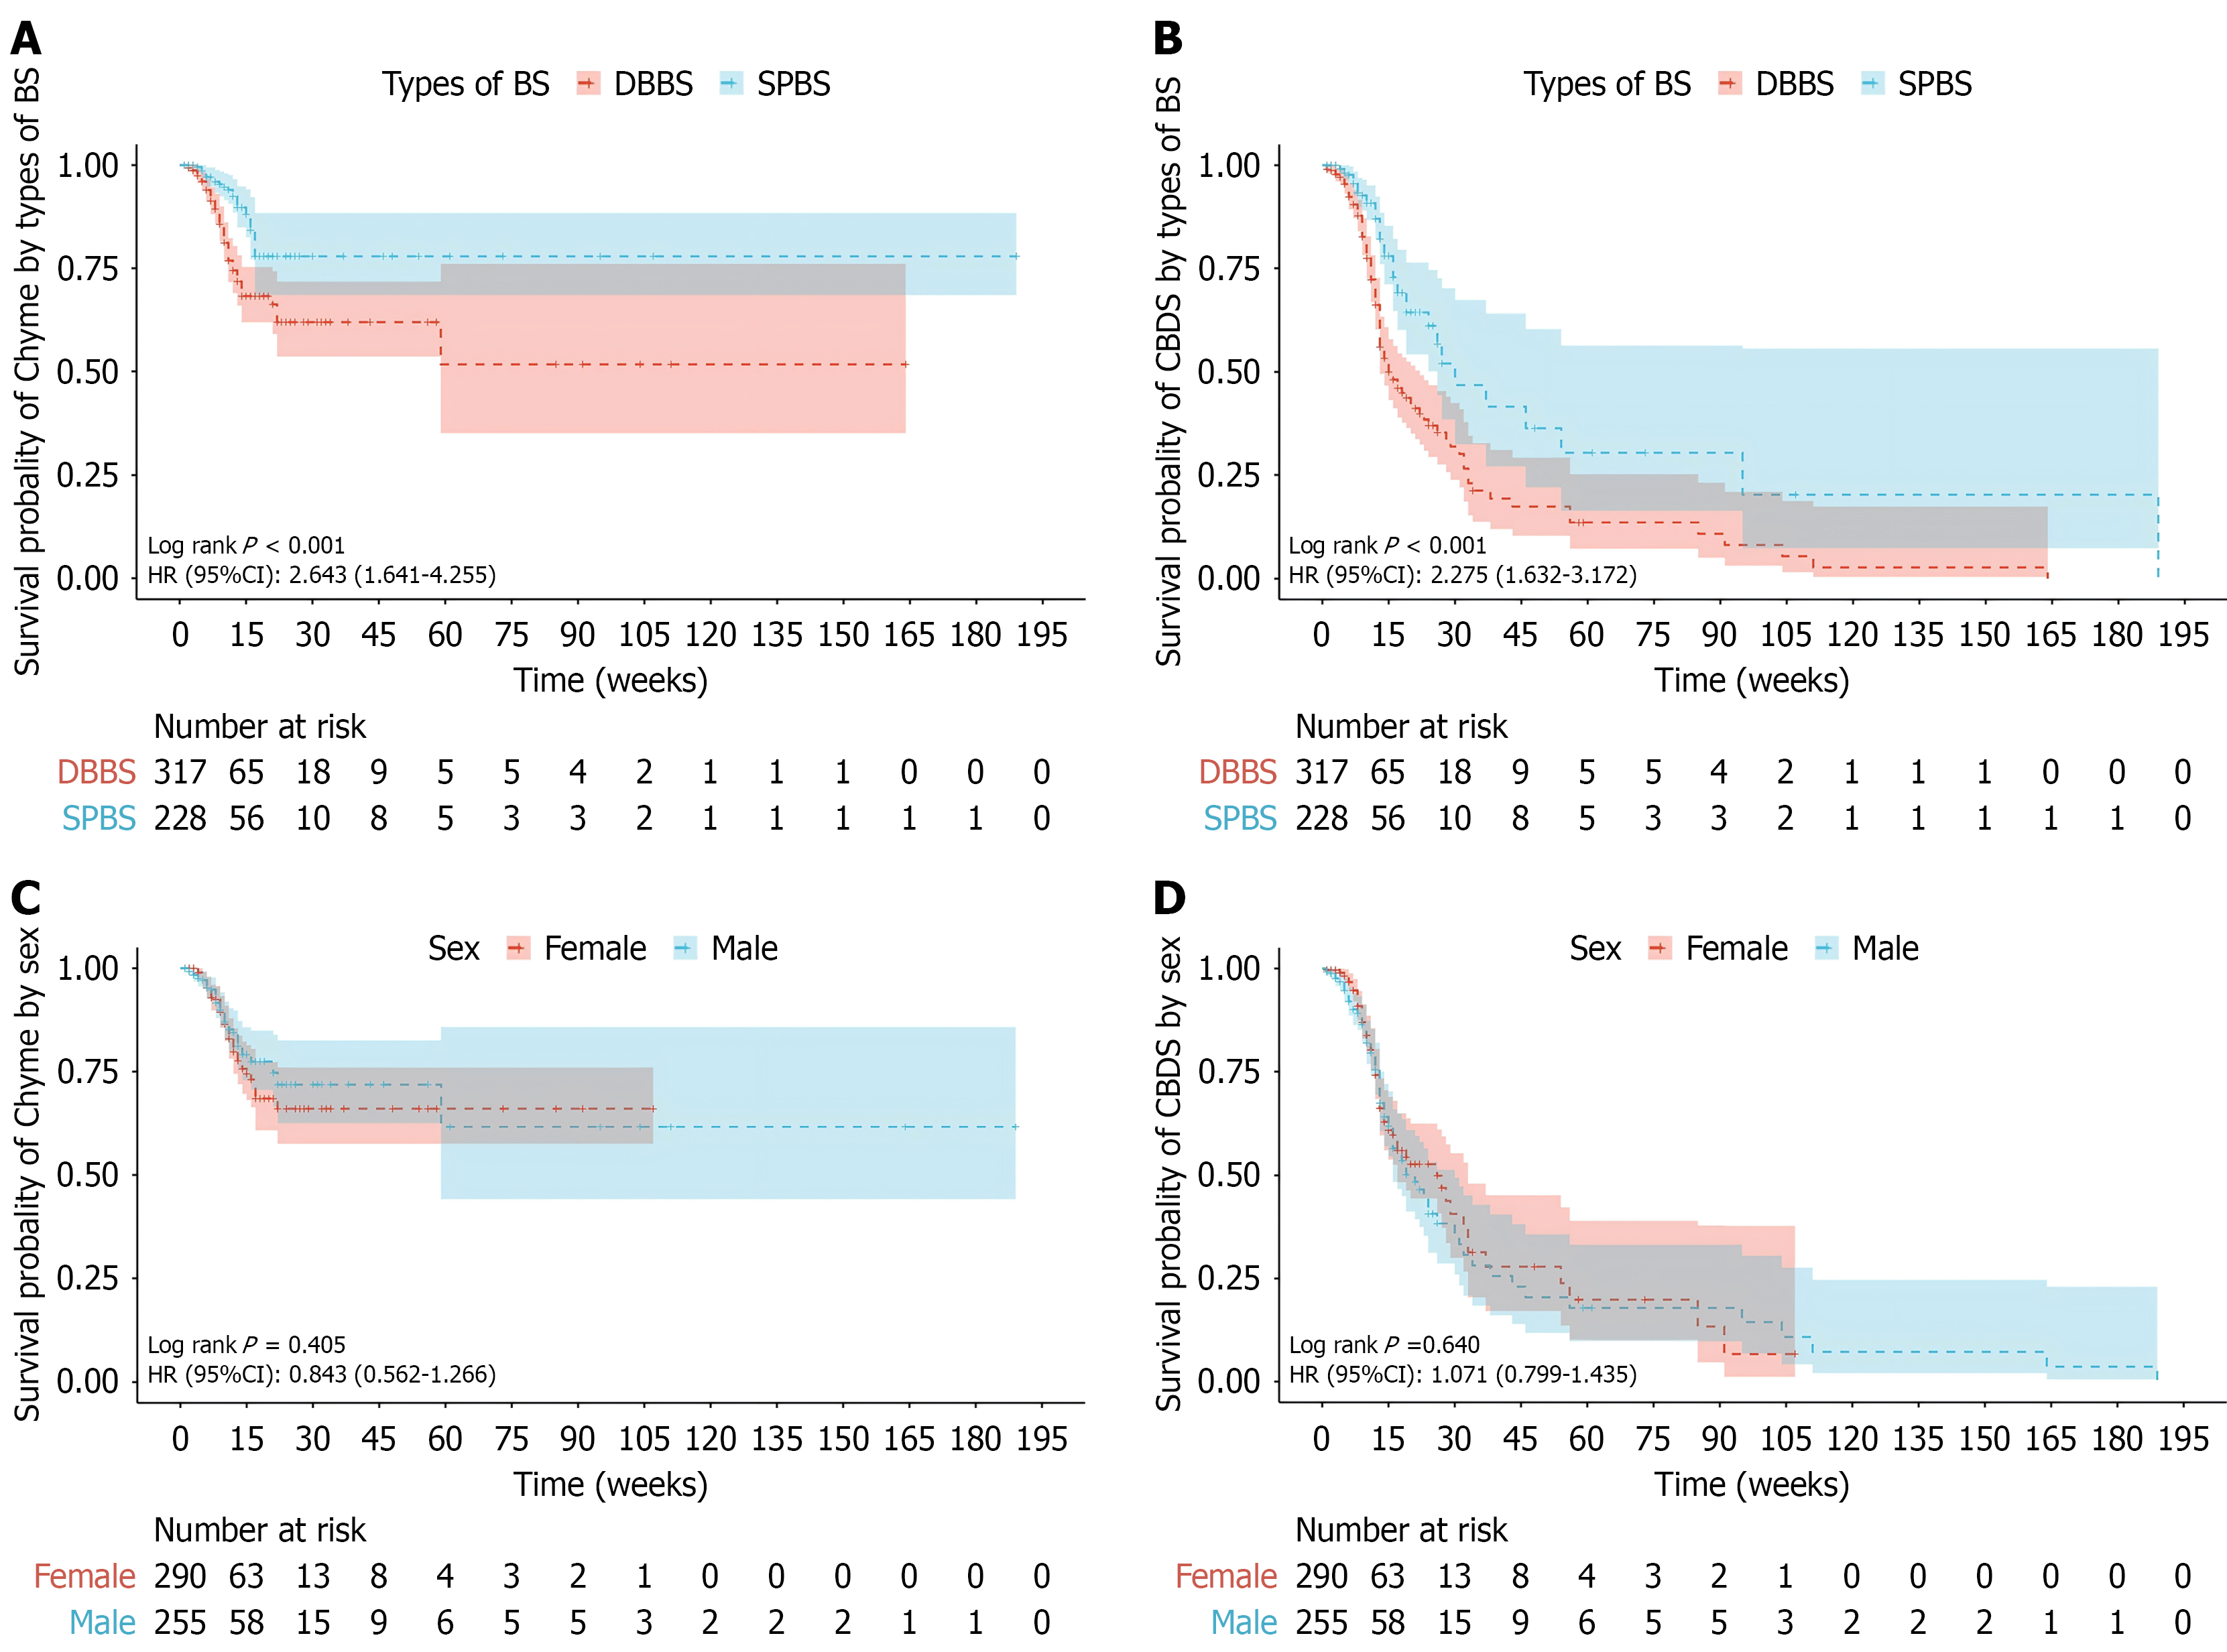
Figure 2 Kaplan-Meier curves for primary outcomes.
A: Probability of chyme reflux by types of biliary stent; B: Probability of common bile duct stones by types of biliary stent; C: Probability of chyme reflux by sex; D: Probability of common bile duct stones by sex. HR: Hazard ratio; CI: Confidence interval; BS: Biliary stent; CBDS: Common bile duct stones; SPBS: Single pigtail biliary stent; DBBS: Duodenal bend biliary stent.
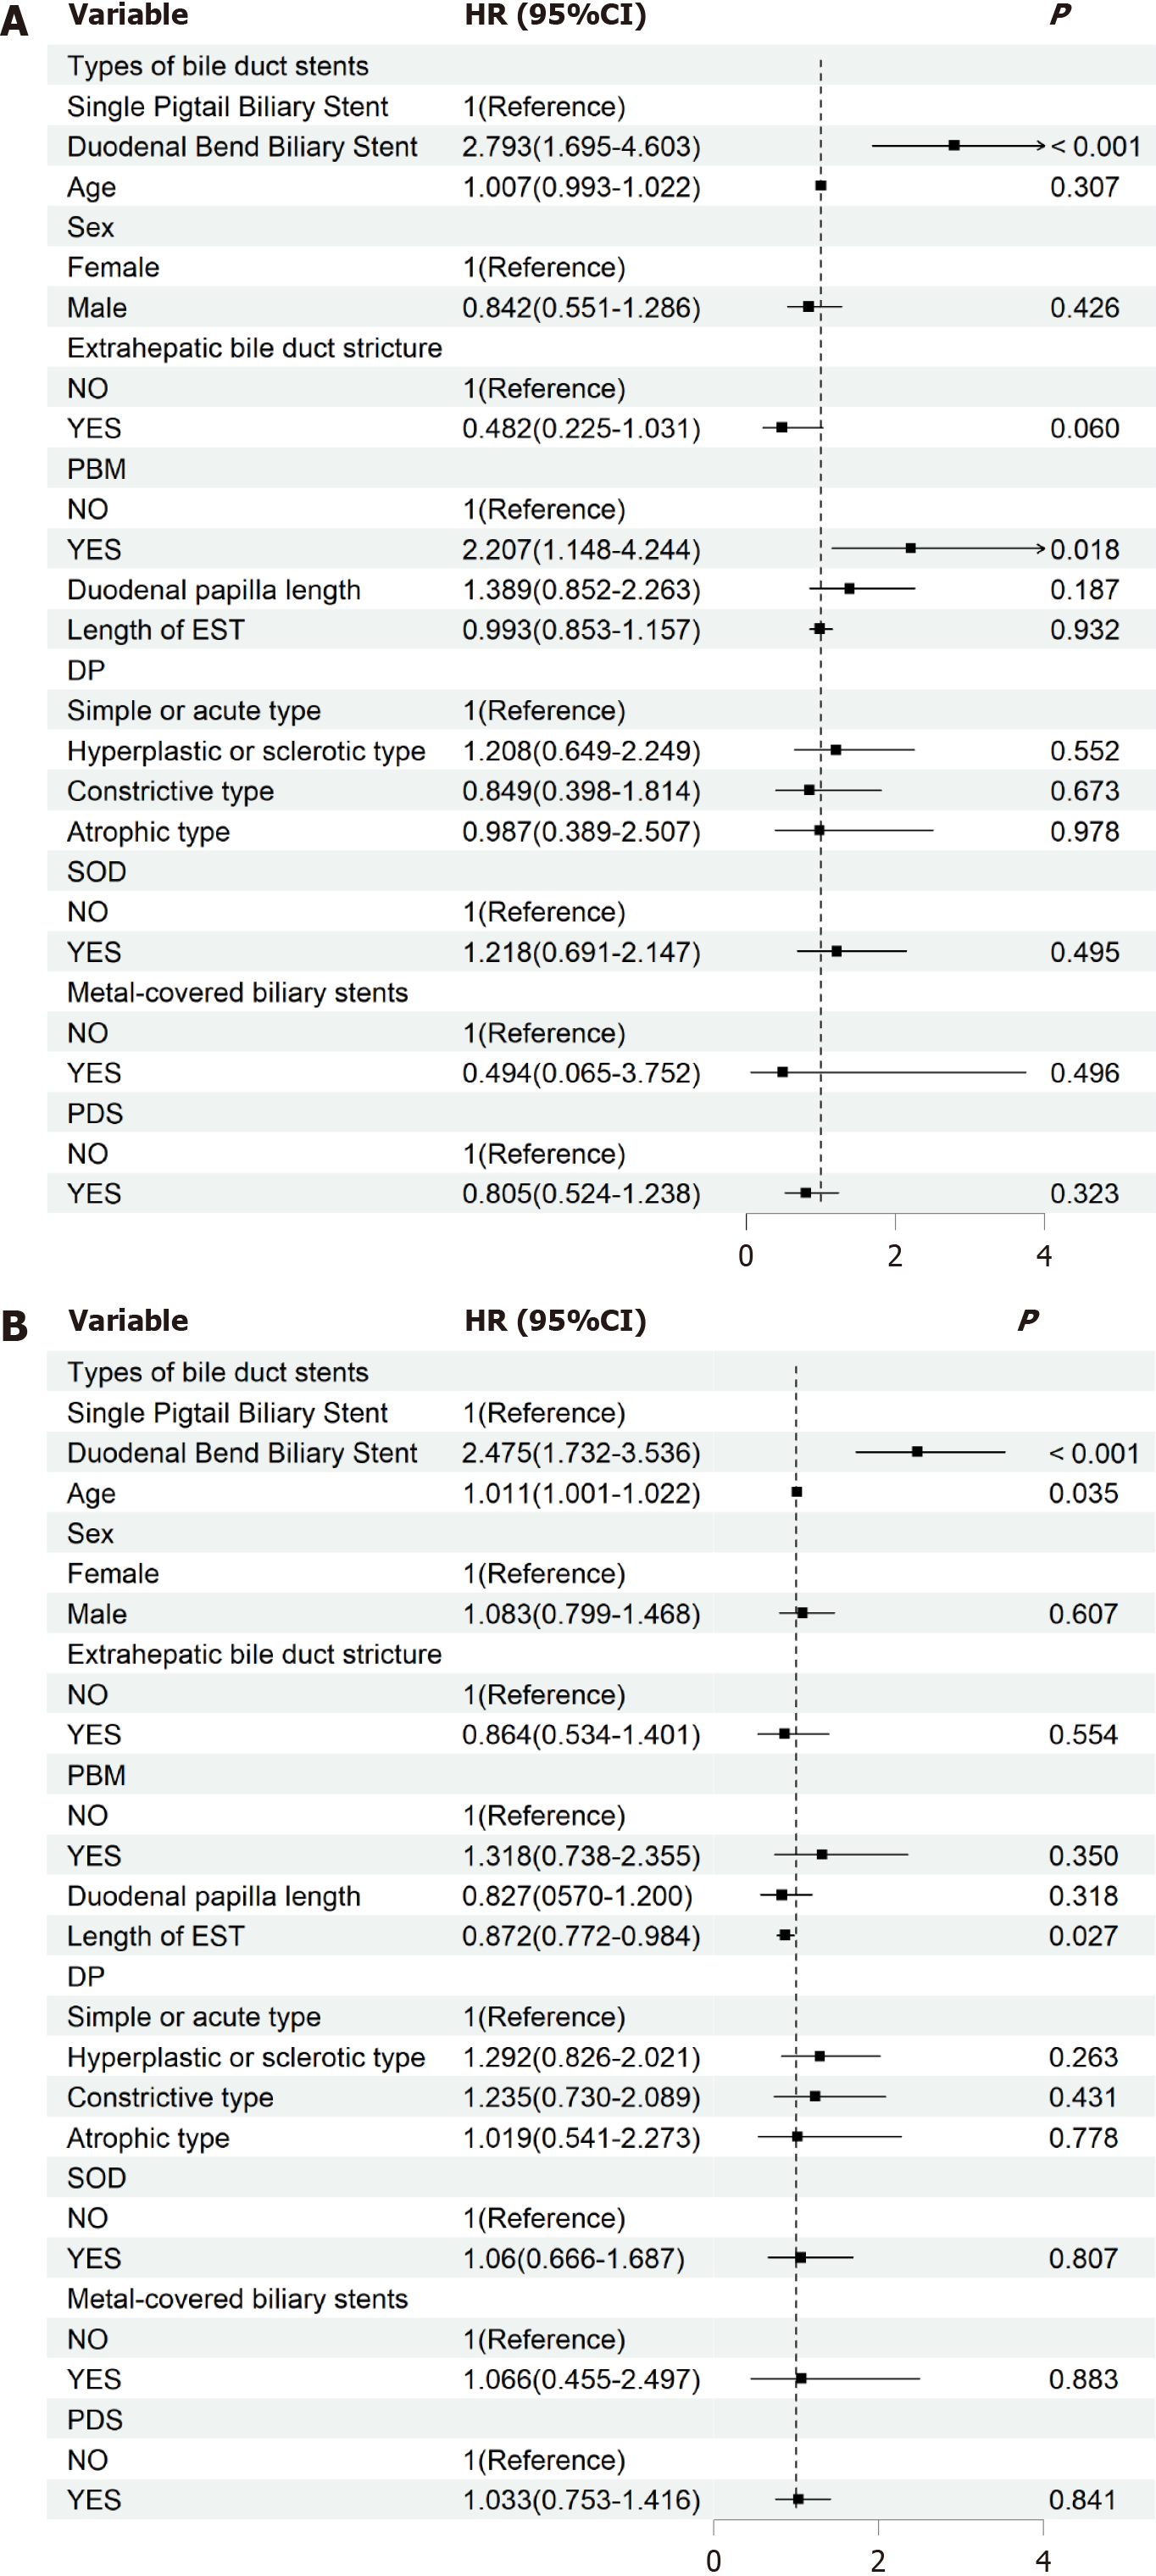
Figure 3 Hazard ratios and 95% confidence intervals of chyme reflux into the bile duct and common bile duct stones according to types of biliary stents.
A: Hazard ratios and 95% confidence intervals of chyme reflux into the bile duct according to types of biliary stents; B: Hazard ratios and 95% confidence intervals of common bile duct stones according to types of biliary stents. HR: Hazard ratio; CI: Confidence interval; PBM: Pancreaticobiliary maljunction; EST: Endoscopic sphincterotomy; DP: Duodenal papillopathy; SOD: Sphincter of Oddi dysfunction; PDS: Pancreatic duct stent.
- Citation: Zhang HL, Zhang C, Qiu C, Zhang BS, Huang AH, Yang JS, Jiang ZY, Zheng L, Hu H, Yang YL. Intra-biliary cleansing during secondary duodenoscopic removal of duodenal bend biliary stents: A retrospective cohort study. World J Gastrointest Surg 2025; 17(11): 110036
- URL: https://www.wjgnet.com/1948-9366/full/v17/i11/110036.htm
- DOI: https://dx.doi.org/10.4240/wjgs.v17.i11.110036


