Published online Nov 27, 2025. doi: 10.4240/wjgs.v17.i11.109991
Revised: August 16, 2025
Accepted: September 15, 2025
Published online: November 27, 2025
Processing time: 182 Days and 9.8 Hours
Early detection of precancerous lesions is of vital importance for reducing the incidence and mortality of upper gastrointestinal (UGI) tract cancer. However, traditional endoscopy has certain limitations in detecting precancerous lesions. In contrast, real-time computer-aided detection (CAD) systems enhanced by artificial intelligence (AI) systems, although they may increase unnecessary medical proce
To investigate the improvement of the efficiency of EGD examination by the real-time AI-enabled real-time CAD system (AI-CAD) system.
PubMed, EMBASE, Web of Science and Cochrane Library databases were sear
The initial search identified 802 articles. According to the inclusion criteria, 2113 patients from 10 studies were included in this meta-analysis. The pooled accuracy difference, logarithmic difference of diagnostic odds ratios, sensitivity, specificity and the area under the summary receiver operating characteristic curve (area under the curve) of both AI group and endoscopist group for detecting precancerous lesion were 0.16 (95%CI: 0.12-0.20), -0.19 (95%CI: -0.75-0.37), 0.89 (95%CI: 0.85-0.92, AI group), 0.67 (95%CI: 0.63-0.71, endoscopist group), 0.89 (95%CI: 0.84-0.93, AI group), 0.77 (95%CI: 0.70-0.83, endoscopist group), 0.928 (95%CI: 0.841-0.948, AI group), 0.722 (95%CI: 0.677-0.821, endoscopist group), respectively.
The present studies further provide evidence that the AI-CAD is a reliable endoscopic diagnostic tool that can be used to assist endoscopists in detection of precancerous lesions in the UGI tract. It may be introduced on a large scale for clinical application to enhance the accuracy of detecting precancerous lesions in the UGI tract.
Core Tip: This meta-analysis indicates that the artificial intelligence-enabled real-time computer-aided detection system (AI-CAD) system is superior to endoscopists in detecting precancerous lesions of the upper gastrointestinal (UGI) tract. Its sensitivity, specificity, and diagnostic accuracy are higher, which is helpful in improving lesion recognition ability and may reduce the rate of missed diagnoses. These findings support the clinical potential of integrating AI-CAD into routine endoscopy practice to enhance the early detection and prevention of UGI cancers.
- Citation: Li ZY, Liu YH, Cai HQ. Diagnostic value of real-time computer-aided detection for precancerous lesion during esophagogastroduodenoscopy: A meta-analysis. World J Gastrointest Surg 2025; 17(11): 109991
- URL: https://www.wjgnet.com/1948-9366/full/v17/i11/109991.htm
- DOI: https://dx.doi.org/10.4240/wjgs.v17.i11.109991
Upper gastrointestinal (UGI) malignancies [including esophageal squamous cell carcinoma (ESCC), Barrett-associated adenocarcinoma and gastric cancer] have now become a major global public health challenge. According to the latest data from the International Agency for Research on Cancer, in 2022, there were over 1.7 million new cases of UGI cancers worldwide, with esophageal cancer and gastric cancer accounting for 3.1% and 5.6% respectively, and the 5-year survival rates of both are generally below 30%[1]. More than 40% of patients with ESCC are diagnosed after the disease has metastasized, and the 5-year survival rate is less than 20%[2]. The 5-year survival rate for early-stage gastric cancer can reach 92.6%[3], while that for advanced-stage gastric cancer is only 25%[4]. The above data indicate that early diagnosis of UGI cancers is of vital importance. Precancerous lesions of the UGI tract [such as atypical hyperplasia, Barrett-related lesions, intestinal metaplasia (IM), and chronic atrophic gastritis (CAG)] are the key reversible stages in the development of cancer, and early detection and intervention of precancerous lesions can reduce the mortality rate of advanced cancer significantly.
Currently, white light endoscopy (WLE) remains the conventional method for screening precancerous lesions, but its diagnostic efficacy is highly dependent on the experience of the endoscopist and missed diagnosis remains relatively common. A systematic review incorporating 22 studies demonstrated that the proportion of missed gastric cancer diagnoses by endoscopists was 9.4% (95%CI: 5.7%-13.1%). This indicates that approximately 1 in every 10 gastric cancer cases may be missed during the initial endoscopy, and the majority (69%) of these missed cancers were early-stage gastric cancers[5]. In addition, a prospective study has also evaluated the consistency and accuracy of 5 experienced endoscopists and 5 Less-experienced endoscopists in diagnosing IM using high-definition (HD) endoscopy. The results showed that the experienced endoscopist group had a κ value of 0.38 (95%CI: 0.25-0.52), while the less-experienced endoscopist group had a κ value of 0.33 (95%CI: 0.20-0.47). Both values indicate poor inter-observer agreement, highlighting the significant impact of the technical divide caused by unequal distribution of medical resources on the diagnosis of precancerous lesions of the UGI tract[6].
Artificial intelligence-enhanced real-time computer-aided detection systems (AI-CAD) have enabled real-time analysis of endoscopic images through deep learning algorithms, such as convolutional neural networks. A prospective study involving 450 patients demonstrated that AI-CAD significantly enhanced the detection capability of non-expert endoscopists for Barrett's esophagus (BE), increasing their neoplasia detection rate by an average of approximately 12%[7]. This indicates that AI-CAD has the potential to both improve the accuracy of detecting precancerous lesions in the UGI tract and reduce variability among operators.
Although some studies have discussed the diagnostic role of AI-CAD in early cancer detection, they mostly focus on single target organs or offline image analysis, lacking a systematic evaluation of the diagnostic performance of AI-CAD in detecting precancerous lesions of the UGI tract in real-time scenarios[8-10]. Additionally, there are limited direct comparisons between artificial intelligence (AI) and endoscopists, and the sources of heterogeneity have not yet been clarified, making it difficult to provide a solid evidence base for the widespread clinical application of AI-CAD in detecting precancerous lesions of the UGI tract. Based on the above limitations, this study aims to systematically review prospective real-time AI-CAD studies published up to April 2025. Through meta-analysis, we first quantitatively evaluate the pooled sensitivity, specificity, and the area under the summary receiver operating characteristic (SROC) curve area under the curve (AUC) of AI-CAD in detecting precancerous lesions during routine esophagogastroduodenoscopy (EGD). We then directly compare AI-CAD with endoscopists alone using differences in diagnostic accuracy and logarithm of diagnostic odds ratios log(DOR). In addition, subgroup analyses and meta-regression are conducted to explore sources of heterogeneity, providing evidence-based support for the clinical application of AI-CAD and guiding future research directions. It should be noted that the present study did not involve the design, training, or deployment of any AI-CAD system. Instead, we performed a meta-analysis to synthesize their diagnostic performance in detecting UGI precancerous lesions.
To retrieve all relevant publications up to April 30, 2025, two independent reviewers (Li ZY and Cai HQ) searched four databases, including PubMed, EMBASE, Web of Science, and Cochrane Library. The search strategy logic was defined as follows: “Artificial intelligence” or “Machine learning” or “Deep learning”, and “Computer-aided detection” or “CAD”, and “Precancerous conditions” or “Precancerous lesion”, and “Stomach neoplasms” or “Esophageal neoplasms”. The detailed search strategy is presented in Supplementary Table 1. To identify potential studies, the reference lists of all relevant publications were checked and we also followed up on the clinical trials registered in the Cochrane Library database.
All articles were independently screened by two reviewers (Li ZY and Cai HQ) based on predefined inclusion and exclusion criteria. The inclusion criteria were as follows: (1) Participants: Patients undergoing EGD, with lesions involving precancerous conditions of the UGI tract, including BE, esophageal squamous intraepithelial neoplasia, gastric intraepithelial neoplasia, IM, and CAG; (2) Intervention: Endoscopic examination assisted by real-time AI-CAD systems; (3) Comparison: Conventional endoscopic examination performed by endoscopists without AI assistance; (4) Diagnostic criteria: Histopathological confirmation as the gold standard; (5) Study design: Original studies, including randomized controlled trials, prospective studies, retrospective cohort studies, and case-control studies; (6) Outcomes: Studies repor
For each study that does meet the inclusion criteria and does not violate any exclusion criteria, two independent reviewers (Li ZH and Cai HQ) extracted the following data: First author, year of publication, country, ethnicity, study design, total sample size, type of lesion, EGD imaging modality, and the AI model used for lesion segmentation. Diagnostic parameters including true positives, false positives, false negatives, and true negatives values were recorded in 2 × 2 contingency tables. In cases of discrepancies between the reviewers, a third investigator (Liu YH) assessed the disagreement and resolved it through consensus. To detect possible publication bias, a Deek's funnel plot was drawn based on the available data. To evaluate the quality of the included literature, two independent reviewers (Li ZH and Cai HQ) conducted quality assessment using the Quality Assessment of Diagnostic Accuracy Studies-2 (QUADAS-2) tool. QUADAS-2 assesses the risk of bias and applicability concerns across four domains: Patient selection, index test, reference standard, and flow and timing.
First, presence of threshold effect was assessed. A P-value greater than 0.05 for Spearman’s correlation coefficient was interpreted as indicating no significant threshold effect, whereas a P-value less than or equal to 0.05 suggested that heterogeneity might be attributable to a threshold effect. If no significant threshold effect was identified, heterogeneity due to non-threshold effects was further evaluated. Heterogeneity was assessed using the P-value of Cochran’s Q test and the I² statistic. If P-value was less than 0.05 and the I² exceeded 50%, significant heterogeneity was considered present, and a random-effects model was applied. Conversely, if P-value exceeded 0.05 and the I² was less than 50%, studies were considered to have acceptable consistency, and a fixed-effects model was used.
A random-effects model for single proportions was ultimately employed to calculate the pooled sensitivity and specificity of the AI-CAD group and the endoscopist group. A univariable random-effects model was applied to estimate the pooled difference in diagnostic accuracy and log(DOR) between the two groups. Forest plots were used to display the pooled effect sizes along with their 95% confidence intervals (CI). A SROC curve was constructed to evaluate the diagnostic superiority of the AI-CAD group compared to the endoscopist group, and the AUC was calculated-where a higher AUC indicates greater diagnostic performance.
Given the presence of substantial heterogeneity, subgroup analyses and meta-regression were performed to explore potential sources. In addition, sensitivity analyses were conducted to assess the robustness of the findings. All meta-analyses were conducted using R 4.5.0 and Stata 18.0.
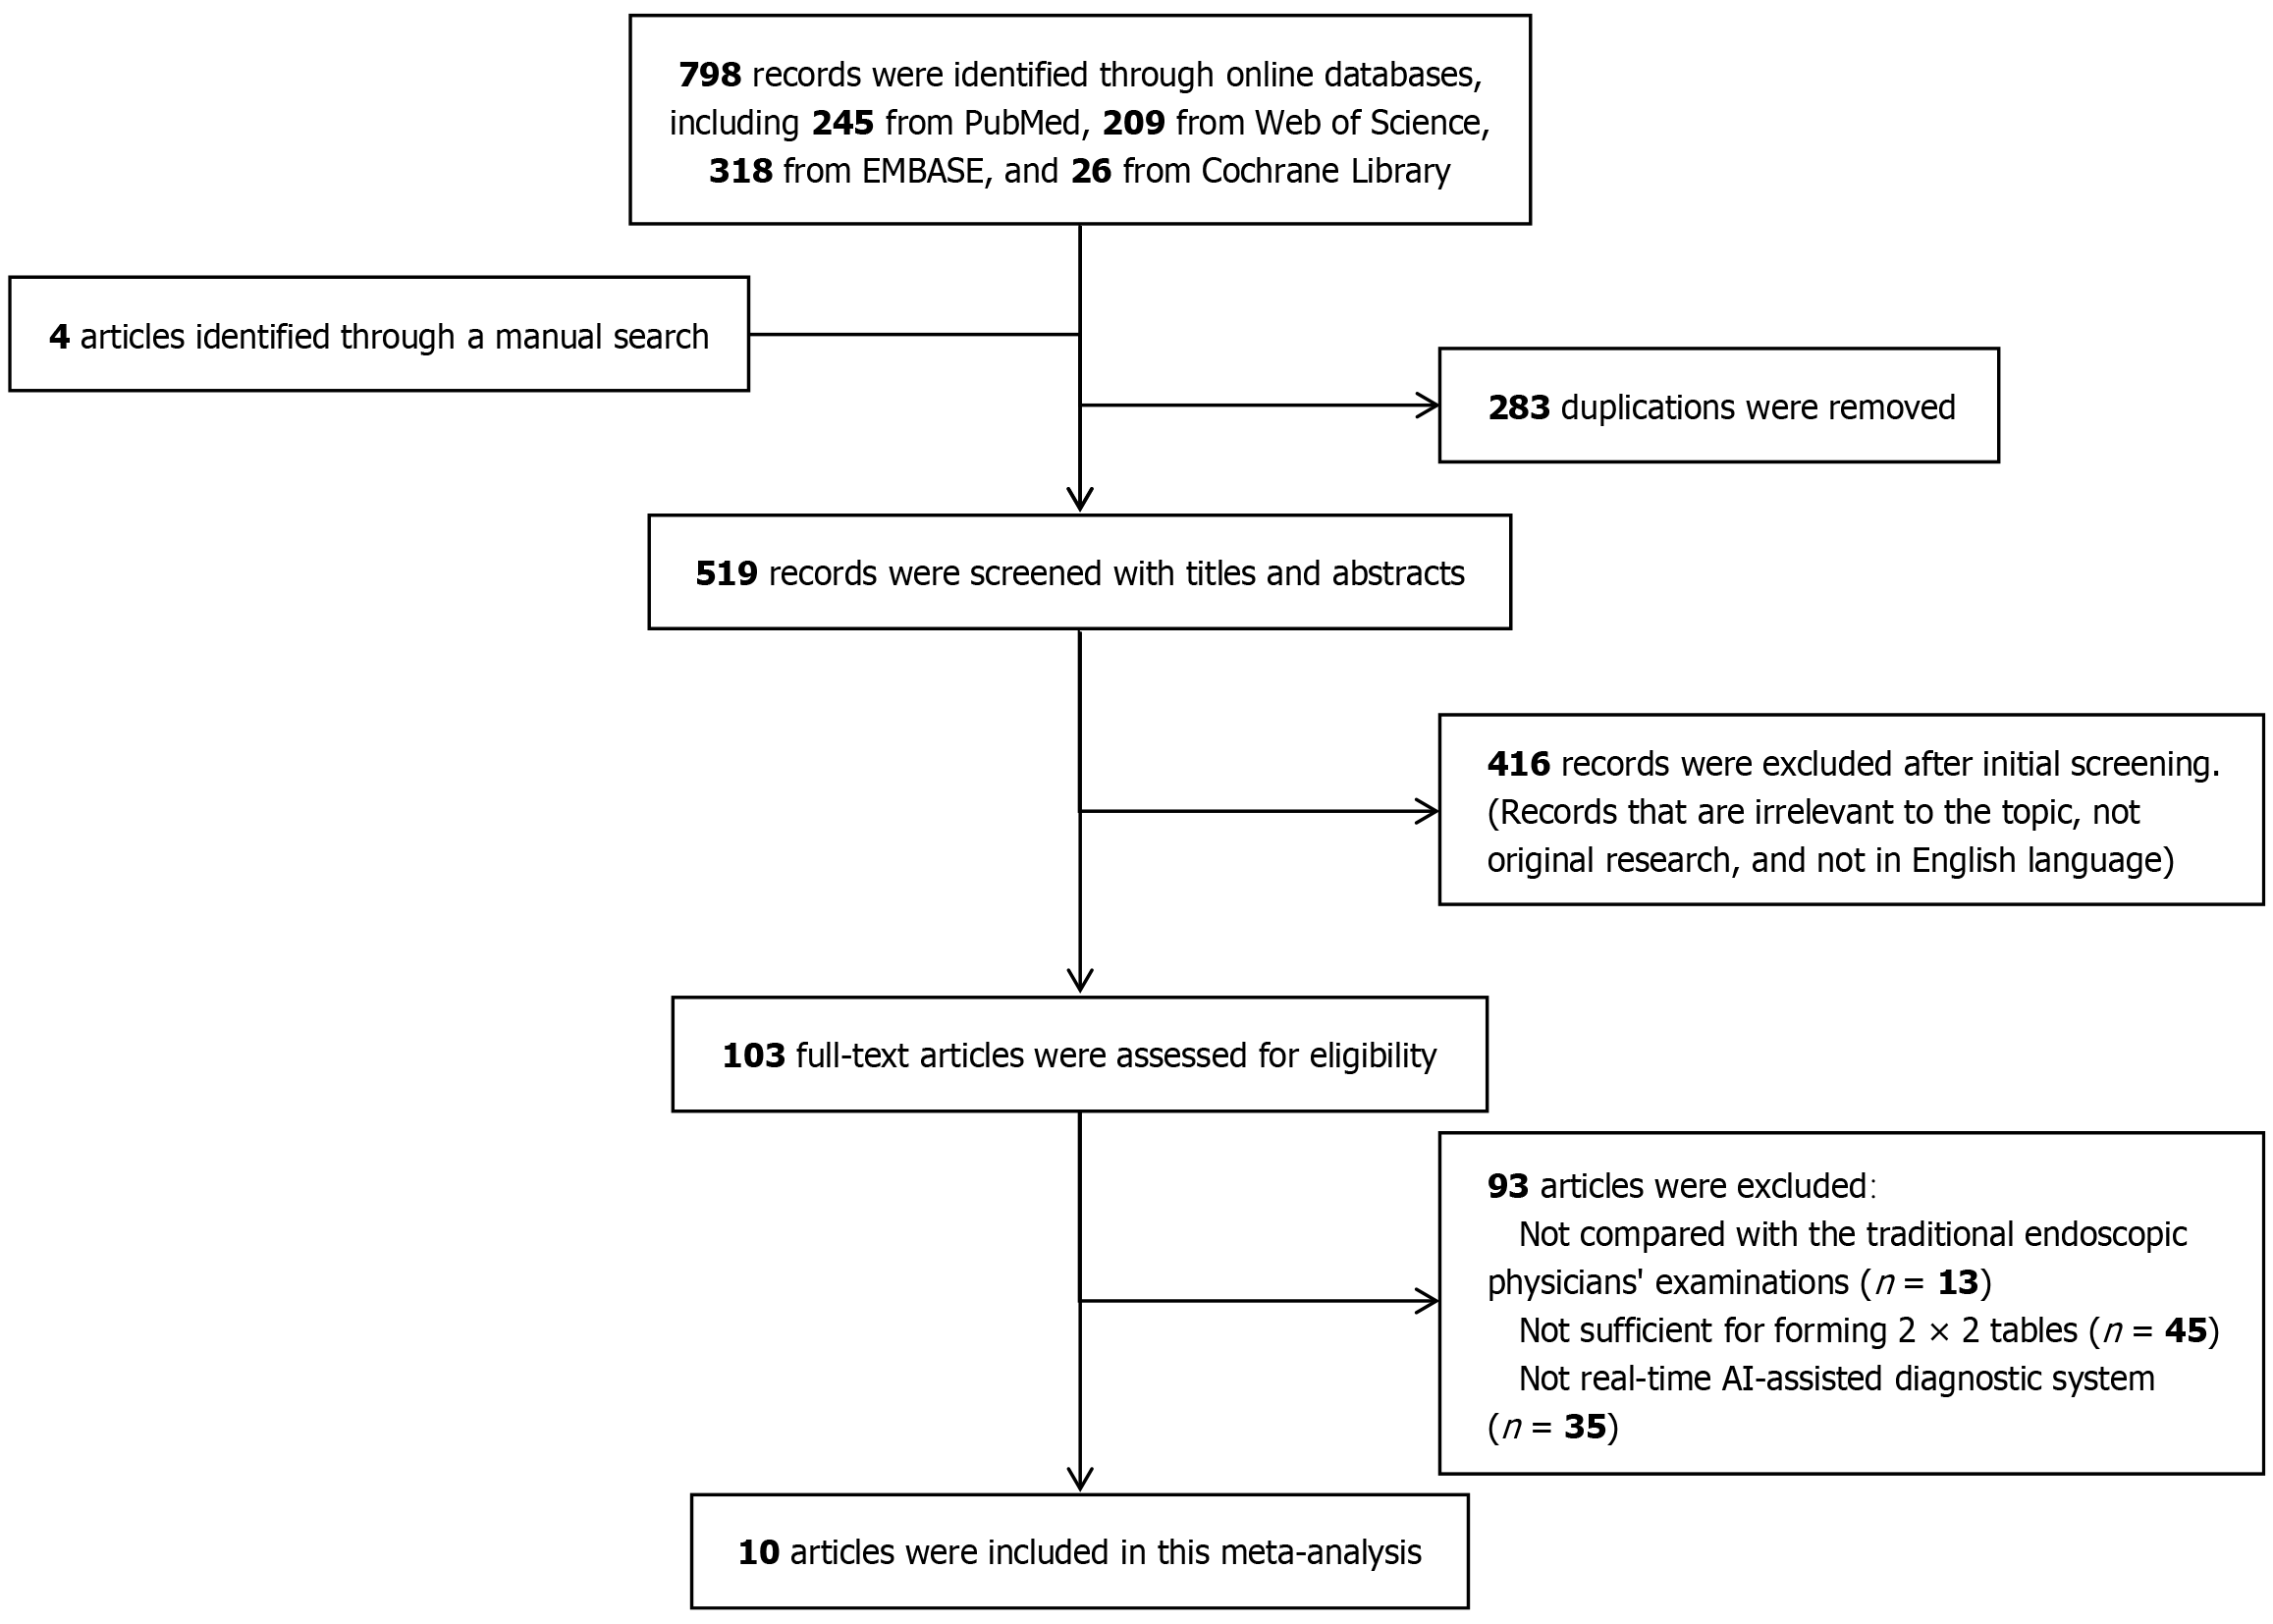
Following the methodology described above, we present here the results of the systematic literature search, study selection process, and quality appraisal of the included studies. According to the search strategy, a total of 798 articles were retrieved from four databases: PubMed, EMBASE, Web of Science, and the Cochrane Library. Additionally, 4 studies listed as ongoing in the Cochrane Library were subsequently confirmed and included after follow-up. No additional records were identified through manual screening of reference lists of the included literature. Among the retrieved articles, 283 were excluded due to duplication. A further 509 articles were excluded for not meeting the inclusion criteria: 416 were excluded based on title and abstract screening due to reasons such as irrelevant target disease (non-UGI precancerous lesions), non-original research, or non-English language; 93 articles were excluded after full-text review, including 13 without a comparison group of conventional endoscopists, 45 due to insufficient data for constructing a 2 × 2 contingency table, and 35 due to use of non-real-time AI-CAD interventions. Ultimately, 10 studies were included in this meta-analysis (Figure 1).
These 10 eligible studies[11-20] enrolled a cumulative total of 2113 patients, with a mean sample size of 211 (range 61-676), and were included in the present meta-analysis. All investigations adopted prospective designs, 8 conventional cohort studies, and 2 paired cohort studies. The studies were conducted in China (n = 5), the Netherlands (n = 2), the United Kingdom (n = 2), and Germany (n = 1), yielding a balanced ethnic distribution (5 Asian and 5 Caucasian cohorts). Regarding the target condition, Barrett’s-related neoplasia was examined in 5 studies, CAG in 4 studies, and gastric IM (GIM) in one study. Most datasets were acquired with HD-WLE (4/10) or narrow-band imaging (NBI, 3/10); the remainder used blue-light imaging (BLI), volumetric laser endomicroscopy, or multimodal combinations. A variety of deep-learning architectures were implemented for real-time AI-CAD: U-Net and its variants were the most common (3/10), while the remaining studies employed ResNet, EfficientNet-B4, VGG-16, FCN-ResNet-50, SegNet, and DeepLab-V3+. Across all trials, histopathology served as the reference standard for lesion confirmation. Collectively, these studies provide a geographically and methodologically diverse evidence base for assessing the diagnostic performance of real-time AI-assisted endoscopy in detecting precancerous lesions of UGI tract (Table 1). To facilitate a clearer understanding of methodological variability, we summarizes the essential technical characteristics of the AI-CAD systems used in the included studies (Table 2).
| Ref. | Year | Location | Ethnicity | Study design | Sample size | Type of lesion | Imaging modality | AI model for segmentation | Diagnostic power | ||||||||
| Case | Control | ||||||||||||||||
| Case | Control | TP | FP | FN | TN | TP | FP | FN | TN | ||||||||
| van der Putten et al[11] | 2020 | Netherlands | Caucasian | Cohort | 80 | 80 | Barrett’s neoplasia | BLI | ResNet | 37 | 7 | 3 | 33 | 29 | 10 | 11 | 30 |
| Yan et al[12] | 2020 | China | Asian | Cohort | 80 | 80 | GIM | NBI | EfficientNet B4 | 34 | 6 | 3 | 37 | 32 | 8 | 5 | 35 |
| Struyvenberg et al[13] | 2021 | Netherlands | Caucasian | Cohort | 134 | 134 | Barrett’s neoplasia | VLE | VGG16 | 36 | 17 | 3 | 78 | 27 | 14 | 12 | 81 |
| Hussein et al[14] | 2022 | United Kingdom | Caucasian | Cohort | 61 | 61 | Barrett’s neoplasia | WLE | FCNResNet 50 | 27 | 4 | 1 | 29 | 22 | 17 | 6 | 16 |
| Zhao et al[15] | 2022 | China | Asian | Cohort | 268 | 268 | CAG | NBI | U-Net | 96 | 10 | 13 | 149 | 66 | 27 | 43 | 132 |
| Zhao et al[16] | 2022 | China | Asian | Paired cohort study | 676 | 676 | CAG | WLE | U-Net | 284 | 10 | 54 | 328 | 212 | 61 | 126 | 277 |
| Abdelrahim et al[17] | 2023 | United Kingdom | Caucasian | Cohort | 75 | 75 | Barrett’s neoplasia | WLE | SegNet | 30 | 4 | 2 | 39 | 20 | 10 | 12 | 33 |
| Zhao et al[18] | 2023 | China | Asian | Paired cohort study | 524 | 524 | CAG | NBI | U-Net | 234 | 25 | 28 | 237 | 177 | 78 | 85 | 184 |
| Meinikheim et al[19] | 2024 | Germany | Caucasian | Cohort | 96 | 96 | Barrett’s neoplasia | Multi-modal | DeepLab V3+ | 40 | 12 | 11 | 33 | 36 | 15 | 15 | 30 |
| Tao et al[20] | 2024 | China | Asian | Cohort | 119 | 119 | CAG | WLE | U-Net++ | 74 | 3 | 4 | 38 | 55 | 4 | 23 | 37 |
| Ref. | Year | AI model type | Hardware configuration | Processing speed | Dataset size | Risk stratification tool |
| van der Putten et al[11] | 2020 | Integrated U-Net + Transfer Learning | Titan Xp 12GB GPU | < 2 sec/frame | 500000 frames | None |
| Yan et al[12] | 2020 | EfficientNetB4 | Not specified | 20 fps | 11000 frames | None |
| Struyvenberg et al[13] | 2021 | VGG16 | Not specified | 56 fps | 318 video cases | None |
| Hussein et al[14] | 2022 | ResNet101 + FCN ResNet50 | Not specified | 48-56 fps | 150000 frames | None |
| Zhao et al[15] | 2022 | U-Net | Not specified | Not specified | Not specified | None |
| Zhao et al[16] | 2022 | U-Net | GeForce RTX 3090 | 30 fps | Not specified | None |
| Abdelrahim et al[17] | 2022 | VGG16 + SegNet Hybrid Model | GeForce RTX 2080 Ti | 30 fps | Training: 109071 frames; Testing: 75 video cases | None |
| Zhao et al[18] | 2023 | U-Net Extended Model | GeForce RTX 3090 | 30 fps | Not specified | OLGA |
| Meinikheim et al[19] | 2024 | DeepLabV3+ + ResNet50 + Mean-Teacher | Not specified | 30 fps | Training: 51273 frames; Testing: 96 video cases | None |
| Tao et al[20] | 2024 | UNet++ + ResNet50 Dual Model System | Not specified | Not specified | Training: 119 video cases; Testing: 102 video cases | Kimura-Takemoto |
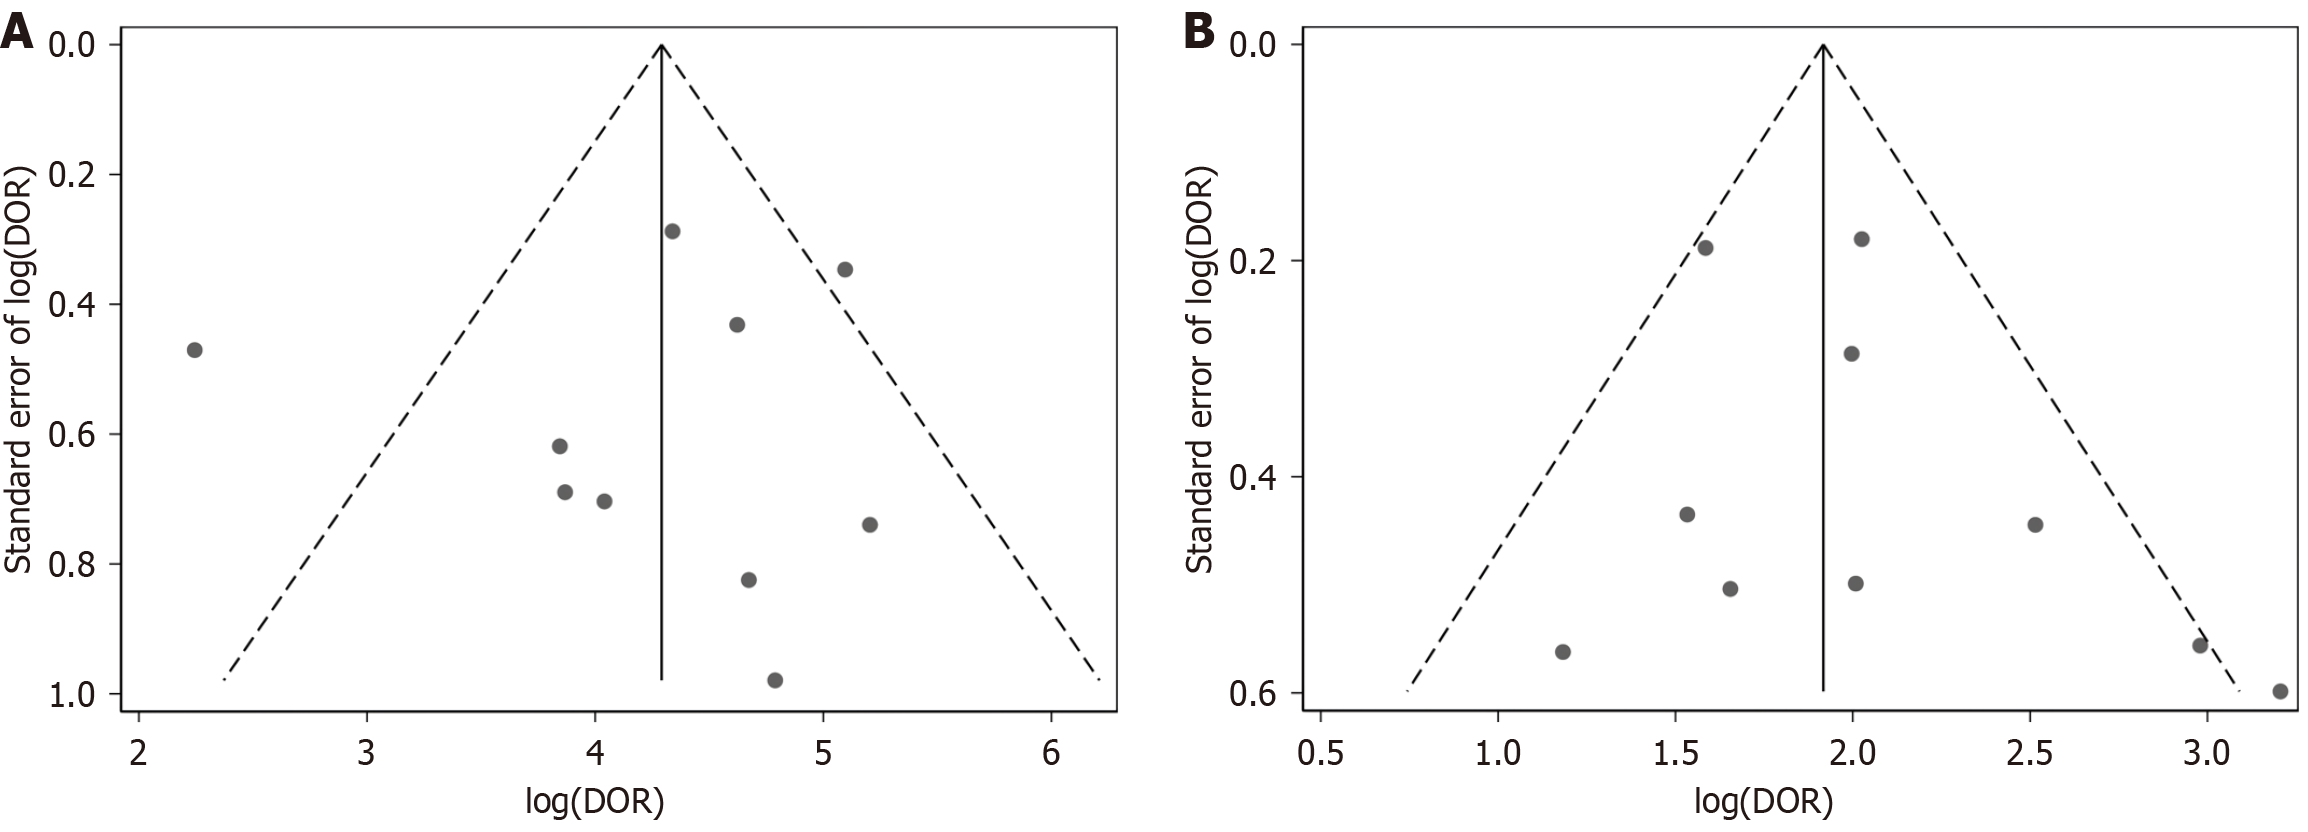
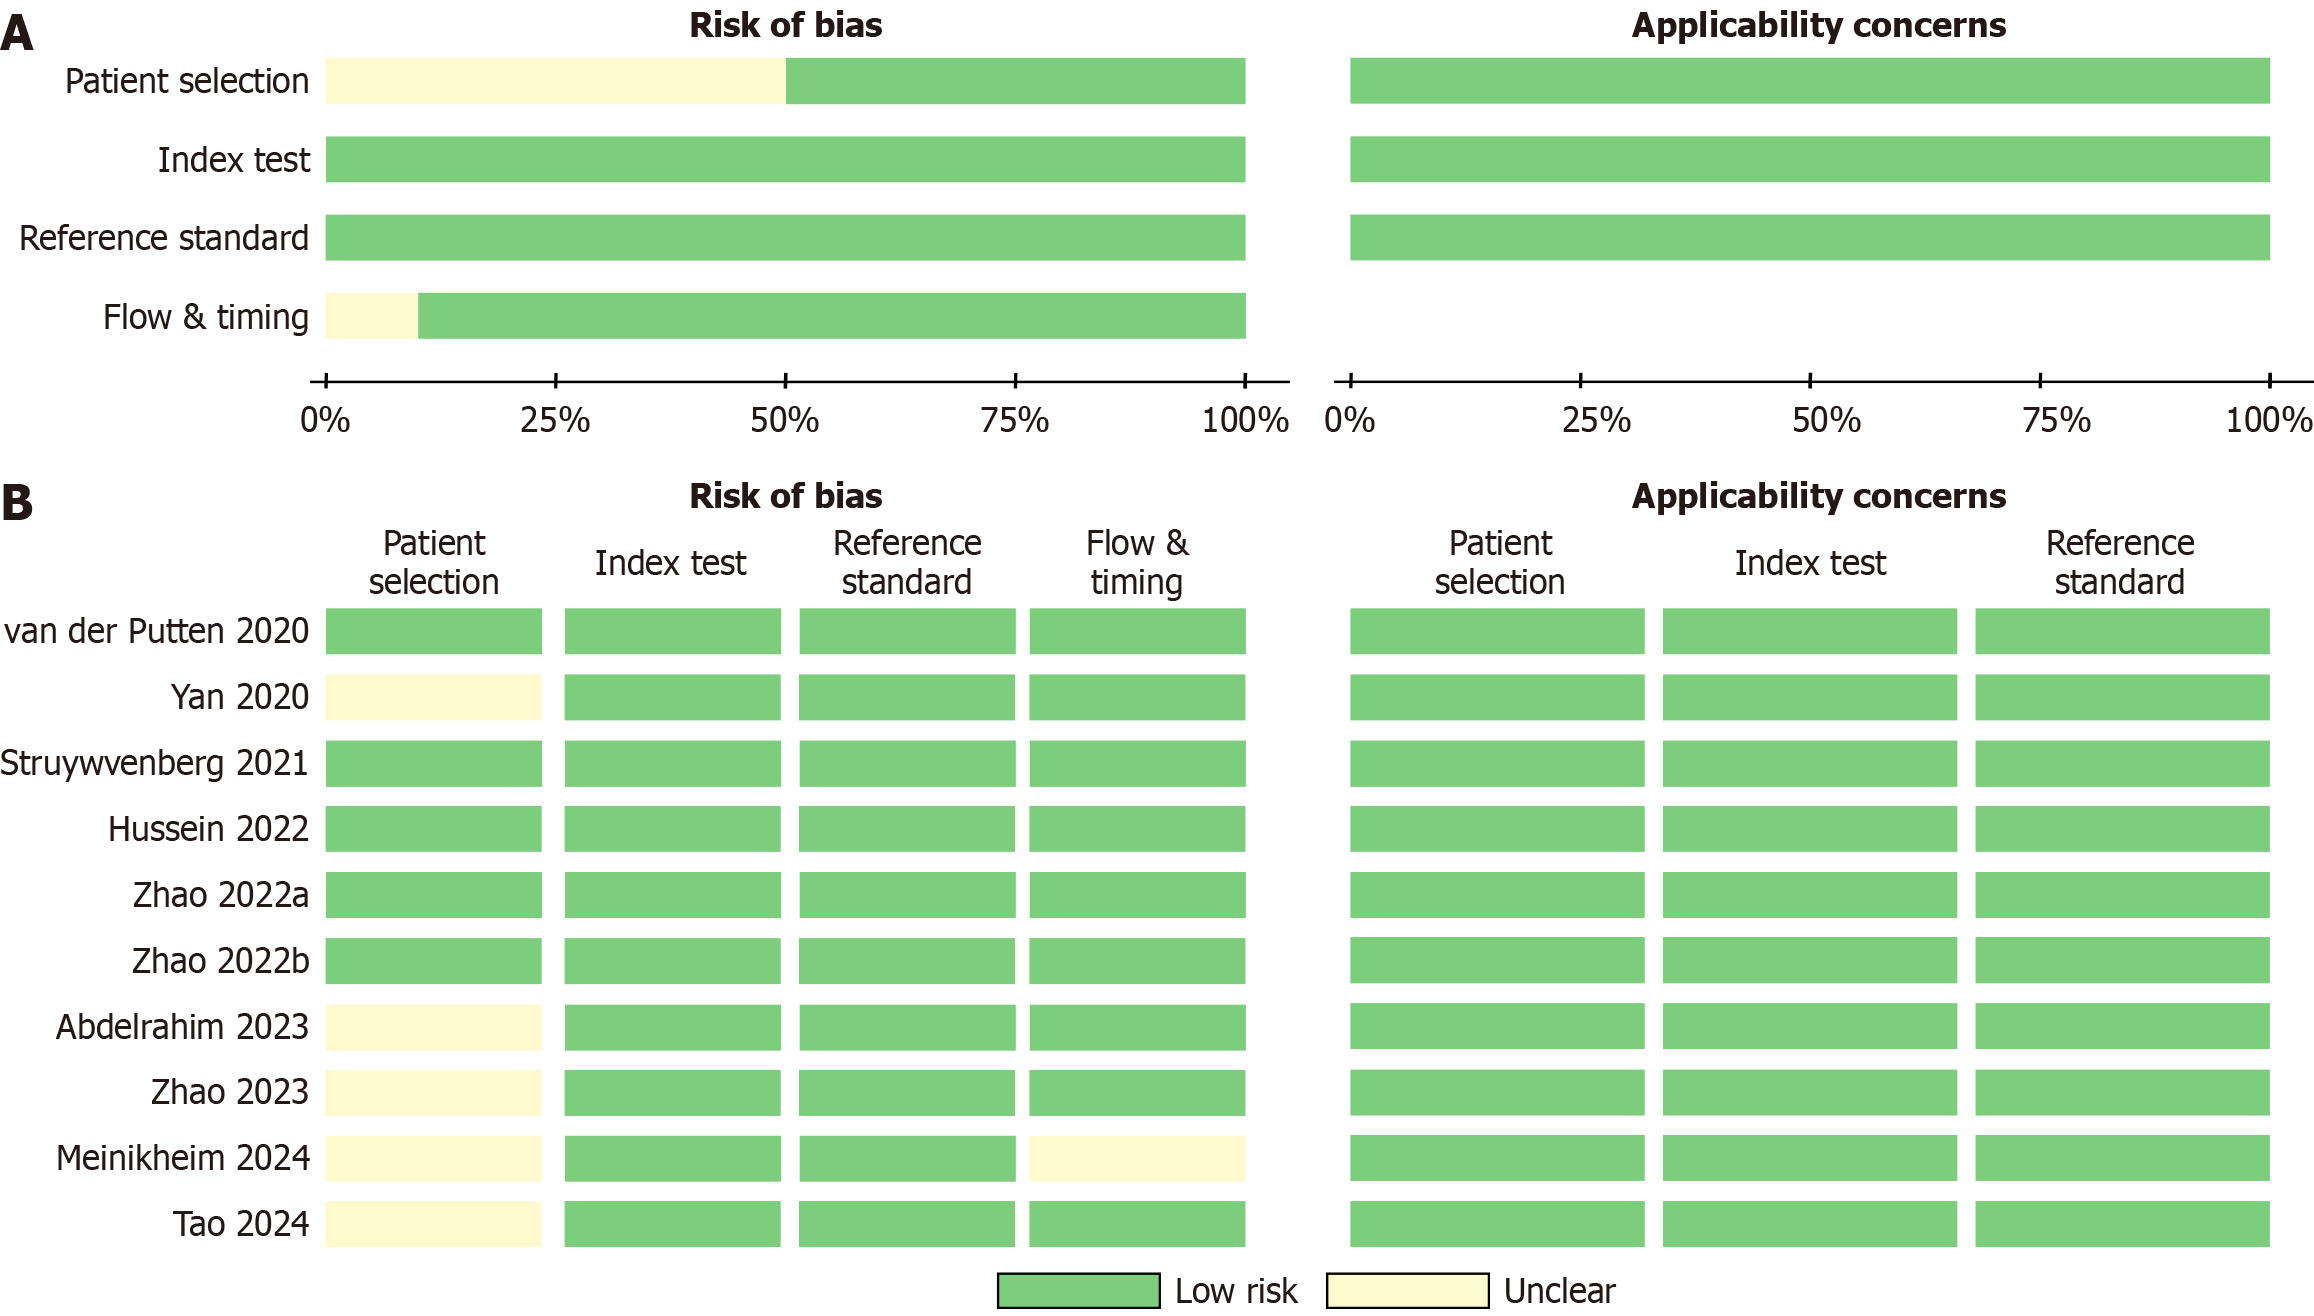
The Deek’s funnel plot for publication bias demonstrated a clear symmetry for the AI-CAD group (Figure 2A). Egger’s test further indicated no statistical evidence of publication bias in the AI-CAD group (P = 0.799). Similarly, the Deek’s funnel plot for the endoscopist group also showed a symmetrical distribution (Figure 2B), and Egger’s test revealed no statistical evidence supporting the presence of publication bias in the endoscopist group (P = 0.320). In summary, there was no significant publication bias detected in either the AI-CAD or endoscopist groups. The results of the QUADAS-2 assessment (Figure 3) indicated a generally low risk of bias, with the overall methodological quality of the included studies rated as moderate to high.
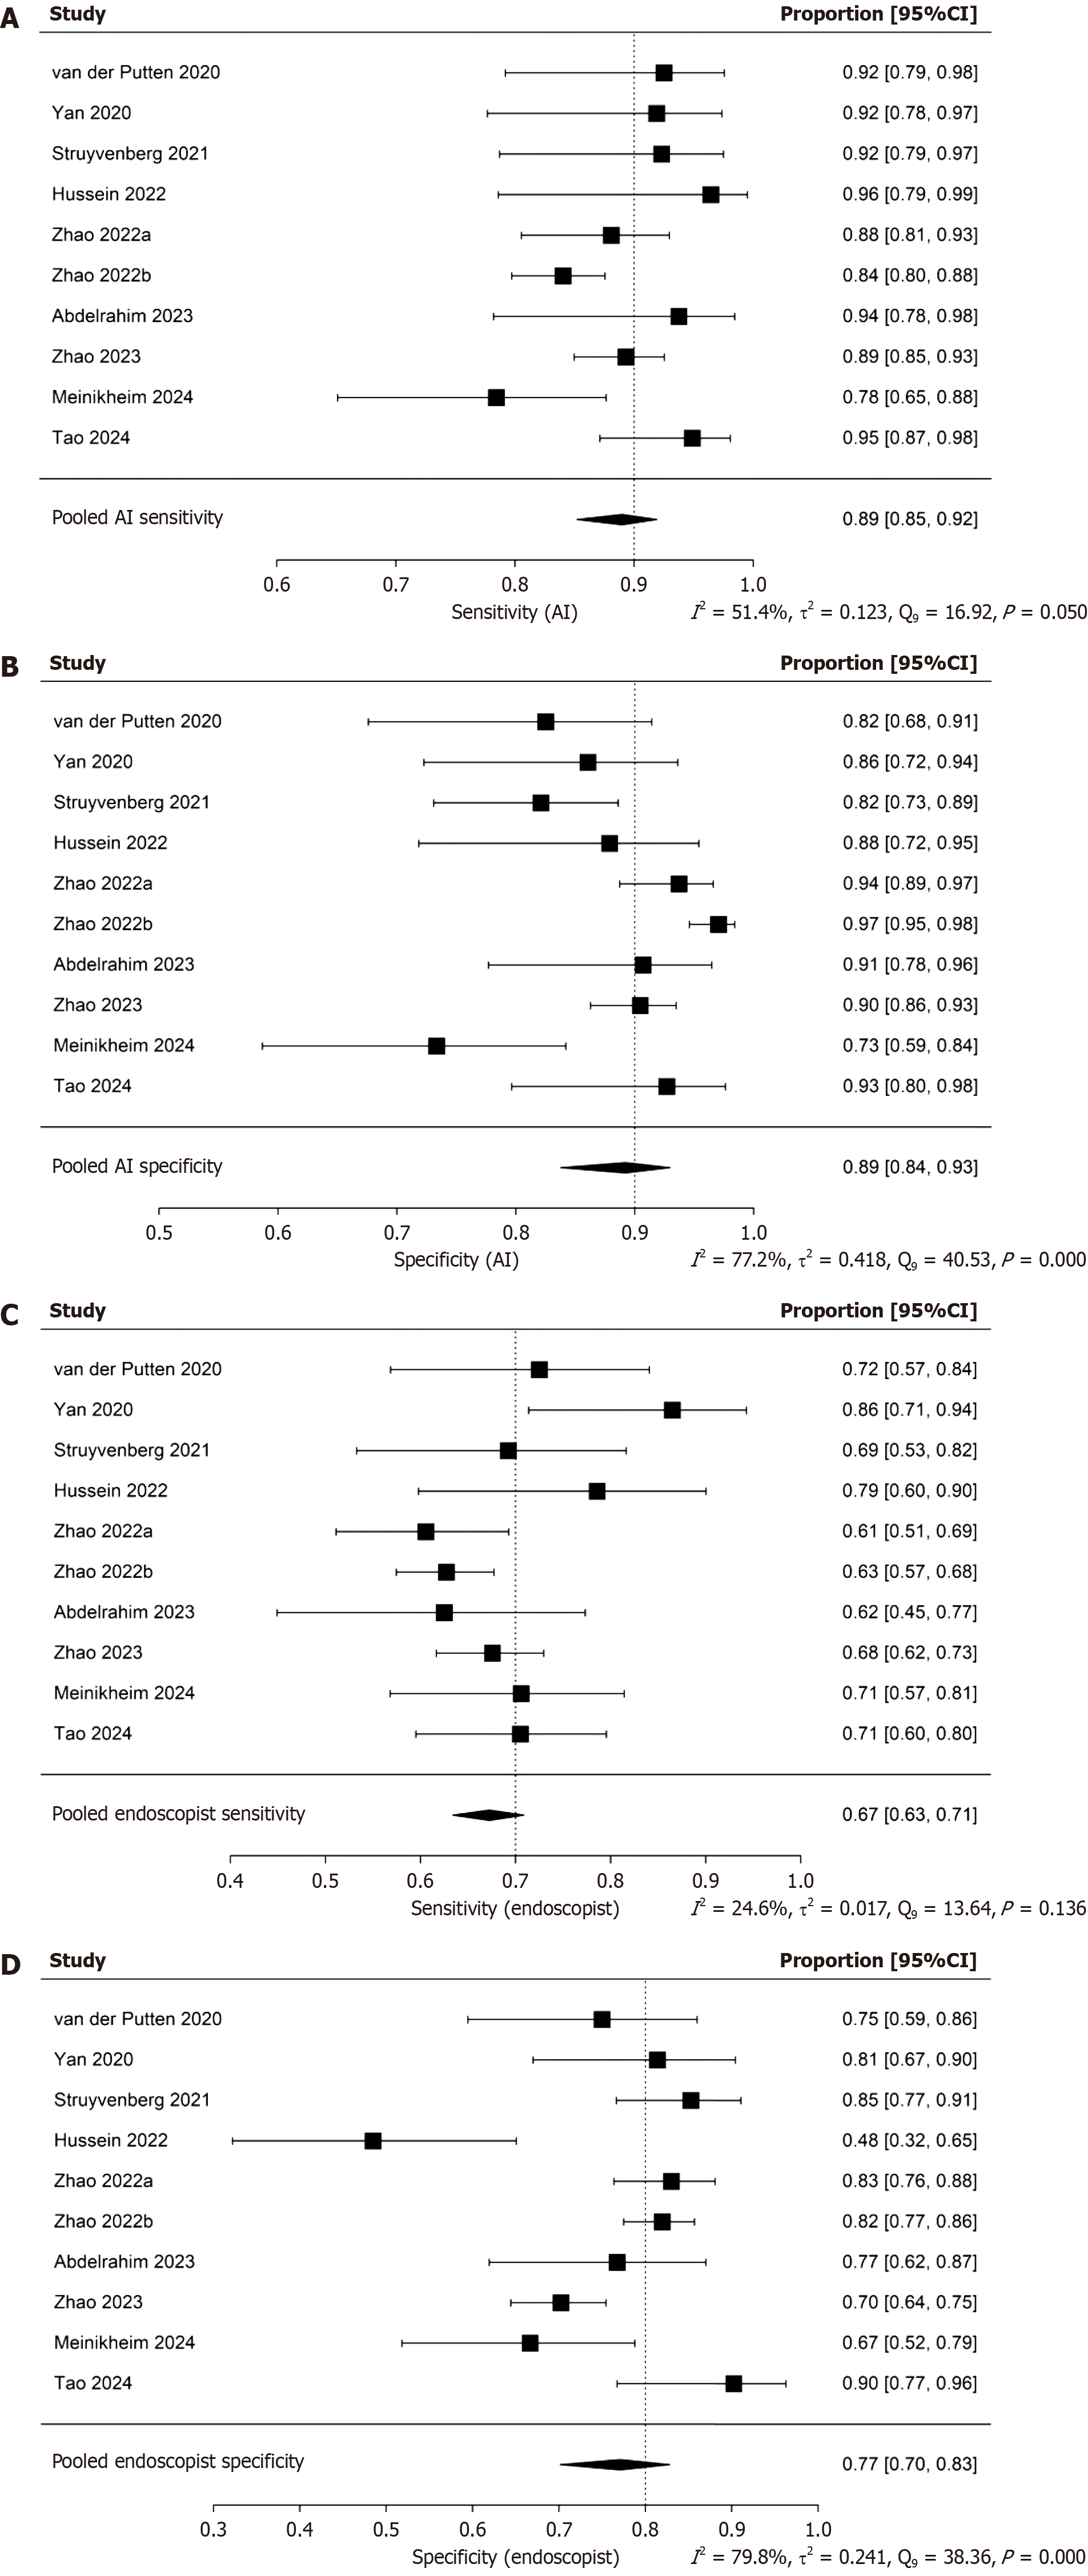
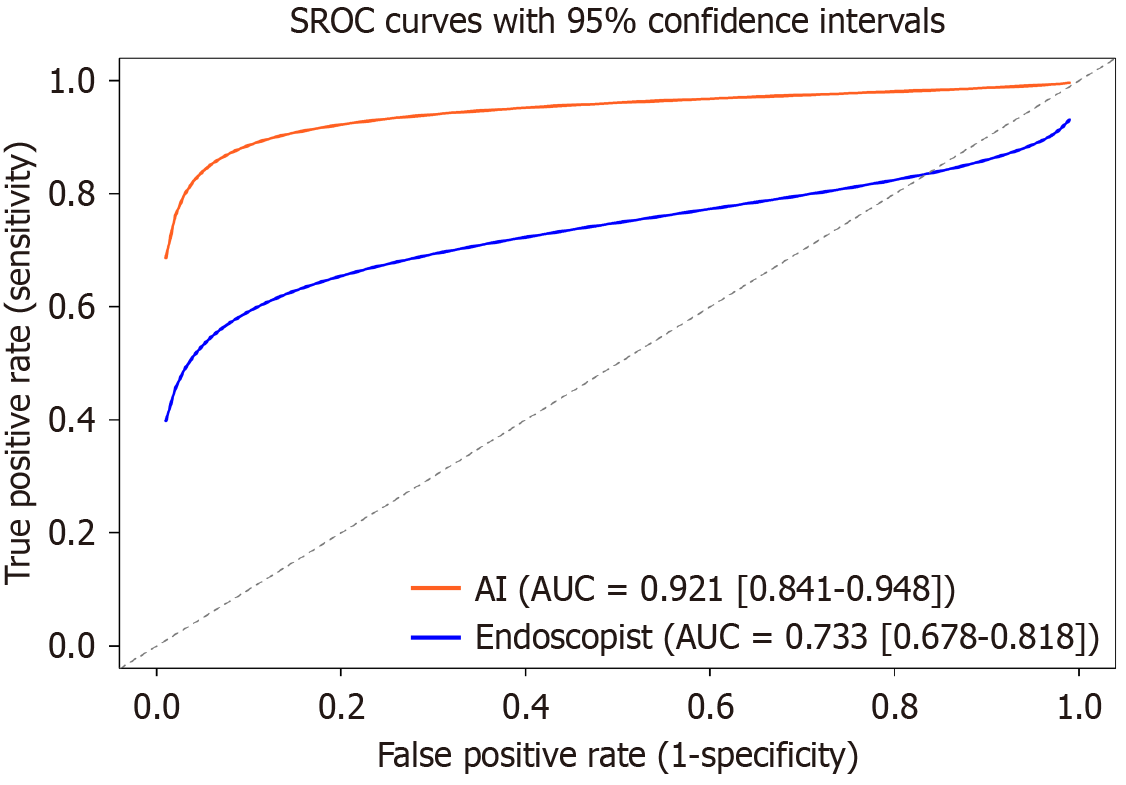
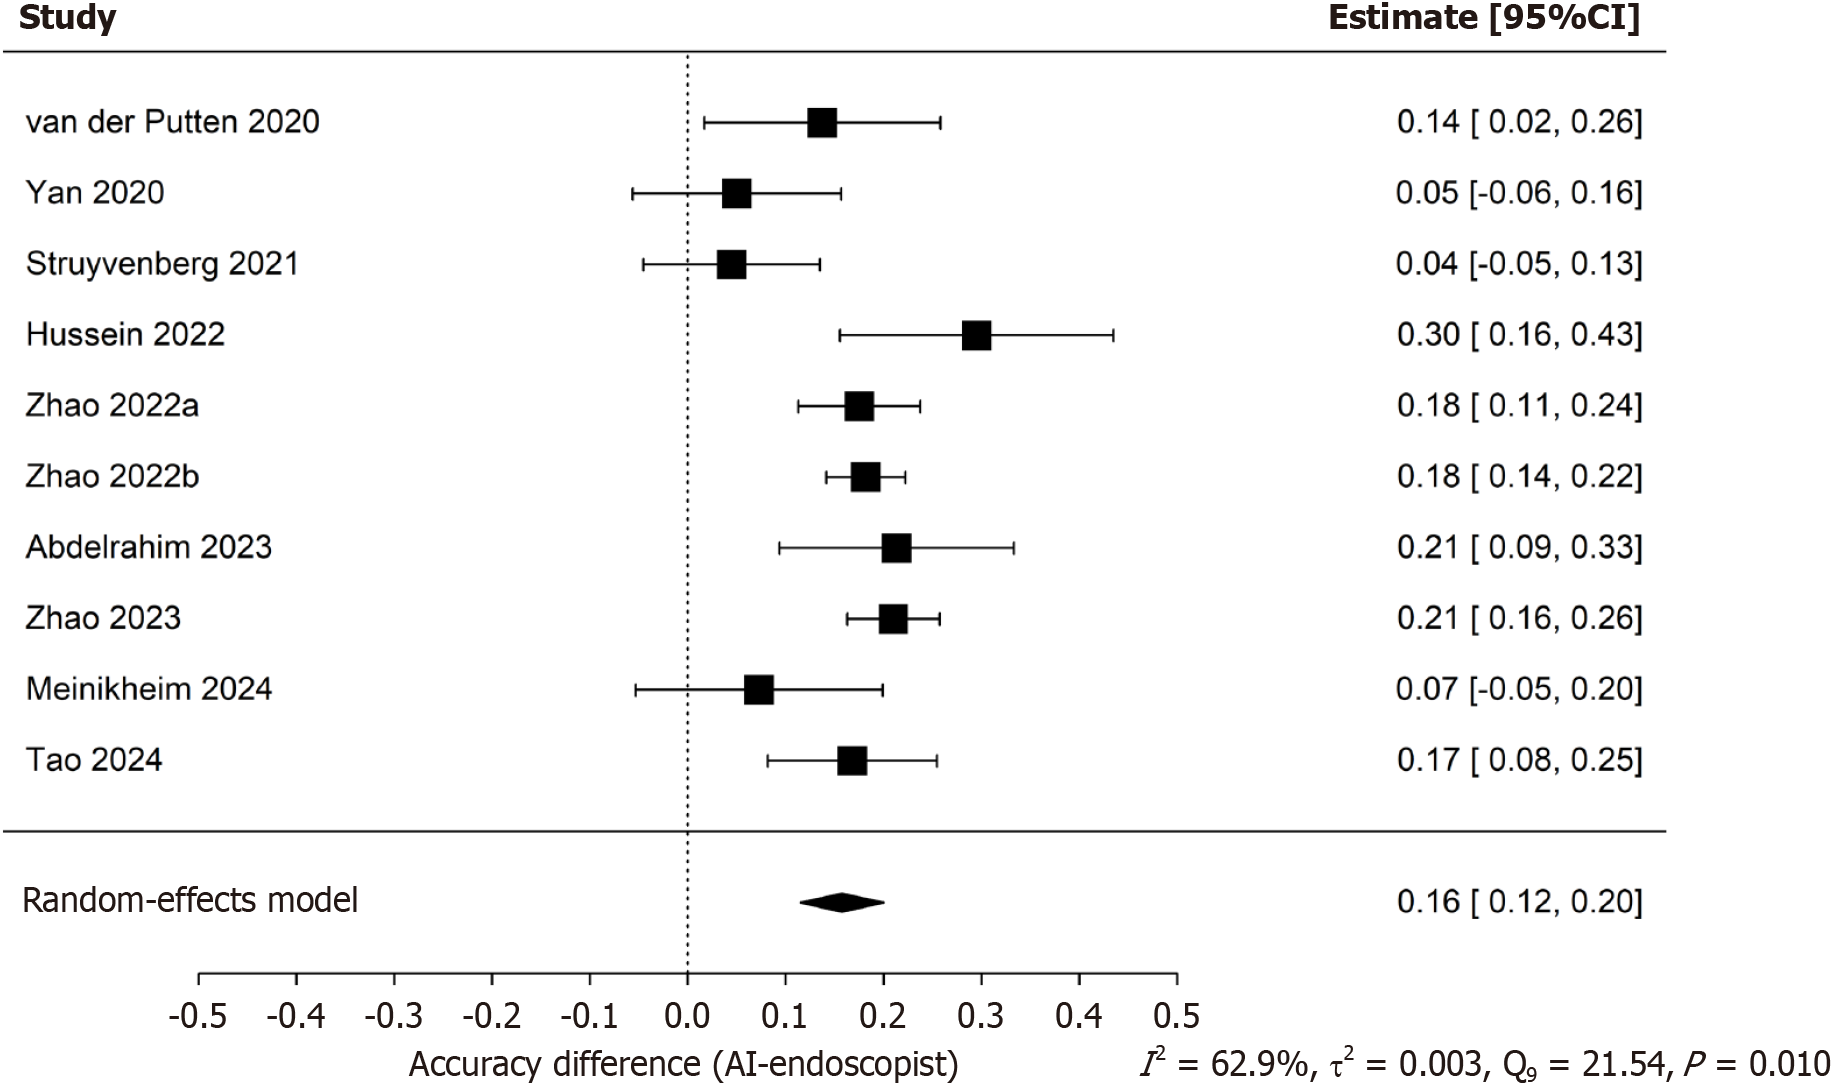
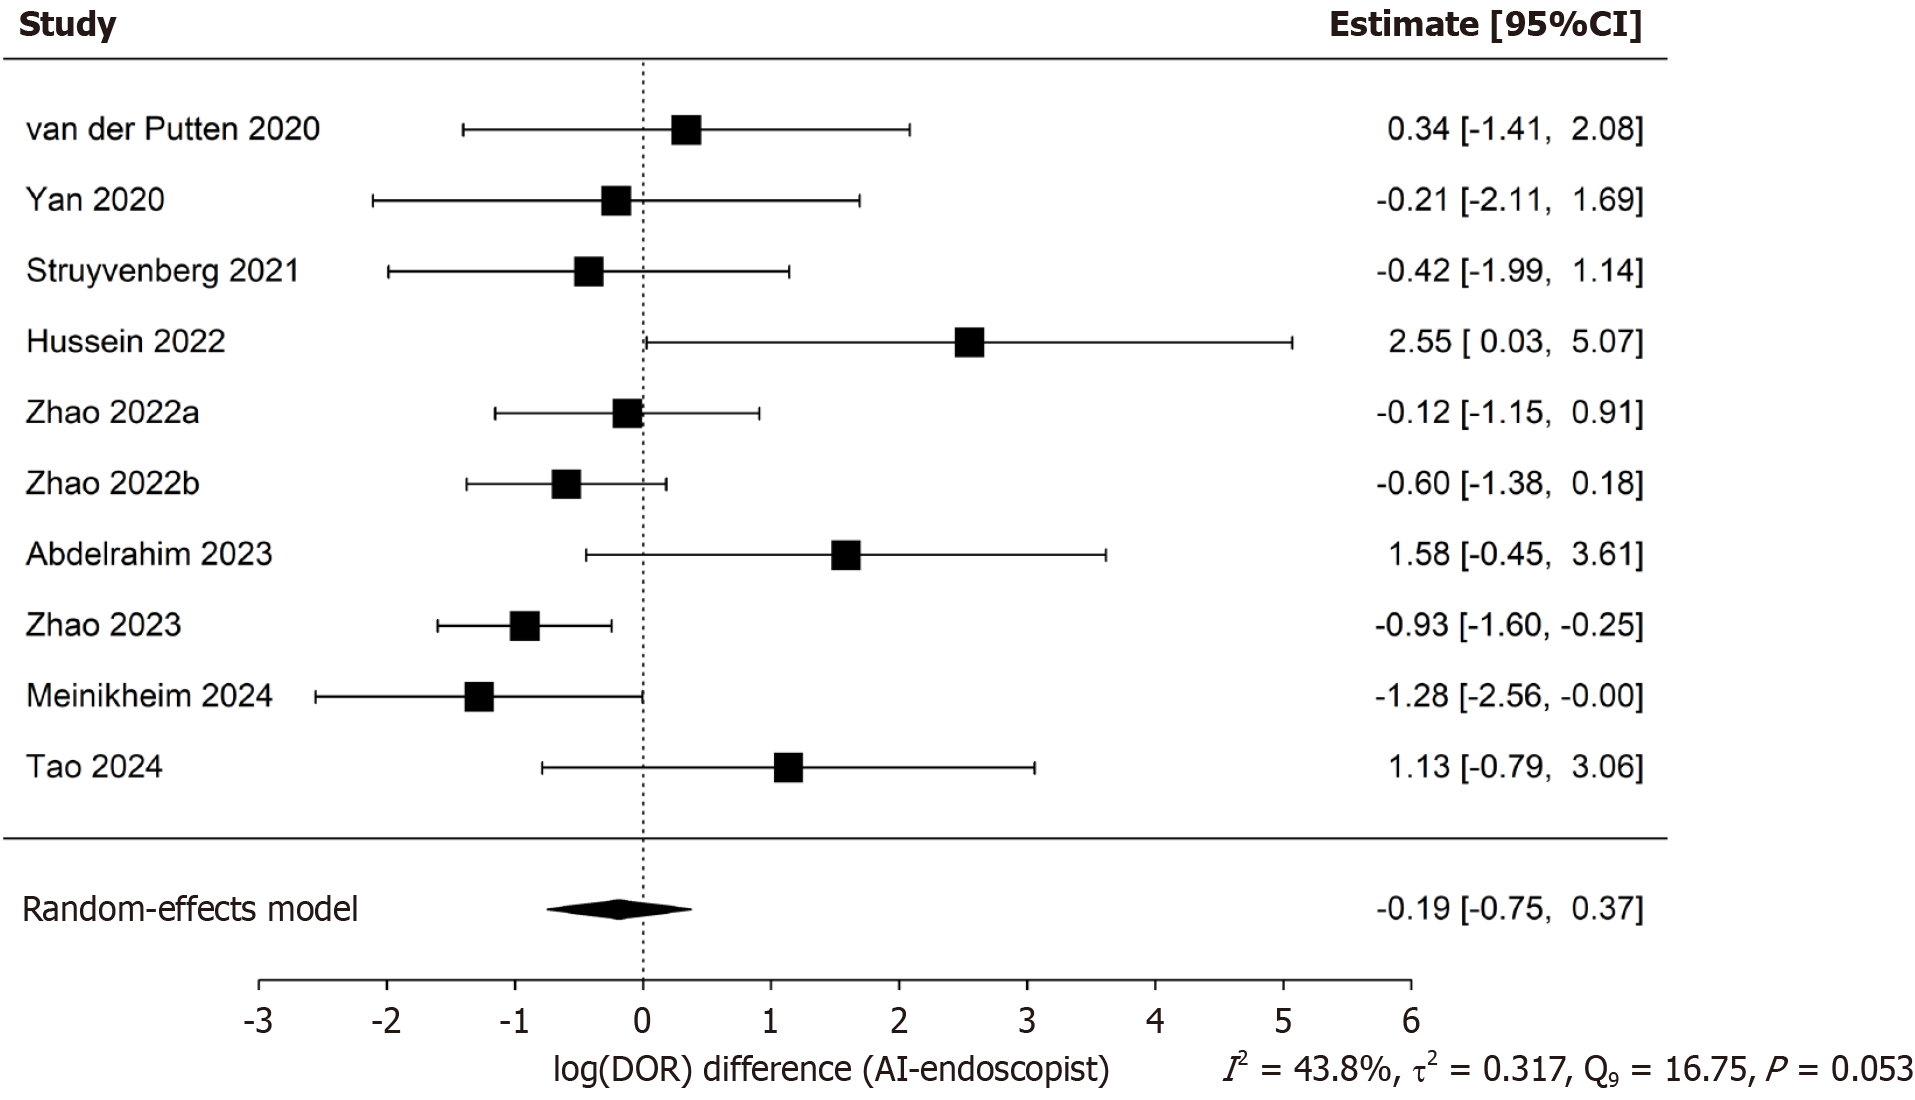
The pooled sensitivity and specificity of the AI-CAD group were 0.89 (95%CI: 0.85-0.92) and 0.89 (95%CI: 0.84-0.93), respectively (Figure 4A and B). In comparison, the pooled sensitivity and specificity of the endoscopist group were 0.67 (95%CI: 0.63-0.71) and 0.77 (95%CI: 0.70-0.83), respectively (Figure 4C and D). The pooled area under the curve (AUC) for the AI-CAD and endoscopist groups was 0.921 (95%CI: 0.841-0.948) and 0.733 (95%CI: 0.678-0.818), respectively (Figure 5). The pooled difference in overall accuracy between the AI-CAD group and the endoscopist group was 0.16 (95%CI: 0.12-0.20) (Figure 6). The pooled difference in log(DOR) between the two groups was -0.19 (95%CI: -0.75 to 0.37) (Figure 7).
In the threshold effect analysis, the Spearman correlation coefficient for the AI-CAD group was -0.006 with a P-value of 0.987, indicating an almost negligible correlation and a P-value far greater than 0.05. This suggests that no significant threshold effect was present in the AI-CAD group. For the endoscopist group, the Spearman correlation coefficient was 0.382 with a P-value of 0.279. Although the coefficient was positive, the P-value exceeded 0.05, and thus there was no statistically significant evidence of a threshold effect in this group either. While threshold variation may have had some impact on diagnostic performance measures, the effect did not reach statistical significance. Therefore, threshold effects are not considered a significant source of heterogeneity in either group.
However, as shown in Figures 6 and 7, the pooled diagnostic accuracy difference and log(DOR) difference between the AI-CAD and endoscopist groups exhibited I² values of 62.9% and 43.8%, respectively, with P-values close to or below 0.05. In addition, Figure 4 shows that the I² values for pooled sensitivity and specificity in both groups mostly exceeded 50%. These findings indicate that although the threshold effect does not contribute significantly to heterogeneity, non-threshold-related heterogeneity remains substantial. Therefore, a random-effects model was adopted. Furthermore, subgroup analyses were conducted to identify potential sources of heterogeneity.
The results of subgroup analyses based on six variables (Table 3) suggest that current variables were insufficient to explain the heterogeneity observed in sensitivity of AI-CAD group. Objective characteristics that have not been quanti
| Subgroup | No. studies | No. patients | Sensitivity (AI-CAD) | Specificity (AI-CAD) | Sensitivity (endoscopist) | Specificity (endoscopist) | Difference of accuracy | Difference of log (DOR) | ||||||||||||
| Value | I2 (%) | P value | Value | I2 (%) | P value | Value | I2 (%) | P value | Value | I2 (%) | P value | Value | I2 (%) | P value | Value | I2 (%) | P value | |||
| Race | ||||||||||||||||||||
| Asian | 5 | 1667 | 0.890 (95%CI: 0.837-0.928) | 53.0 | 0.070 | 0.930 (95%CI: 0.891-0.956) | 70.8 | 0.009 | 0.658 (95%CI: 0.618-0.696) | 43.9 | 0.039 | 0.810 (95%CI: 0.723-0.874) | 75.3 | 0.001 | 0.167 (95%CI: 0.112-0.221) | 22.9 | 0.118 | -0.355 (95%CI: | 9.3 | 0.296 |
| Others | 5 | 446 | 0.896 (95%CI: 0.821-0.942) | 49.9 | 0.083 | 0.831 (95%CI: 0.746-0.891) | 16.3 | 0.276 | 0.703 (95%CI: 0.632-0.766) | 0.0 | 0.746 | 0.721 (95%CI: 0.608-0.812) | 76.1 | 0.002 | 0.142 (95%CI: 0.072-0.211) | 64.8 | 0.022 | 0.151 (95%CI: | 62.6 | 0.032 |
| Number of patients | ||||||||||||||||||||
| < 100 | 5 | 392 | 0.895 (95%CI: 0.819-0.941) | 49.2 | 0.089 | 0.842 (95%CI: 0.741-0.909) | 31.4 | 0.242 | 0.731 (95%CI: 0.660-0.791) | 17.6 | 0.235 | 0.703 (95%CI: 0.594-0.793) | 64.0 | 0.027 | 0.147 (95%CI: 0.074-0.220) | 60.2 | 0.041 | 0.213 (95%CI: | 60.3 | 0.035 |
| ≥ 100 | 5 | 1721 | 0.891 (95%CI: 0.838-0.928) | 54.0 | 0.066 | 0.922 (95%CI: 0.870-0.954) | 83.1 | 0.000 | 0.650 (95%CI: 0.614-0.684) | 6.7 | 0.432 | 0.816 (95%CI: 0.742-0.872) | 78.8 | 0.000 | 0.163 (95%CI: 0.106-0.219) | 66.1 | 0.037 | -0.387 (95%CI: | 3.4 | 0.306 |
| Study design | ||||||||||||||||||||
| Paired | 2 | 1200 | 0.868 (95%CI: 0.783-0.923) | 71.1 | 0.063 | 0.944 (95%CI: 0.879-0.975) | 90.4 | 0.001 | 0.650 (95%CI: 0.586-0.710) | 33.8 | 0.219 | 0.766 (95%CI: 0.600-0.877) | 91.1 | 0.001 | 0.196 (95%CI: 0.125-0.266) | 0.0 | 0.378 | -0.774 (95%CI: | 0.0 | 0.536 |
| Others | 8 | 913 | 0.904 (95%CI: 0.856-0.937) | 44.0 | 0.116 | 0.868 (95%CI: 0.803-0.913) | 57.7 | 0.018 | 0.694 (95%CI: 0.640-0.743) | 30.1 | 0.159 | 0.773 (95%CI: 0.684-0.842) | 75.2 | 0.000 | 0.141 (95%CI: 0.092-0.189) | 56.8 | 0.026 | 0.075 (95%CI: | 40.5 | 0.101 |
| Type of lesion | ||||||||||||||||||||
| BE | 5 | 446 | 0.896 (95%CI: 0.821-0.942) | 49.9 | 0.083 | 0.831 (95%CI: 0.746-0.891) | 16.3 | 0.276 | 0.703 (95%CI: 0.632-0.766) | 0.0 | 0.746 | 0.721 (95%CI: 0.608-0.812) | 76.1 | 0.002 | 0.142 (95%CI: 0.072-0.211) | 64.8 | 0.022 | 0.151 (95%CI: | 62.6 | 0.032 |
| Others | 5 | 1667 | 0.890 (95%CI: 0.837-0.928) | 53.0 | 0.070 | 0.930 (95%CI: 0.891-0.956) | 70.8 | 0.009 | 0.658 (95%CI: 0.618-0.696) | 43.9 | 0.039 | 0.810 (95%CI: 0.723-0.874) | 75.3 | 0.001 | 0.167 (95%CI: 0.112-0.221) | 22.9 | 0.118 | -0.355 (95%CI: | 9.3 | 0.296 |
| Imaging modality | ||||||||||||||||||||
| WLE | 4 | 931 | 0.906 (95%CI: 0.835-0.949) | 63.0 | 0.025 | 0.935 (95%CI: 0.877-0.967) | 59.7 | 0.044 | 0.662 (95%CI: 0.596-0.722) | 26.1 | 0.255 | 0.764 (95%CI: 0.634-0.858) | 88.1 | 0.000 | 0.202 (95%CI: 0.134-0.269) | 0.1 | 0.438 | 0.560 (95%CI: | 65.3 | 0.020 |
| Others | 6 | 1182 | 0.886 (95%CI: 0.827-0.926) | 26.8 | 0.253 | 0.861 (95%CI: 0.790-0.911) | 73.1 | 0.002 | 0.685 (95%CI: 0.630-0.735) | 31.3 | 0.127 | 0.775 (95%CI: 0.679-0.849) | 66.3 | 0.007 | 0.128 (95%CI: 0.074-0.183) | 69.1 | 0.005 | -0.530 (95%CI: | 0.9 | 0.536 |
| AI model for segmentation | ||||||||||||||||||||
| U-Net | 4 | 1587 | 0.887 (95%CI: 0.828-0.927) | 59.7 | 0.048 | 0.939 (95%CI: 0.904-0.961) | 69.1 | 0.015 | 0.648 (95%CI: 0.611-0.682) | 11.0 | 0.323 | 0.810 (95%CI: 0.710-0.881) | 83.2 | 0.000 | 0.187 (95%CI: 0.155-0.220) | 0.0 | 0.735 | -0.376 (95%CI: | 17.4 | 0.187 |
| Others | 6 | 526 | 0.900 (95%CI: 0.835-0.941) | 43.6 | 0.119 | 0.834 (95%CI: 0.765-0.886) | 7.3 | 0.358 | 0.724 (95%CI: 0.660-0.779) | 0.0 | 0.327 | 0.737 (95%CI: 0.632-0.820) | 72.4 | 0.002 | 0.118 (95%CI: 0.069-0.167) | 63.1 | 0.021 | 0.093 (95%CI: | 52.1 | 0.060 |
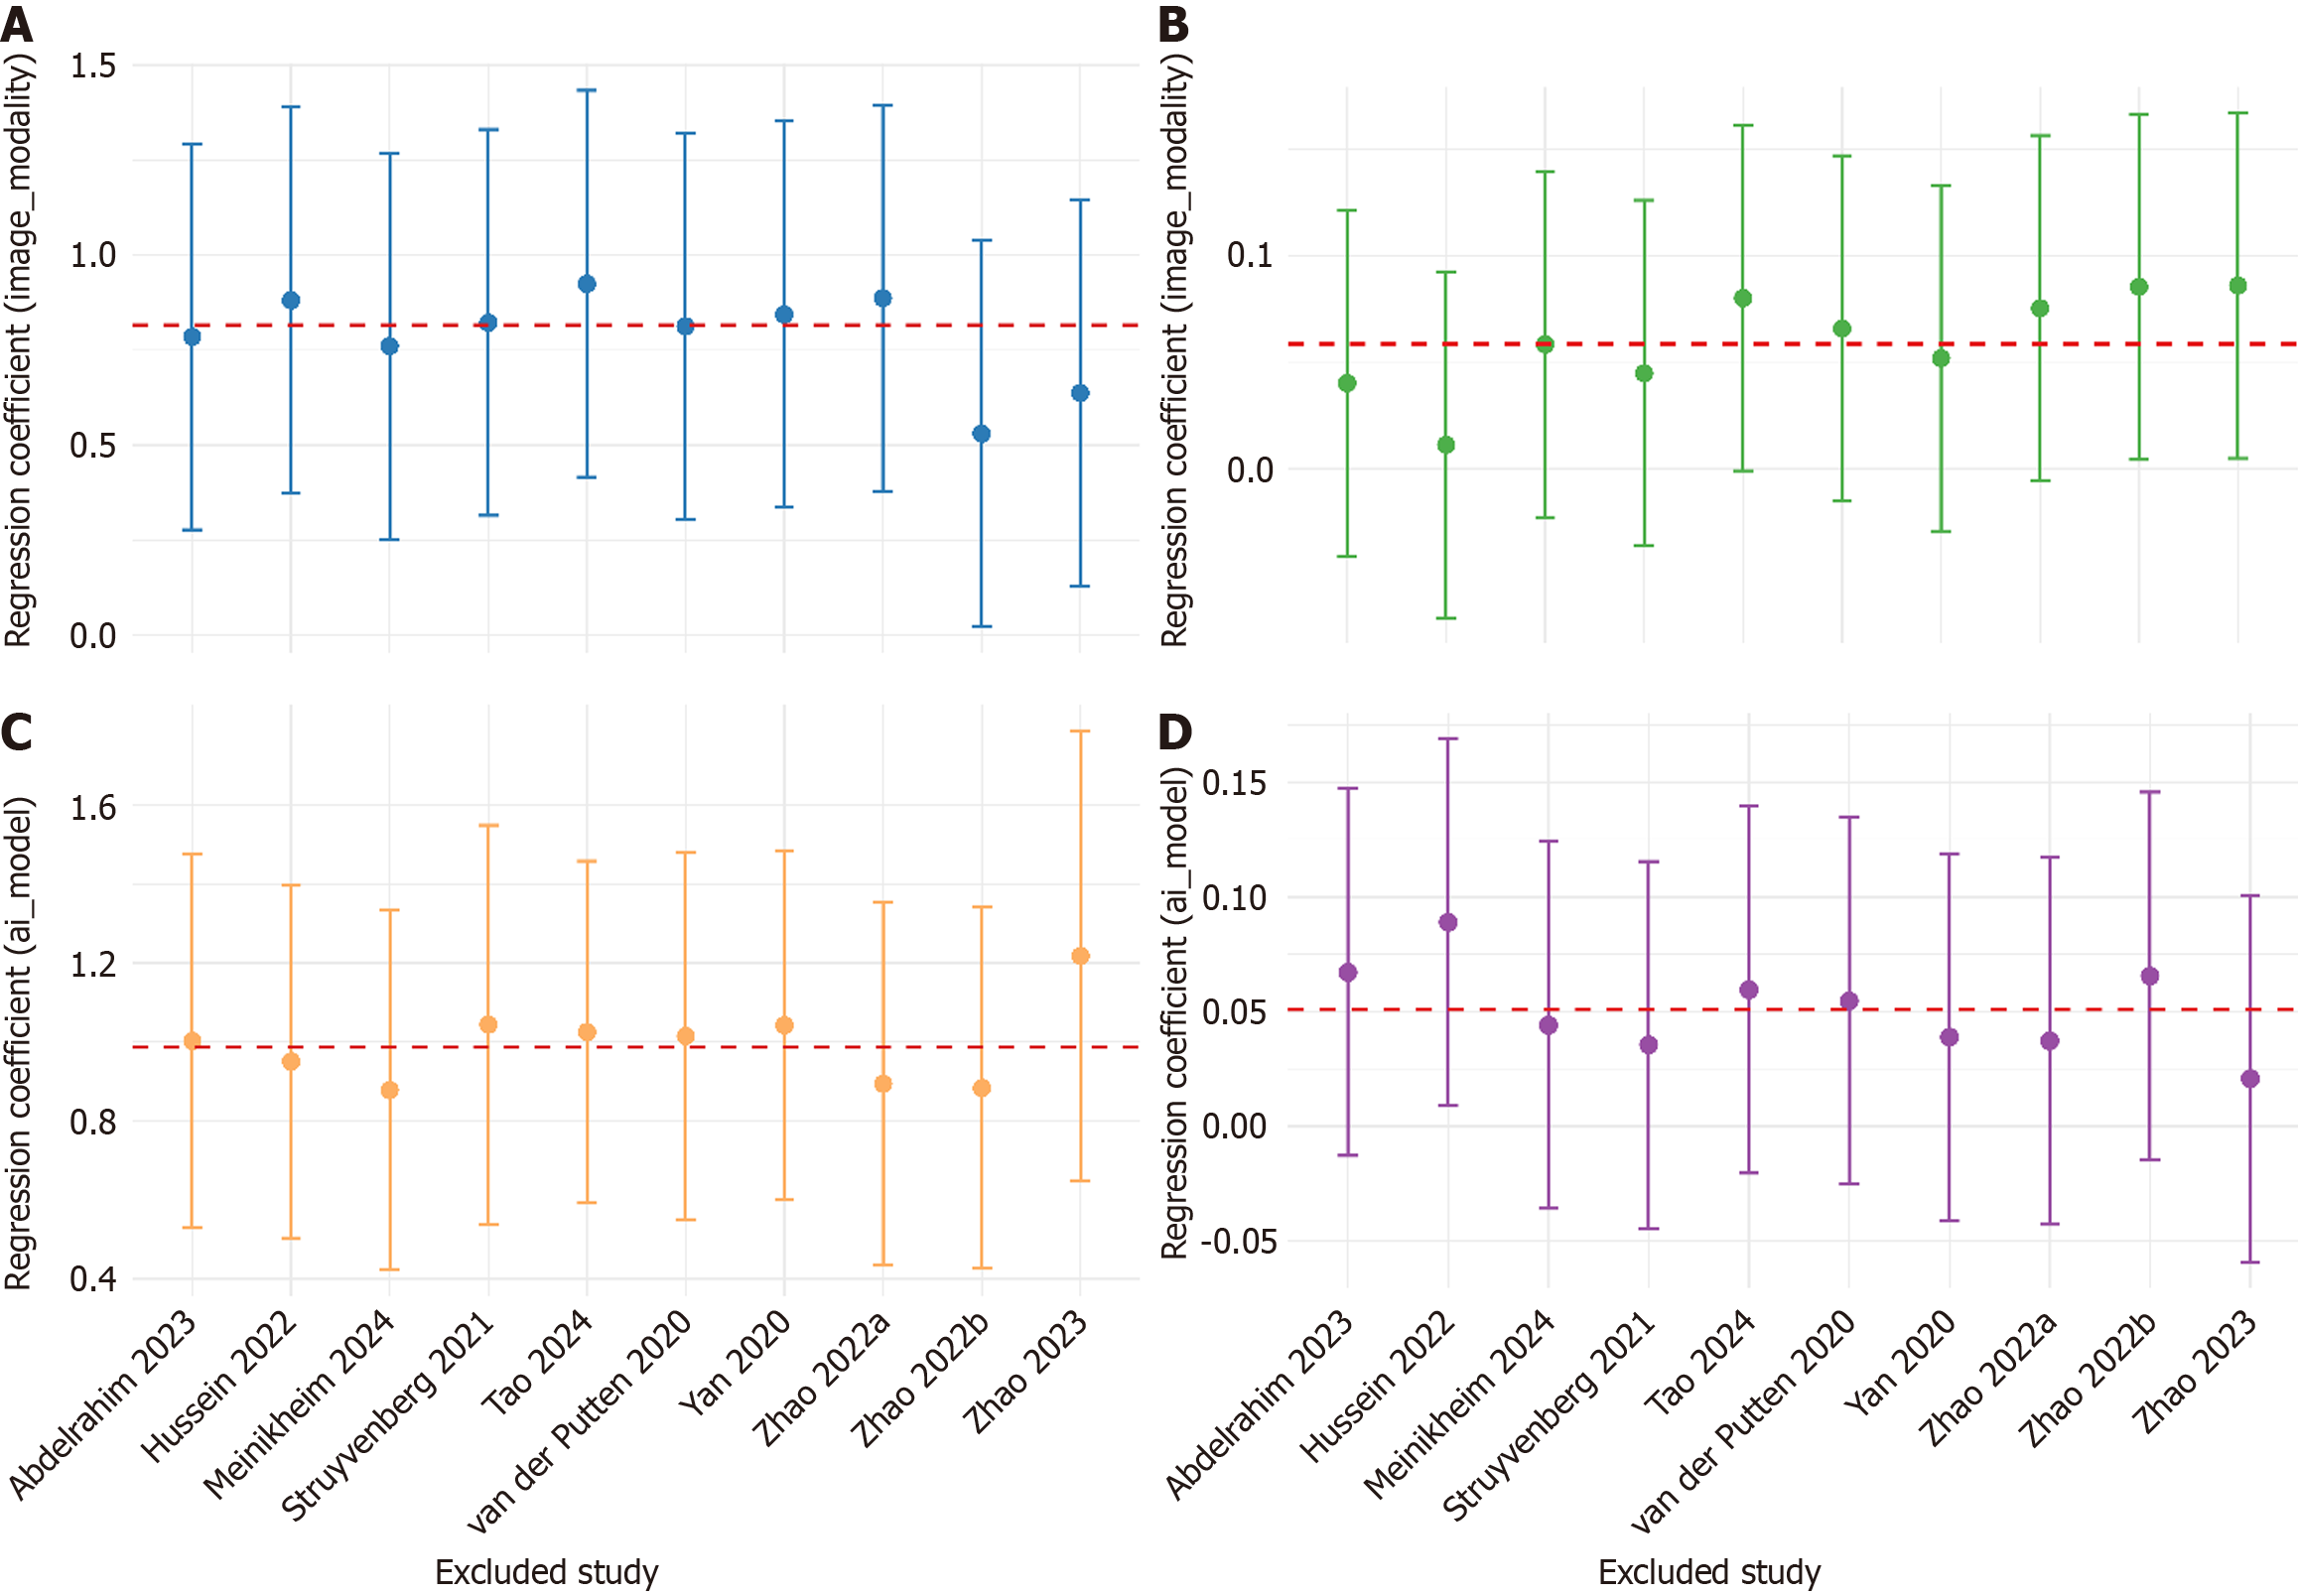
Meta-regression of AICAD group specificity (Table 4) showed that both WLE modality and UNet model independently enhanced AICAD group specificity (P < 0.01). After adjustment, the residual betweenstudy variance was nil (τ² = 0; I² = 0%), and entire heterogeneity is explained (R² = 100%), indicating that these two factors almost completely accounted for the variability in specificity. For accuracy difference, metaregression (Table 4) revealed a baseline advantage of 10.7 percentage points for AICAD group under nonWLE, nonUNet conditions. After incorporating WLE and UNet as covariates, residual heterogeneity remained substantial (I² = 51%), the explained variance was modest (R² = 25%), and β was not statistically significant (P > 0.05). The robustness of the above findings was verified by leave-one-out (LOO) sensitivity analysis (Figure 8). In the specificity model, the regression coefficients (β) remained statistically significant throughout, with CI overlapping those of the full model, indicating a stable and reliable result. In contrast, the accuracy difference model showed greater variability in β estimates, with CI crossing 0 in some iterations, suggesting limited explanatory power and model stability.
| Outcome | Covariate | β | 95%CI | P value | τ2 | I2 (%) | R2 (%) |
| Specificity | Intercept | 1.418 | 1.099-1.737 | 0 | 0 | 0 | 10000 |
| WLE (vs others) | 0.816 | 0.307-1.324 | 0.002 | ||||
| UNet (vs others) | 0.986 | 0.558-1.415 | 0 | ||||
| Accuracy difference | Intercept | 0.107 | 0.043-0.17 | 0.001 | 0.002 | 51.4 | 2498.5 |
| WLE (vs others) | 0.059 | -0.022-0.14 | 0.157 | ||||
| UNet (vs others) | 0.051 | -0.029-0.131 | 0.212 |
AI systems have advanced rapidly in recent years and are now widely applied across various domains of clinical medicine, including EGD for the detection of precancerous lesions. Multiple AI-CAD models targeting UGI precancerous conditions have been developed and introduced into clinical practice. In 2020, de Groof et al[21] first evaluated an AI system for diagnosing BE, reporting a sensitivity of 91%, specificity of 89%, and accuracy of 90. The same year, AI-CAD systems for CAG and GIM also emerged, with diagnostic performance metrics consistently around 90%. Notably, Zhang et al[22] reported a sensitivity of 94.5%, specificity of 94.0%, and accuracy of 94.2% for their CAG detection system. These findings collectively suggest that current AI-CAD systems for UGI precancerous lesion detection are approaching clinically acceptable diagnostic performance. However, as highlighted in a recent review by Spadaccini et al[23], despite their promising potential, AI-CAD systems are still subject to misclassification risks, including both false positives and false negatives. Their clinical effectiveness and practical feasibility require further validation. Given the growing body of evidence and the absence of a previously published meta-analysis on this topic, the present study aims to comprehensively evaluate the diagnostic performance of AI-CAD systems in UGI precancerous lesion detection, based on all available literature published up to April 30, 2025.
The pooled sensitivity, specificity, and AUC of AI-CAD systems for the diagnosis of UGI precancerous lesions were 0.89 (95%CI: 0.85-0.92), 0.89 (95%CI: 0.84-0.93), and 0.921 (95%CI: 0.841-0.948), respectively. In contrast, endoscopists achieved corresponding values of 0.67 (95%CI: 0.63-0.71), 0.77 (95%CI: 0.70-0.83), and 0.733 (95%CI: 0.678-0.818). The pooled diagnostic accuracy difference was 0.16 (95%CI: 0.12-0.20), and pooled difference in log(DOR) was -0.19 (95%CI:
Most summary effects exhibited notable heterogeneity except of endoscopist’s sensitivity, I2 exceeded 50% for every outcome, and reached 70%-80% for specificity and the accuracy difference, indicating moderate-to-high between-study variability. By contrast, the direction of the pooled sensitivity advantage was consistent and its heterogeneity more limited, whereas log(DOR) differences fluctuated markedly across studies. Subgroup analyses identified technical variables (imaging modality and AI model for segmentation), as the principal drivers of heterogeneity. Variation in imaging modality primarily altered the false-positive rate, and U-Net-based segmentation exerted the strongest influence on false-positive control; together they accounted for almost all variability in specificity and a sizeable proportion of the variability in accuracy. The subsequent meta-regression also confirmed that the imaging modality and AI model for segmentation almost completely explained the specific heterogeneity, and also partially explained the heterogeneity of the accuracy rates. Routine WLE combined with a U-Net-based AI-CAD system is therefore recommended for first-line deployment, as it delivers the most stable gain in specificity. This may be attributed to the broader accessibility of WLE data and the abundance of training samples, as well as its preservation of full-spectrum visible light information. Although WLE lacks the enhanced visualization of mucosal microvasculature and surface texture provided by modalities such as NBI or BLI, it retains critical structural details that may be essential for accurate lesion identification. These characteristics have brought significant advantages for the training and deployment of AI-CAD systems. U-Net model has better adaptability to limited data, high noise levels, and high inter-case variability compared to other segmentation architectures. In the context of multiple diseases and multiple centers, it can generate stable outputs and is more suitable for early lesion detection tasks with prominent morphologic heterogeneity. While AI-CAD systems showed higher sensitivity, this may be accompanied by increased false-positive rates in some models, potentially leading to unnecessary biopsies or interventions. Future development should focus on optimizing specificity and integrating a two-step human-AI review process to minimize overtreatment risk. The human-machine collaboration strategy of having the high-specificity AI-CAD system conduct the initial screening and then having the endoscopist conduct the key review can avoid excessive treatment, reduce unnecessary biopsies and surgeries, and is of great significance for the diagnosis and treatment of precancerous lesions. In the future, when the hardware conditions permit, multi-stage and ensemble models can also be introduced to re-examine the initially positive results, thereby further enhancing the specificity. LOO also confirmed that there was no key driving studies included in the research, indicating that meta-regression results were highly robust.
In addition, we also found that the specificity and accuracy of the BE scenario were lower than those of other lesions. Moreover, when the β value of the BE study was removed in LOO, there was a significant increase. This might be due to the complex structure of the BE lesion. Further improvements in diagnostic efficacy may be required through multi-modal imaging modalities, ensemble AI models, and re-training methods. In the paired study scenario, heterogeneity is generally high and the sensitivity is lower than in the non-paired scenario. This might be due to the smaller number of paired studies, and because specific patient-level paired data is lacking, it is impossible to construct the covariates required for McNemar or bivariate models. Therefore, it can only assume that the two groups independently use the random effects model for the main analysis, which leads to an impact on the final results. Only two studies adopted a paired design, limiting the feasibility of using more precise paired statistical models. This constraint may have impacted the robustness of direct AI-endoscopist comparisons. This constitutes a limitation of the present meta-analysis and highlights the need for large, multicenter, prospectively paired datasets. In addition to the above limitations, several other factors should be noted. Although this meta-analysis comprehensively included all available prospective studies up to April 2025, only 10 studies met the inclusion criteria. This limited number may reduce the generalizability of our conclusions, especially when extrapolating to unrepresented populations or healthcare settings. Some included studies had relatively small sample sizes, with the smallest cohort containing only 61 participants. Such small sample sizes may introduce statistical instability and increase the potential for random error in pooled effect estimates. And there were still several adopted retrospective designs, which may introduce selection bias and reduce the internal validity of the pooled results. Moreover, most of the included literature was discussed within the context of Asia or Europe. The lack of data from other regions may lead to bias. The absence of discussions on the deployment in low-resource environments and the different disease phenotypes in different regions may also affect the external generalizability of the AI-CAD system. Our meta-analysis did not address the cost-effectiveness, operational complexity, or impact on clinical workflows of AI-CAD systems. These factors are particularly important for their adoption in resource-limited settings and should be evaluated in future studies.
Future directions include: (1) Confirmatory large-scale prospective cohorts to mitigate residual bias; (2) Detailed error profiling and threshold optimization to further reduce false positives; and (3) Cost-effectiveness and patient-outcome studies to substantiate real-world value.
This meta-analysis of 10 studies (involving a total of 2113 patients) confirmed that real-time AI-CAD significantly imp
| 1. | Sung H, Ferlay J, Siegel RL, Laversanne M, Soerjomataram I, Jemal A, Bray F. Global Cancer Statistics 2020: GLOBOCAN Estimates of Incidence and Mortality Worldwide for 36 Cancers in 185 Countries. CA Cancer J Clin. 2021;71:209-249. [RCA] [PubMed] [DOI] [Full Text] [Cited by in Crossref: 75126] [Cited by in RCA: 68227] [Article Influence: 13645.4] [Reference Citation Analysis (201)] |
| 2. | Huang LM, Yang WJ, Huang ZY, Tang CW, Li J. Artificial intelligence technique in detection of early esophageal cancer. World J Gastroenterol. 2020;26:5959-5969. [RCA] [PubMed] [DOI] [Full Text] [Full Text (PDF)] [Cited by in CrossRef: 16] [Cited by in RCA: 24] [Article Influence: 4.0] [Reference Citation Analysis (0)] |
| 3. | Sexton RE, Al Hallak MN, Diab M, Azmi AS. Gastric cancer: a comprehensive review of current and future treatment strategies. Cancer Metastasis Rev. 2020;39:1179-1203. [RCA] [PubMed] [DOI] [Full Text] [Cited by in Crossref: 459] [Cited by in RCA: 529] [Article Influence: 88.2] [Reference Citation Analysis (1)] |
| 4. | Suzuki H, Oda I, Abe S, Sekiguchi M, Mori G, Nonaka S, Yoshinaga S, Saito Y. High rate of 5-year survival among patients with early gastric cancer undergoing curative endoscopic submucosal dissection. Gastric Cancer. 2016;19:198-205. [RCA] [PubMed] [DOI] [Full Text] [Cited by in Crossref: 135] [Cited by in RCA: 195] [Article Influence: 19.5] [Reference Citation Analysis (1)] |
| 5. | Pimenta-Melo AR, Monteiro-Soares M, Libânio D, Dinis-Ribeiro M. Missing rate for gastric cancer during upper gastrointestinal endoscopy: a systematic review and meta-analysis. Eur J Gastroenterol Hepatol. 2016;28:1041-1049. [RCA] [PubMed] [DOI] [Full Text] [Cited by in Crossref: 185] [Cited by in RCA: 180] [Article Influence: 18.0] [Reference Citation Analysis (0)] |
| 6. | Hyun YS, Han DS, Bae JH, Park HS, Eun CS. Interobserver variability and accuracy of high-definition endoscopic diagnosis for gastric intestinal metaplasia among experienced and inexperienced endoscopists. J Korean Med Sci. 2013;28:744-749. [RCA] [PubMed] [DOI] [Full Text] [Full Text (PDF)] [Cited by in Crossref: 13] [Cited by in RCA: 16] [Article Influence: 1.2] [Reference Citation Analysis (0)] |
| 7. | Ebigbo A, Messmann H, Lee SH. Artificial Intelligence Applications in Image-Based Diagnosis of Early Esophageal and Gastric Neoplasms. Gastroenterology. 2025;169:396-415.e2. [RCA] [PubMed] [DOI] [Full Text] [Cited by in RCA: 13] [Reference Citation Analysis (0)] |
| 8. | Wang J, Li Y, Chen B, Cheng D, Liao F, Tan T, Xu Q, Liu Z, Huang Y, Zhu C, Cao W, Yao L, Wu Z, Wu L, Zhang C, Xiao B, Xu M, Liu J, Li S, Yu H. A real-time deep learning-based system for colorectal polyp size estimation by white-light endoscopy: development and multicenter prospective validation. Endoscopy. 2024;56:260-270. [RCA] [PubMed] [DOI] [Full Text] [Cited by in RCA: 19] [Reference Citation Analysis (0)] |
| 9. | Li N, Yang J, Li X, Shi Y, Wang K. Accuracy of artificial intelligence-assisted endoscopy in the diagnosis of gastric intestinal metaplasia: A systematic review and meta-analysis. PLoS One. 2024;19:e0303421. [RCA] [PubMed] [DOI] [Full Text] [Full Text (PDF)] [Cited by in Crossref: 2] [Cited by in RCA: 14] [Article Influence: 7.0] [Reference Citation Analysis (0)] |
| 10. | Huang C, Song Y, Dong J, Yang F, Guo J, Sun S. Diagnostic performance of AI-assisted endoscopy diagnosis of digestive system tumors: an umbrella review. Front Oncol. 2025;15:1519144. [RCA] [PubMed] [DOI] [Full Text] [Full Text (PDF)] [Cited by in RCA: 1] [Reference Citation Analysis (0)] |
| 11. | van der Putten J, de Groof J, Struyvenberg M, Boers T, Fockens K, Curvers W, Schoon E, Bergman J, van der Sommen F, de With PHN. Multi-stage domain-specific pretraining for improved detection and localization of Barrett's neoplasia: A comprehensive clinically validated study. Artif Intell Med. 2020;107:101914. [RCA] [PubMed] [DOI] [Full Text] [Cited by in Crossref: 7] [Cited by in RCA: 16] [Article Influence: 2.7] [Reference Citation Analysis (0)] |
| 12. | Yan T, Wong PK, Choi IC, Vong CM, Yu HH. Intelligent diagnosis of gastric intestinal metaplasia based on convolutional neural network and limited number of endoscopic images. Comput Biol Med. 2020;126:104026. [RCA] [PubMed] [DOI] [Full Text] [Cited by in Crossref: 44] [Cited by in RCA: 39] [Article Influence: 6.5] [Reference Citation Analysis (0)] |
| 13. | Struyvenberg MR, de Groof AJ, Fonollà R, van der Sommen F, de With PHN, Schoon EJ, Weusten BLAM, Leggett CL, Kahn A, Trindade AJ, Ganguly EK, Konda VJA, Lightdale CJ, Pleskow DK, Sethi A, Smith MS, Wallace MB, Wolfsen HC, Tearney GJ, Meijer SL, Vieth M, Pouw RE, Curvers WL, Bergman JJ. Prospective development and validation of a volumetric laser endomicroscopy computer algorithm for detection of Barrett's neoplasia. Gastrointest Endosc. 2021;93:871-879. [RCA] [PubMed] [DOI] [Full Text] [Cited by in Crossref: 7] [Cited by in RCA: 13] [Article Influence: 2.6] [Reference Citation Analysis (0)] |
| 14. | Hussein M, González-Bueno Puyal J, Lines D, Sehgal V, Toth D, Ahmad OF, Kader R, Everson M, Lipman G, Fernandez-Sordo JO, Ragunath K, Esteban JM, Bisschops R, Banks M, Haefner M, Mountney P, Stoyanov D, Lovat LB, Haidry R. A new artificial intelligence system successfully detects and localises early neoplasia in Barrett's esophagus by using convolutional neural networks. United European Gastroenterol J. 2022;10:528-537. [RCA] [PubMed] [DOI] [Full Text] [Full Text (PDF)] [Cited by in Crossref: 33] [Cited by in RCA: 36] [Article Influence: 9.0] [Reference Citation Analysis (1)] |
| 15. | Zhao Q, Jia Q, Chi T. Deep learning as a novel method for endoscopic diagnosis of chronic atrophic gastritis: a prospective nested case-control study. BMC Gastroenterol. 2022;22:352. [RCA] [PubMed] [DOI] [Full Text] [Full Text (PDF)] [Cited by in RCA: 9] [Reference Citation Analysis (0)] |
| 16. | Zhao Q, Chi T. Deep learning model can improve the diagnosis rate of endoscopic chronic atrophic gastritis: a prospective cohort study. BMC Gastroenterol. 2022;22:133. [RCA] [PubMed] [DOI] [Full Text] [Full Text (PDF)] [Cited by in Crossref: 1] [Cited by in RCA: 18] [Article Influence: 4.5] [Reference Citation Analysis (0)] |
| 17. | Abdelrahim M, Saiko M, Maeda N, Hossain E, Alkandari A, Subramaniam S, Parra-Blanco A, Sanchez-Yague A, Coron E, Repici A, Bhandari P. Development and validation of artificial neural networks model for detection of Barrett's neoplasia: a multicenter pragmatic nonrandomized trial (with video). Gastrointest Endosc. 2023;97:422-434. [RCA] [PubMed] [DOI] [Full Text] [Cited by in Crossref: 57] [Cited by in RCA: 44] [Article Influence: 14.7] [Reference Citation Analysis (0)] |
| 18. | Zhao Q, Jia Q, Chi T. U-Net deep learning model for endoscopic diagnosis of chronic atrophic gastritis and operative link for gastritis assessment staging: a prospective nested case-control study. Therap Adv Gastroenterol. 2023;16:17562848231208669. [RCA] [PubMed] [DOI] [Full Text] [Full Text (PDF)] [Cited by in RCA: 6] [Reference Citation Analysis (0)] |
| 19. | Meinikheim M, Mendel R, Palm C, Probst A, Muzalyova A, Scheppach MW, Nagl S, Schnoy E, Römmele C, Schulz DAH, Schlottmann J, Prinz F, Rauber D, Rückert T, Matsumura T, Fernández-Esparrach G, Parsa N, Byrne MF, Messmann H, Ebigbo A. Influence of artificial intelligence on the diagnostic performance of endoscopists in the assessment of Barrett's esophagus: a tandem randomized and video trial. Endoscopy. 2024;56:641-649. [RCA] [PubMed] [DOI] [Full Text] [Cited by in RCA: 23] [Reference Citation Analysis (0)] |
| 20. | Tao X, Zhu Y, Dong Z, Huang L, Shang R, Du H, Wang J, Zeng X, Wang W, Wang J, Li Y, Deng Y, Wu L, Yu H. An artificial intelligence system for chronic atrophic gastritis diagnosis and risk stratification under white light endoscopy. Dig Liver Dis. 2024;56:1319-1326. [RCA] [PubMed] [DOI] [Full Text] [Cited by in Crossref: 1] [Cited by in RCA: 8] [Article Influence: 4.0] [Reference Citation Analysis (0)] |
| 21. | de Groof AJ, Struyvenberg MR, Fockens KN, van der Putten J, van der Sommen F, Boers TG, Zinger S, Bisschops R, de With PH, Pouw RE, Curvers WL, Schoon EJ, Bergman JJGHM. Deep learning algorithm detection of Barrett's neoplasia with high accuracy during live endoscopic procedures: a pilot study (with video). Gastrointest Endosc. 2020;91:1242-1250. [RCA] [PubMed] [DOI] [Full Text] [Cited by in Crossref: 66] [Cited by in RCA: 96] [Article Influence: 16.0] [Reference Citation Analysis (1)] |
| 22. | Zhang Y, Li F, Yuan F, Zhang K, Huo L, Dong Z, Lang Y, Zhang Y, Wang M, Gao Z, Qin Z, Shen L. Diagnosing chronic atrophic gastritis by gastroscopy using artificial intelligence. Dig Liver Dis. 2020;52:566-572. [RCA] [PubMed] [DOI] [Full Text] [Cited by in Crossref: 45] [Cited by in RCA: 88] [Article Influence: 14.7] [Reference Citation Analysis (0)] |
| 23. | Spadaccini M, Vespa E, Chandrasekar VT, Desai M, Patel HK, Maselli R, Fugazza A, Carrara S, Anderloni A, Franchellucci G, De Marco A, Hassan C, Bhandari P, Sharma P, Repici A. Advanced imaging and artificial intelligence for Barrett's esophagus: What we should and soon will do. World J Gastroenterol. 2022;28:1113-1122. [RCA] [PubMed] [DOI] [Full Text] [Full Text (PDF)] [Cited by in CrossRef: 11] [Cited by in RCA: 11] [Article Influence: 2.8] [Reference Citation Analysis (0)] |


