Published online Oct 15, 2025. doi: 10.4239/wjd.v16.i10.110406
Revised: June 24, 2025
Accepted: September 12, 2025
Published online: October 15, 2025
Processing time: 131 Days and 21.5 Hours
The Zhejiang University (ZJU) index has been demonstrated to have notable value in predicting metabolic dysfunction-associated steatotic liver disease (MASLD) within Chinese populations. However, the correlation between the ZJU index and MASLD in type 2 diabetes mellitus (T2DM) patients remains to be elucidated.
To investigate the association between the ZJU index and MASLD among patients with T2DM.
This cross-sectional study was conducted on hospitalised patients diagnosed with T2DM. Anthropometric measurements, laboratory data, and ultrasound results were initially collected from all patients. The ZJU index was subsequently calculated. Regression analysis was then used to explore risk factors affecting MASLD, and the optimal ZJU index cut-off value for diagnosing MASLD was determined using restricted cubic spline analysis. Finally, a new model for predicting MASLD in T2DM patients based on the ZJU index was constructed. This model was based on the risk factors identified by regression analysis, and the area under curve values were calculated. The validity and reliability of the models were then compared with each other.
A total of 688 patients with T2DM were included in this study. A significant positive correlation was identified between the ZJU index and the development of MASLD. Furthermore, the results of the restricted cubic spline analysis showed a non-linear association between ZJU index and MASLD. The ZJU value of 38.87 was identified as the key threshold for diagnosing MASLD. The new predictive model, which was developed by regression analysis, demonstrated a higher diagnostic value for MASLD and exhibited good accuracy in comparison with metabolic indices alone (area under curve = 0.76, 95% confidence interval: 0.72-0.80).
The ZJU index has been shown to be linked to the risk of developing MASLD, and the new model constructed has been shown to possess good predictive value.
Core Tip: This study is pioneering in its systematic evaluation of the correlation between the Zhejiang University (ZJU) index and metabolic dysfunction-associated steatotic liver disease (MASLD) in patients with type 2 diabetes mellitus (T2DM), and the construction of a new model for predicting MASLD. This study demonstrated that an elevated ZJU index was associated with an increased risk of MASLD in patients with T2DM. The risk of MASLD increased significantly when the ZJU index exceeded 38.87. The novel model developed has been shown to have a satisfactory predictive value for the risk of developing MASLD in patients with T2DM.
- Citation: Tao XY, Pan TR, Zhong X, Pan XY. Association between Zhejiang University index and metabolic dysfunction-associated steatotic liver disease in patients with type 2 diabetes mellitus. World J Diabetes 2025; 16(10): 110406
- URL: https://www.wjgnet.com/1948-9358/full/v16/i10/110406.htm
- DOI: https://dx.doi.org/10.4239/wjd.v16.i10.110406
Metabolic dysfunction-associated steatotic liver disease (MASLD) is a clinicopathological syndrome which is characterised by the intracellular accumulation of fat within the liver’s stem cells. This results in hepatocellular steatosis and lipid accumulation, which may be caused by a number of factors, including, but not exclusively, obesity and insulin resistance[1,2]. The prevalence of obesity and type 2 diabetes mellitus (T2DM) has led to a global increase in the prevalence and incidence of MASLD. This has attracted extensive clinical and public health attention due to its significantly increased risk of death and liver transplantation[3,4]. The liver, as the central organ responsible for regulating energy and glucolipid metabolism, is particularly vulnerable to the adverse effects of obesity, metabolic syndrome, and T2DM, which are major risk factors for MASLD. Conventional wisdom, as evidenced by previous studies, indicates a heightened probability of MASLD in patients suffering from T2DM. This phenomenon can be attributed to the presence of metabolic disturbances in such subjects. Consequently, the development of a straightforward, novel model for predicting MASLD based on metabolic indicators is particularly advantageous for clinical applications and has the potential to yield substantial clinical benefits[5,6].
The Zhejiang University (ZJU) index is a novel index that has been developed for the purpose of reflecting insulin resistance. The ZJU index is more comprehensive and accurate than previous indexes because it considers liver function, glycaemia, cholesterol, and anthropometry. It is also easy to use, which facilitates its wide application in clinical practice[7]. The ZJU index was firstly developed for predicting the presence of MASLD in the Chinese population. Earlier studies have demonstrated the ZJU index’s diagnostic and predictive value for MASLD in obese and general populations[8,9]. The ZJU index has been reported to outperform the liver fibrosis index and fatty liver index in identifying MASLD in the Chinese population[10]. There is a close relationship between T2DM and MASLD. However, the extent to which the ZJU index performs similarly in MASLD cases among T2DM patients remains to be elucidated in relevant studies. This study investigated the relationship between the ZJU index and MASLD in individuals with T2DM. Additionally, it assessed the predictive capacity and diagnostic accuracy of the ZJU index for MASLD. The study developed a novel model to predict the onset of MASLD in patients with T2DM, incorporating a comprehensive set of influencing factors.
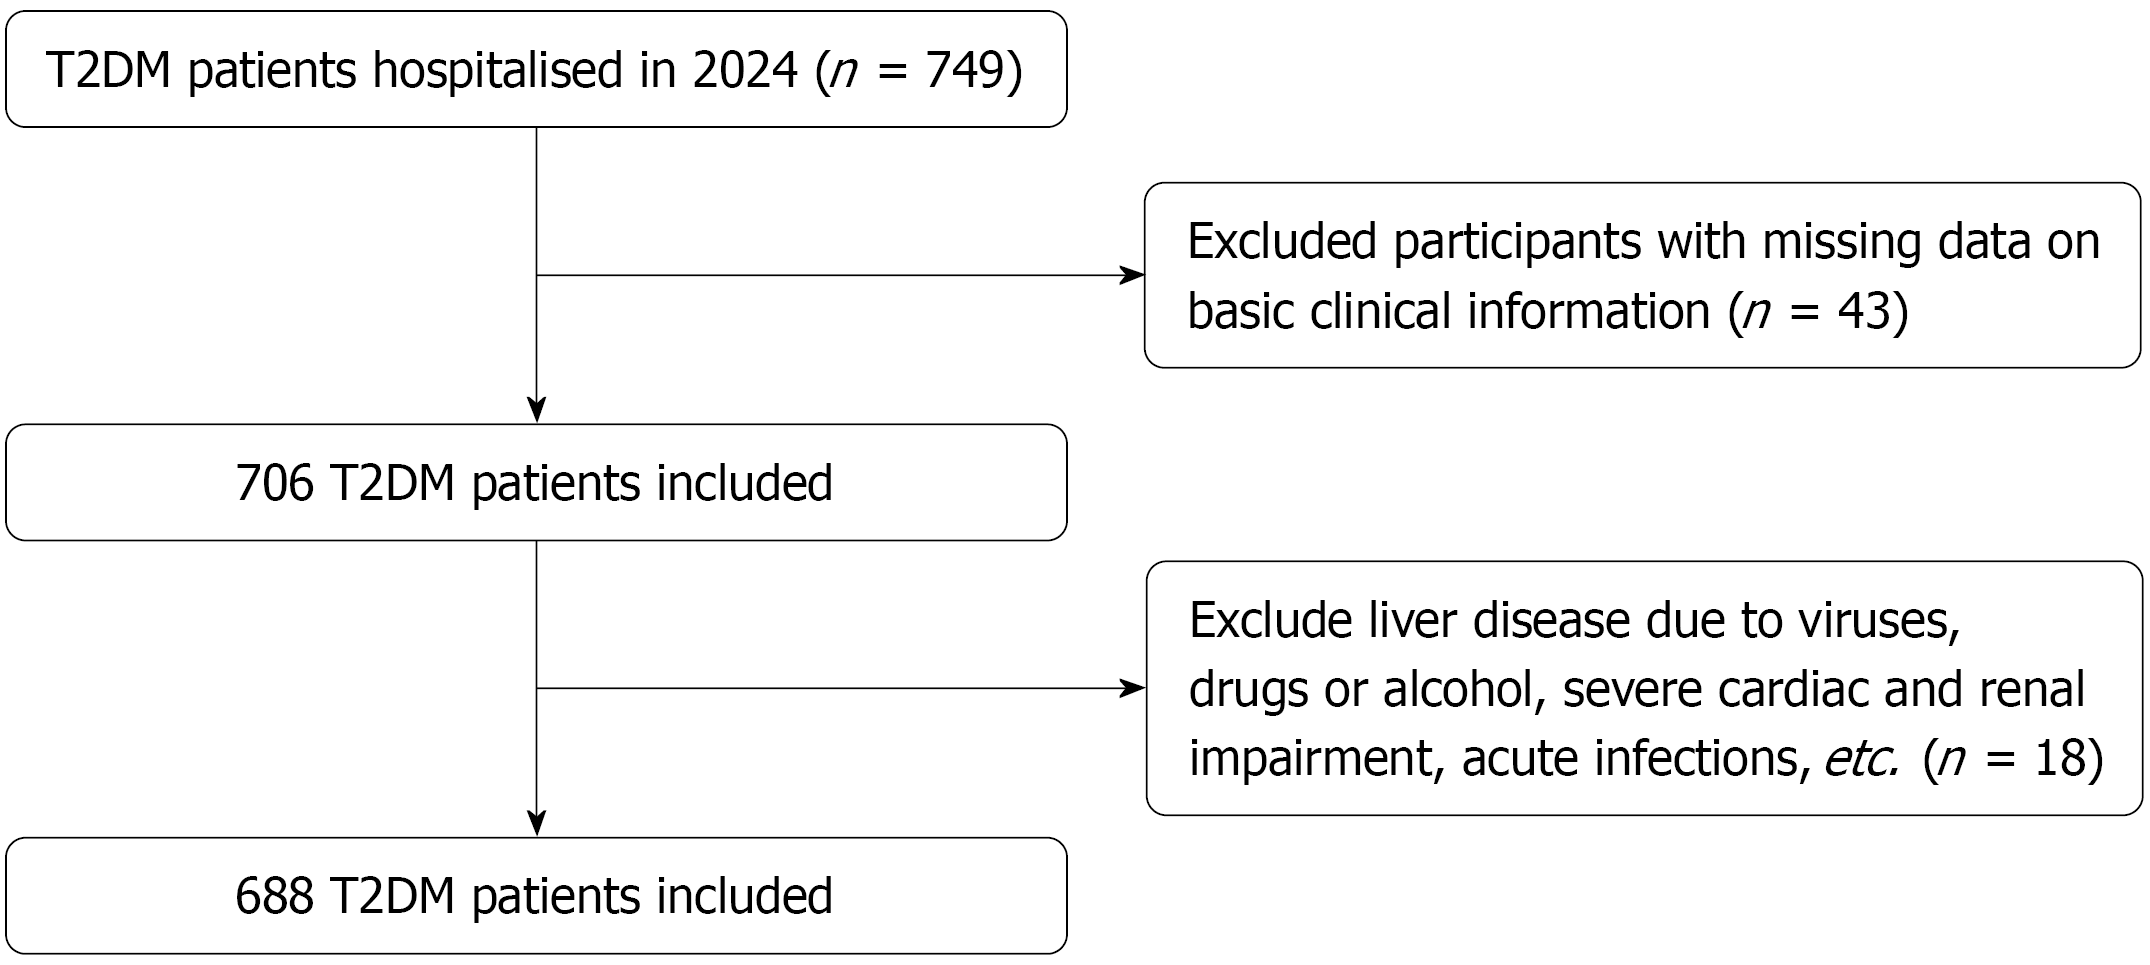
The population of this study was comprised of patients suffering from T2DM who were hospitalised from January 2024 to October 2024 in the Department of Endocrinology at The Second Affiliated Hospital of Anhui Medical University. The study was conducted as a cross-sectional investigation, and the total number of T2DM patients included was 688. The exclusion criteria encompassed the following: (1) Individuals diagnosed with type 1 diabetes mellitus, other specific types of diabetes mellitus, or severe diabetic complications; (2) Those without available basic clinical data; (3) Individuals with liver injury attributable to viruses, drugs, or alcohol, among others; (4) Total weekly alcohol consumption was > 140 g for men and > 70 g for women; and (5) Individuals with severe cardiac and renal impairment, chronic wasting disease, acute infections, or other liver metabolism-affecting disorders. All subjects diagnosed with T2DM enrolled in the study underwent a series of evaluations, including the completion of questionnaires, the conducting of laboratory tests, anthropometric measurements, and liver ultrasonography. The study was approved by the Ethics Committee of The Second Affiliated Hospital of Anhui Medical University in accordance with the Declaration of Helsinki, No. YX2023-068.
All patients who were admitted to hospital were assigned to a specialist nurse, who collected data on general characteristics of patients with T2DM, including age, gender, smoking and drinking status, and height and weight, from which the body mass index (BMI) was calculated. Blood pressure was measured to record systolic blood pressure (SBP) and diastolic blood pressure (DBP). Comorbidities, such as hypertension and coronary artery disease (CAD), were also recorded. Routine blood and biochemical measurements were taken from all participants. The venipuncture for this study was performed on all participants by professional laboratory technicians at The Second Affiliated Hospital of Anhui Medical University. Blood and other samples were collected from all participants upon enrolment. The subsequent parameters underwent analysis in a professional laboratory: Fasting blood glucose (FBG), glycated hemoglobin, red blood cell count, blood urea nitrogen (BUN), total protein (TP), aspartate transaminase (AST), uric acid (UA), white blood cell (WBC) count, alanine aminotransferase (ALT), serum creatinine (Scr), blood platelet (PLT) count, and lipid profile.
The ZJU index is based on FBG, BMI, AST, triglycerides (TG) and ALT. The calculation of the ZJU index is determined by the following formula: The ZJU index is determined by the following formula: BMI (kg/m2) + FBG (mmol/L) + TG (mmol/L) + 3 × ALT/AST ratio. In the case of women, the formula is further modified by adding 2[8].
Liver ultrasonography procedures were conducted on all subjects to ascertain the presence of MASLD. This process was evaluated by at least two attending physicians in accordance with the guidelines established by the Chinese Society of Liver Diseases[11].
In this study, R 4.3.0 software was utilised for statistical analysis. Continuous data exhibiting a normal distribution were expressed as the mean ± SD. Comparisons between two groups of data were conducted using the two-sample t-test for independent samples. Whereas for continuous data with skewed distribution, the median (Q1, Q3) method was employed, and comparisons between two groups were made using the rank sum test for two independent samples. The analysis of categorical data was performed as n (%), while the χ2 test or the Fisher’s exact probability method were utilised. Logistic regression is utilised for the analysis of the relationships between variables. In order to ascertain non-linear correlations between variables, restricted cubic spline (RCS) plots are utilised. The construction of a predictive model was undertaken, and the receiver operating characteristic (ROC) curve was utilised to ascertain the predictive efficacy of the model. Verify the reliability of the new model using bootstrapping cross-validated. The robustness of the model was evaluated using decision curve analysis (DCA) curves and calibration curves. In the context of this study, a statistically significant difference between the two groups was defined as a P value of less than 0.05.
In accordance with the study protocol, a total of 688 patients with T2DM were eligible for inclusion in this study for further analysis (Figure 1). Based on whether or not they had been diagnosed with MASLD, all patients were divided into the MASLD group (n = 343) and the non-MASLD group (n = 345). Patients in the MASLD group exhibited higher BMI, DBP, WBC, TP, ALT, AST, total cholesterol (TC), TG, and low-density lipoprotein cholesterol (LDL-C) values, and a concomitantly elevated prevalence of alcohol consumption, in comparison to patients in the non-MASLD group (Table 1). Conversely, patients in the MASLD group demonstrated lower age, BUN, high-density lipoprotein cholesterol (HDL-C), and CAD rates, in comparison to patients in the non-MASLD group (Table 1). With regard to the ZJU index, the mean value was 40.07 ± 7.03 in the total cohort of patients, and this value was significantly higher in patients with MASLD (42.27 ± 6.7) than in patients with non-MASLD (37.88 ± 6.67; P < 0.001) (Table 1).
| Variables | Total (n = 688) | Non-MASLD (n = 345) | MASLD (n = 343) | P value |
| Age (years) | 56.71 ± 12.73 | 59.97 ± 11.9 | 53.44 ± 12.72 | < 0.001 |
| BMI (kg/m2) | 25.16 ± 3.64 | 23.88 ± 3.21 | 26.45 ± 3.59 | < 0.001 |
| SBP (mmHg) | 129.38 ± 18.11 | 128.11 ± 18.75 | 130.66 ± 17.37 | 0.064 |
| DBP (mmHg) | 78.37 ± 11.56 | 75.43 ± 11.1 | 81.33 ± 11.27 | < 0.001 |
| HbA1c (%) | 9.10 ± 2.29 | 9.08 ± 2.50 | 9.12 ± 2.06 | 0.835 |
| WBC (× 109/L) | 6.35 ± 1.71 | 6.11 ± 1.55 | 6.60 ± 1.82 | < 0.001 |
| RBC (× 1012/L), median (Q1, Q3) | 4.57 (4.22, 4.94) | 4.46 (4.09, 4.85) | 4.70 (4.35, 5.03) | 0.291 |
| PLT (× 109/L) | 190.45 ± 56.48 | 186.71 ± 61.13 | 194.20 ± 51.19 | 0.083 |
| TP (g/L) | 65.23 ± 5.62 | 64.75 ± 5.53 | 65.72 ± 5.68 | 0.024 |
| ALT (U/L) | 29.08 ± 30.09 | 23.61 ± 29.12 | 34.59 ± 30.09 | < 0.001 |
| AST (U/L) | 24.99 ± 23.85 | 22.13 ± 16.25 | 27.87 ± 29.34 | 0.002 |
| BUN (mmol/L) | 6.69 ± 2.35 | 7.13 ± 2.4 | 6.24 ± 2.21 | < 0.001 |
| TC (mmol/L) | 4.72 ± 1.44 | 4.57 ± 1.47 | 4.87 ± 1.39 | 0.007 |
| TG (mmol/L) | 2.33 ± 2.68 | 1.76 ± 1.67 | 2.91 ± 3.31 | < 0.001 |
| HDL-C (mmol/L) | 1.10 ± 0.32 | 1.14 ± 0.27 | 1.06 ± 0.35 | < 0.001 |
| LDL-C (mmol/L) | 2.82 ± 0.93 | 2.71 ± 0.88 | 2.93 ± 0.97 | 0.003 |
| FBG (mmol/L) | 8.51 ± 3.87 | 8.48 ± 4.41 | 8.53 ± 3.24 | 0.863 |
| ZJU index | 40.07 ± 7.03 | 37.88 ± 6.67 | 42.27 ± 6.7 | < 0.001 |
| Scr (mmol/L) | 61.00 (49, 72) | 61.00 (50, 75) | 60.00 (49, 70) | 0.143 |
| UA (mmol/L), median (Q1, Q3) | 326.00 (267.5, 386) | 310.00 (255, 372) | 346.00 (284, 409.5) | < 0.001 |
| Sex (male) | 458 (66.57) | 221 (64.06) | 237 (69.1) | 0.161 |
| Smoking | 254 (36.92) | 120 (34.78) | 134 (39.07) | 0.244 |
| Drinking | 272 (39.53) | 115 (33.33) | 157 (45.77) | < 0.001 |
| Hypertension | 360 (52.33) | 172 (49.86) | 188 (54.81) | 0.193 |
| CAD | 71 (10.32) | 46 (13.33) | 25 (7.29) | 0.009 |
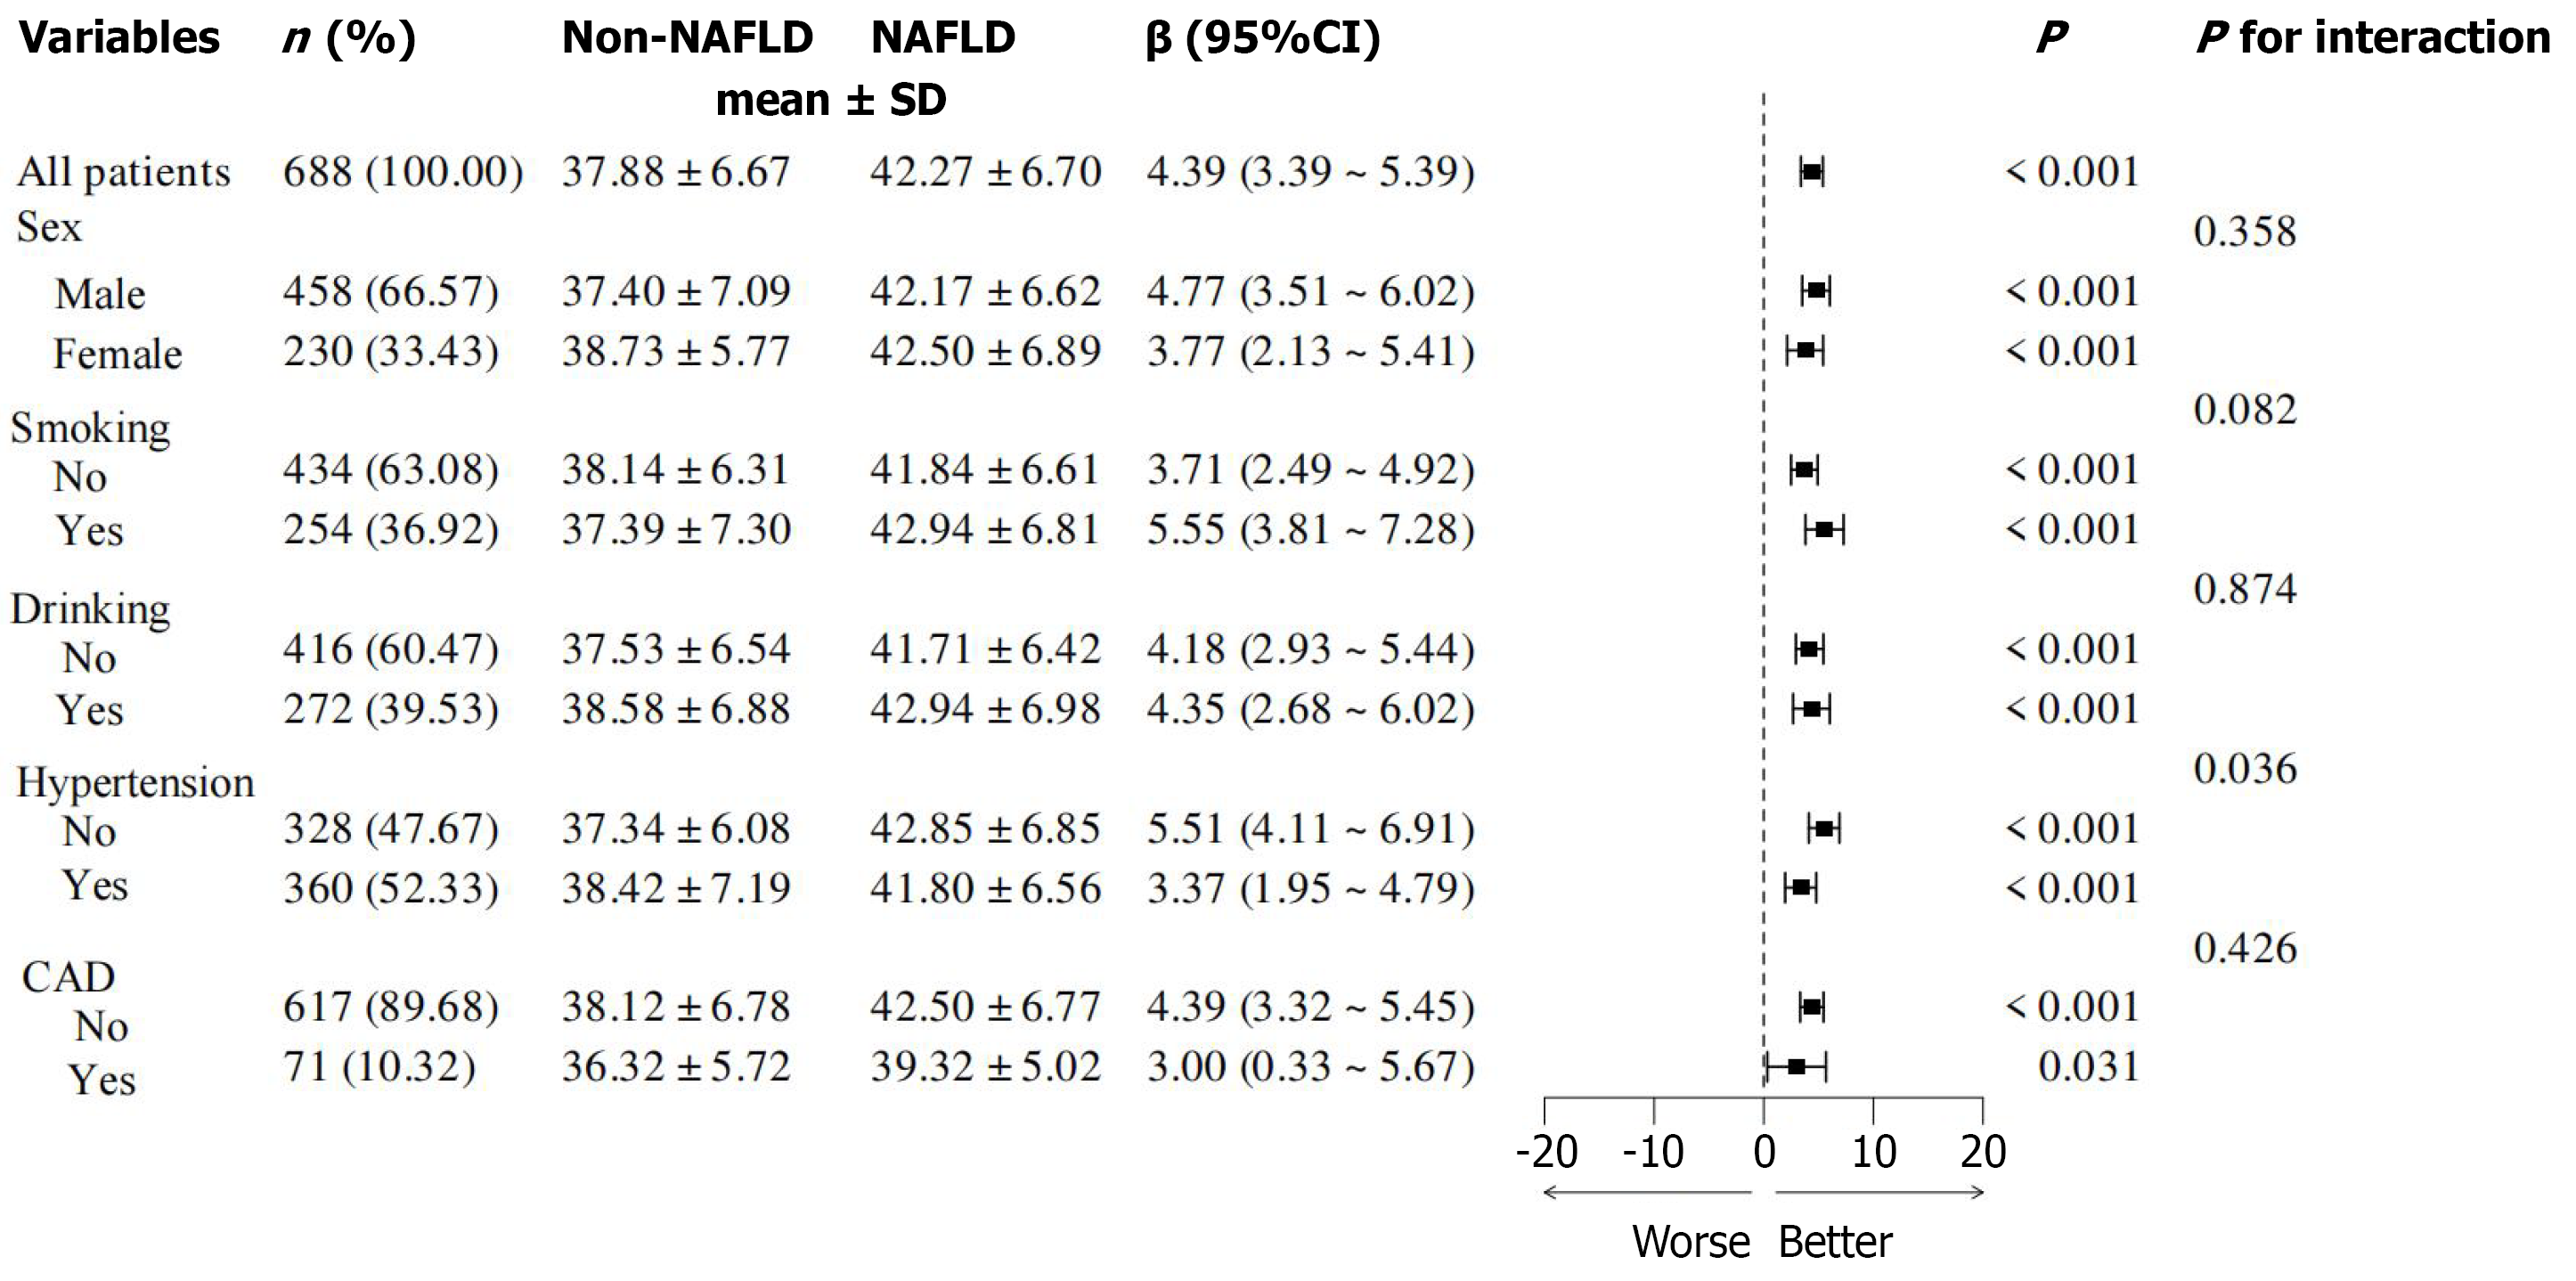
In order to explore the influencing factors of MASLD, regression analyses were conducted, and it was determined that factors such as alcohol consumption, BMI, DBP, WBC, TP, ALT, AST, TC, TG, LDL-C and ZJU index were positively correlated with the presence of MASLD (Table 2), with BMI and ZJU index being the most significant influencing factors. In contrast, regression analysis indicated a marked negative correlation among various parameters in T2DM patients, including age, BUN, HDL-C, and history of CAD (Table 2). Subgroup analyses revealed that the prevalence of MASLD was similar across different subgroups (Figure 2).
| Variables | β | SE | Z | P value | OR (95%CI) |
| Sex (female) | -0.23 | 0.16 | -1.4 | 0.162 | 0.80 (0.58-1.10) |
| Smoking | 0.18 | 0.16 | 1.16 | 0.244 | 1.20 (0.88-1.64) |
| Drinking | 0.52 | 0.16 | 3.33 | < 0.001 | 1.69 (1.24-2.30) |
| Hypertension | 0.2 | 0.15 | 1.3 | 0.193 | 1.22 (0.90-1.65) |
| CAD | -0.67 | 0.26 | -2.57 | 0.01 | 0.51 (0.31-0.85) |
| Age (years) | -0.04 | 0.01 | -6.49 | < 0.001 | 0.96 (0.95-0.97) |
| BMI (kg/m2) | 0.24 | 0.03 | 8.58 | < 0.001 | 1.27 (1.20-1.34) |
| SBP (mmHg) | 0.01 | 0 | 1.85 | 0.064 | 1.01 (1.00-1.02) |
| DBP (mmHg) | 0.05 | 0.01 | 6.46 | < 0.001 | 1.05 (1.03-1.07) |
| HbA1c (%) | 0.01 | 0.03 | 0.21 | 0.834 | 1.01 (0.94-1.08) |
| WBC (× 109/L) | 0.18 | 0.05 | 3.64 | < 0.001 | 1.20 (1.09-1.32) |
| RBC (× 1012/L) | -0.01 | 0.02 | -0.91 | 0.361 | 0.99 (0.95-1.02) |
| PLT (× 109/L) | 0 | 0 | 1.73 | 0.084 | 1.00 (1.00-1.01) |
| TP (g/L) | 0.03 | 0.01 | 2.25 | 0.024 | 1.03 (1.01-1.06) |
| ALT (U/L) | 0.02 | 0 | 4.69 | < 0.001 | 1.02 (1.01-1.03) |
| AST (U/L) | 0.02 | 0.01 | 3.03 | 0.002 | 1.02 (1.01-1.03) |
| BUN (mmol/L) | -0.19 | 0.04 | -4.86 | < 0.001 | 0.83 (0.77-0.89) |
| Scr (mmol/L) | 0 | 0 | -1.15 | 0.25 | 1.00 (0.99-1.00) |
| UA (mmol/L) | 0.01 | 0 | 4.74 | < 0.001 | 1.01 (1.01-1.01) |
| TC (mmol/L) | 0.16 | 0.06 | 2.65 | 0.008 | 1.17 (1.04-1.32) |
| TG (mmol/L) | 0.3 | 0.05 | 5.55 | < 0.001 | 1.35 (1.21-1.49) |
| HDL-C (mmol/L) | -1.02 | 0.29 | -3.52 | < 0.001 | 0.36 (0.20-0.64) |
| LDL-C (mmol/L) | 0.25 | 0.08 | 2.96 | 0.003 | 1.28 (1.09-1.52) |
| FBG (mmol/L) | 0 | 0.02 | 0.17 | 0.863 | 1.00 (0.97-1.04) |
| ZJU index | 0.11 | 0.01 | 7.78 | < 0.001 | 1.11 (1.08-1.14) |
Multivariate logistic regression analysis was employed to further examine the independent relationship between the ZJU index and MASLD. The findings of the regression analyses demonstrated that an augmented ZJU index was significantly correlated with a heightened risk of MASLD in model 1 (unadjusted), model 2 (adjusted for sex, drinking, smoking, hypertension, CAD), model 3 (adjustment for sex, drinking, smoking, hypertension, CAD, age, SBP, DBP, WBC, BUN, UA), and model 4 (adjustment for sex, drinking, smoking, hypertension, CAD, age, SBP, DBP, WBC, BUN, UA, TC, HDL-C, LDL-C) (all P < 0.001, Table 3).
| Variables | β | SE | Z | P value | OR (95%CI) |
| Model 1 | 0.11 | 0.01 | 7.78 | < 0.001 | 1.11 (1.08-1.14) |
| Model 2 | 0.10 | 0.01 | 7.38 | < 0.001 | 1.11 (1.08-1.14) |
| Model 3 | 0.07 | 0.02 | 4.56 | < 0.001 | 1.07 (1.04-1.11) |
| Model 4 | 0.07 | 0.02 | 4.36 | < 0.001 | 1.07 (1.04-1.11) |
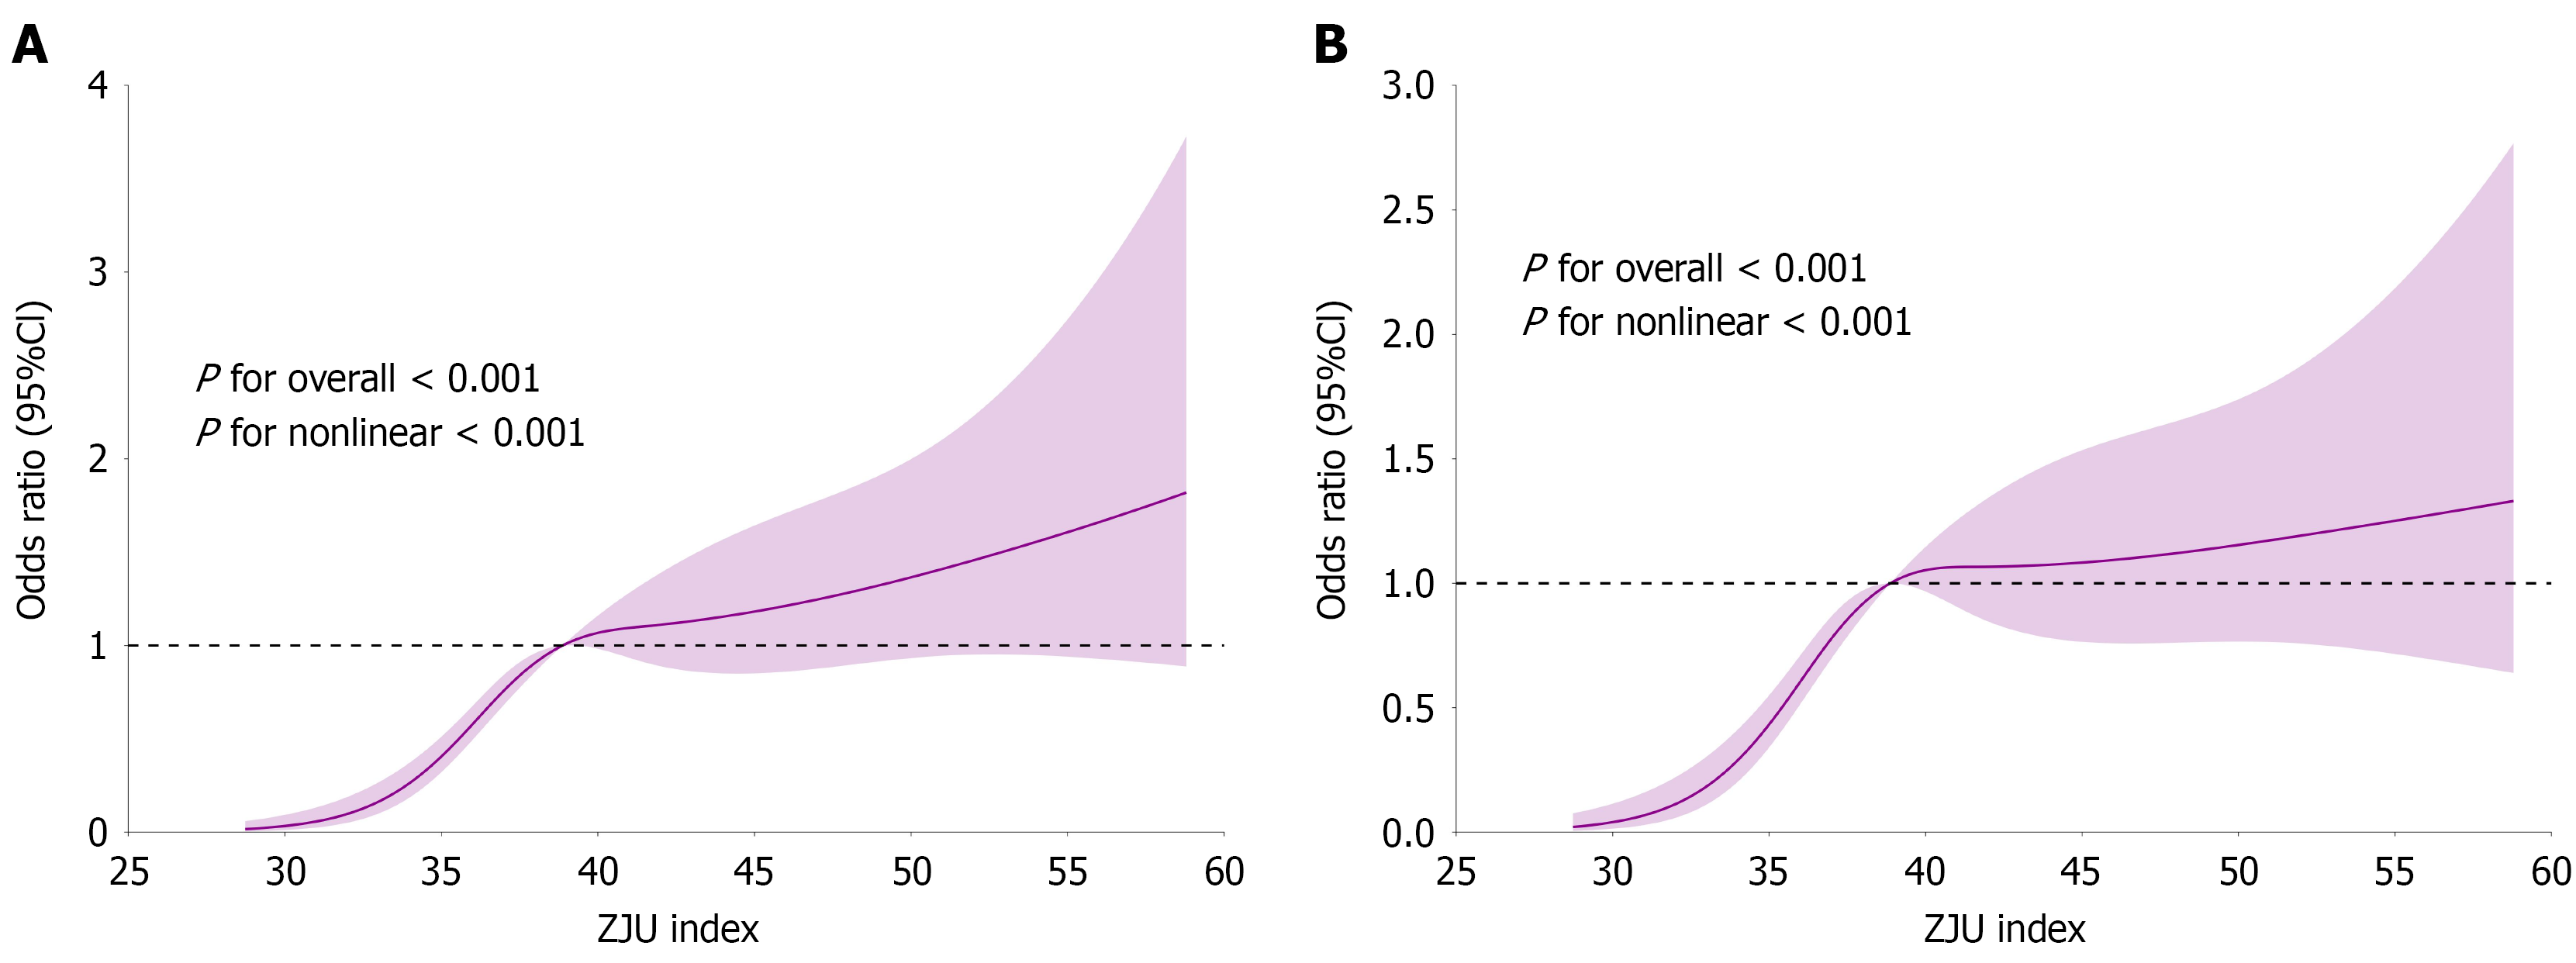
The results of the RCS analyses demonstrated a significant nonlinear relationship between the ZJU index and MASLD, with this nonlinear correlation remaining consistent after adjustments were made for factors including sex, smoking, alcohol consumption, hypertension, CAD, age, SBP, DBP, WBC, BUN, UA, TC, HDL-C, LDL-C (P for nonlinear < 0.001, Figure 3).
The critical ZJU value of 38.87 was determined through RCS analysis. Consequently, the ZJU value of 38.87 was employed to categorize the entire population into two groups: The high ZJU index group (n = 345) and the low ZJU index group (n = 343) (Table 4). The results of the between-group analysis of variance demonstrated that patients in the high ZJU index group exhibited elevated BMI, blood pressure, glycated hemoglobin, FBG, WBC, PLT, TP, ALT, AST, UA, TC, TG, LDL-C, and drinking rates, while age and HDL-C levels were reduced (Table 4). Furthermore, the low ZJU index group exhibited a lower prevalence of CAD (Table 4). The prevalence of MASLD was found to be 63.77% in the high ZJU index group and 35.86% in the low ZJU index group (P < 0.001, Table 4).
| Variables | Low ZJU (n = 343) | High ZJU (n = 345) | P value |
| Age (years) | 59.99 ± 10.71 | 53.44 ± 13.72 | < 0.001 |
| BMI (kg/m2) | 23.29 ± 2.48 | 27.02 ± 3.66 | < 0.001 |
| SBP (mmHg) | 127.95 ± 18.00 | 130.80 ± 18.13 | 0.039 |
| DBP (mmHg) | 75.46 ± 10.73 | 81.26 ± 11.64 | < 0.001 |
| HbA1c (%) | 8.41 ± 2.08 | 9.78 ± 2.29 | < 0.001 |
| WBC (× 109/L) | 6.14 ± 1.59 | 6.57 ± 1.79 | < 0.001 |
| RBC (× 1012/L) | 4.91 ± 7.70 | 5.01 ± 6.57 | 0.864 |
| PLT (× 109/L) | 185.45 ± 57.16 | 195.39 ± 55.44 | 0.021 |
| TP (g/L) | 63.83 ± 5.33 | 66.62 ± 5.56 | < 0.001 |
| ALT (U/L) | 21.01 ± 14.64 | 37.10 ± 38.29 | < 0.001 |
| AST (U/L) | 22.46 ± 24.97 | 27.51 ± 22.44 | 0.005 |
| BUN (mmol/L) | 6.84 ± 2.17 | 6.53 ± 2.51 | 0.078 |
| Scr (mmol/L) | 67.52 ± 36.89 | 67.74 ± 48.46 | 0.947 |
| UA (mmol/L) | 317.97 ± 83.05 | 353.39 ± 104.97 | < 0.001 |
| TC (mmol/L) | 4.30 ± 1.09 | 5.13 ± 1.61 | < 0.001 |
| TG (mmol/L) | 1.40 ± 0.97 | 3.25 ± 3.41 | < 0.001 |
| HDL-C (mmol/L) | 1.12 ± 0.27 | 1.08 ± 0.35 | 0.04 |
| LDL-C (mmol/L) | 2.60 ± 0.84 | 3.04 ± 0.96 | < 0.001 |
| FBG (mmol/L) | 6.56 ± 1.95 | 10.44 ± 4.31 | < 0.001 |
| Sex (male) | 240 (69.97) | 218 (63.19) | 0.059 |
| Smoking | 120 (34.99) | 134 (38.84) | 0.295 |
| Drinking | 116 (33.82) | 156 (45.22) | 0.002 |
| Hypertension | 182 (53.06) | 178 (51.59) | 0.7 |
| CAD | 49 (14.29) | 22 (6.38) | < 0.001 |
| MASLD | 123 (35.86) | 220 (63.77) | < 0.001 |
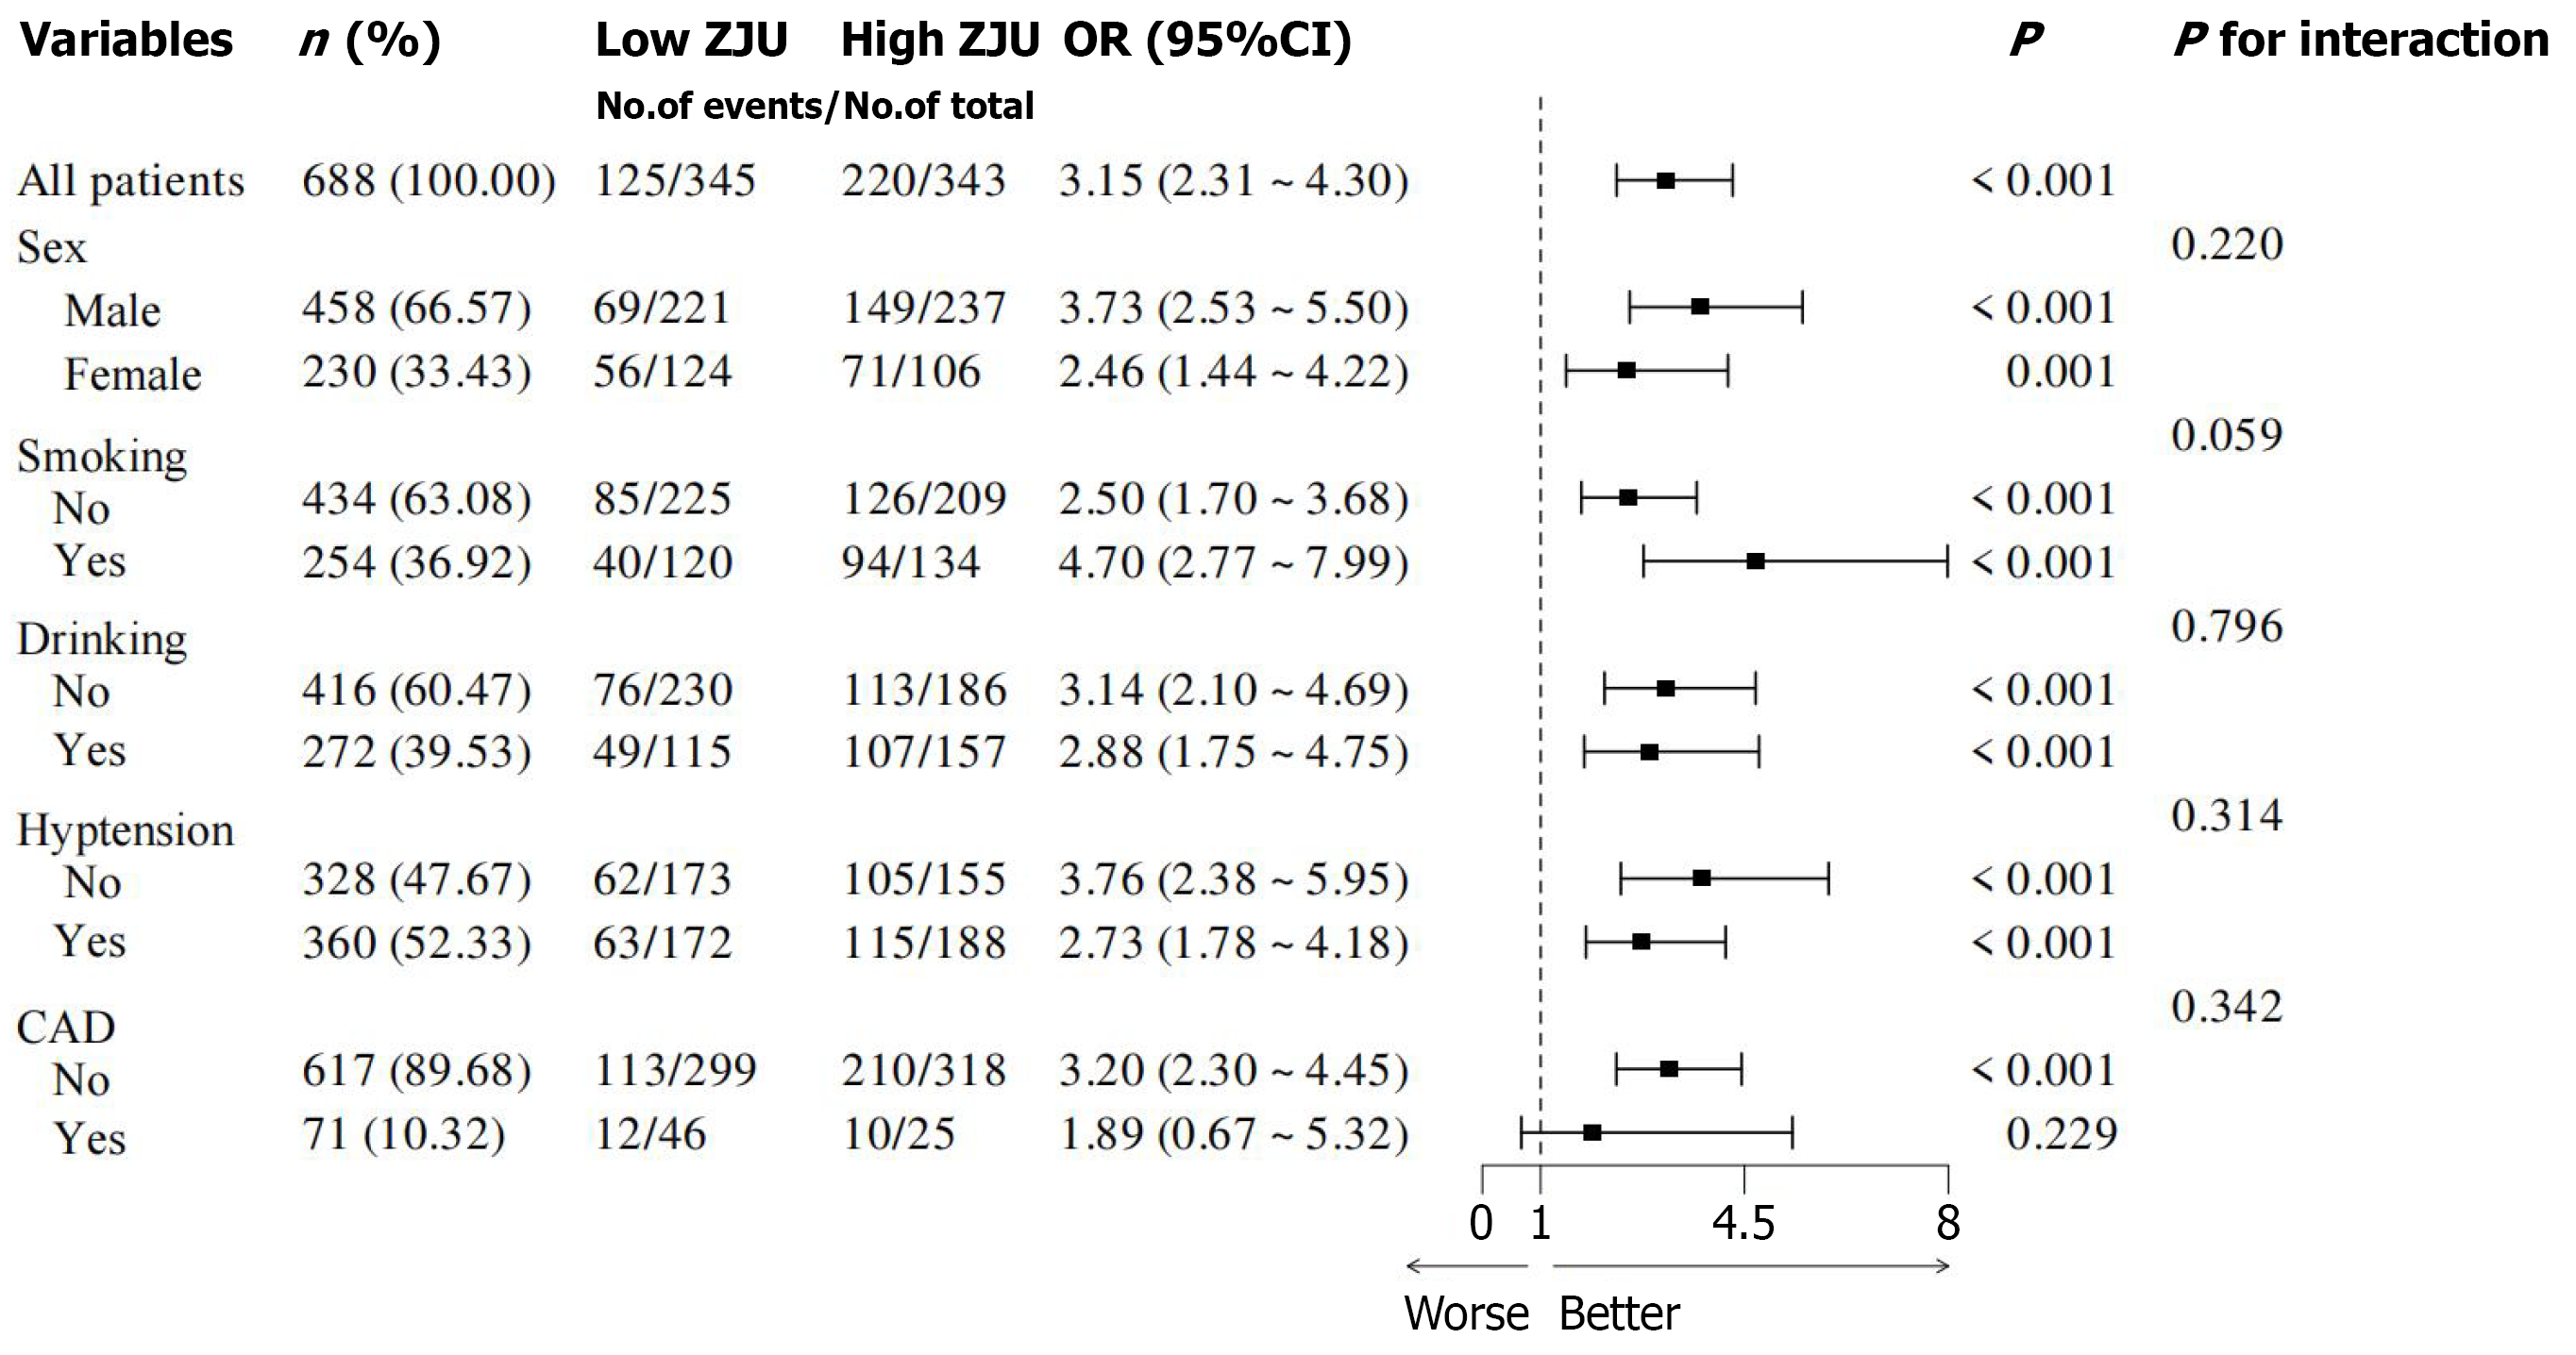
The findings of the logistic regression analyses demonstrated that there was a positively graded relationship between the ZJU index and alcohol consumption, BMI, DBP, WBC, TP, ALT, AST, TC, TG, and LDL-C, while it demonstrated a negative correlation with age, BUN, HDL-C, and history of CAD (Table 5). Of particular note was the significant positive correlation between ZJU values and non-alcoholic fatty liver disease (P < 0.001, Table 5). Subgroup analyses showed no significant differences in ZJU values between subgroups (Figure 4).
| Variables | β | SE | Z | P value | OR (95%CI) |
| Sex (female) | 0.31 | 0.16 | 1.88 | 0.06 | 1.36 (0.99-1.87) |
| Smoking | 0.17 | 0.16 | 1.05 | 0.295 | 1.18 (0.87-1.61) |
| Drinking | 0.48 | 0.16 | 3.05 | 0.002 | 1.62 (1.19-2.20) |
| Hypertension | -0.06 | 0.15 | -0.39 | 0.7 | 0.94 (0.70-1.27) |
| CAD | -0.89 | 0.27 | -3.33 | < 0.001 | 0.41 (0.24-0.69) |
| MASLD | 1.15 | 0.16 | 7.22 | < 0.001 | 3.15 (2.31-4.30) |
| Age (years) | -0.04 | 0.01 | -6.52 | < 0.001 | 0.96 (0.94-0.97) |
| BMI (kg/m2) | 0.46 | 0.04 | 11.61 | < 0.001 | 1.58 (1.46-1.71) |
| SBP (mmHg) | 0.01 | 0 | 2.06 | 0.039 | 1.01 (1.01-1.02) |
| DBP (mmHg) | 0.05 | 0.01 | 6.35 | < 0.001 | 1.05 (1.03-1.06) |
| HbA1c (%) | 0.29 | 0.04 | 7.47 | < 0.001 | 1.34 (1.24-1.45) |
| WBC (× 109/L) | 0.16 | 0.05 | 3.24 | 0.001 | 1.17 (1.06-1.29) |
| RBC (× 1012/L) | 0 | 0.01 | 0.17 | 0.864 | 1.00 (0.98-1.02) |
| PLT (× 109/L) | 0.01 | 0 | 2.29 | 0.022 | 1.01 (1.01-1.01) |
| TP (g/L) | 0.09 | 0.02 | 6.32 | < 0.001 | 1.10 (1.07-1.13) |
| ALT (U/L) | 0.04 | 0.01 | 6.85 | < 0.001 | 1.04 (1.03-1.05) |
| AST (U/L) | 0.01 | 0.01 | 2.63 | 0.008 | 1.01 (1.01-1.02) |
| BUN (mmol/L) | -0.06 | 0.03 | -1.74 | 0.081 | 0.94 (0.88-1.01) |
| Scr (mmol/L) | 0 | 0 | 0.07 | 0.947 | 1.00 (1.00-1.00) |
| UA (mmol/L) | 0.01 | 0 | 4.71 | < 0.001 | 1.01 (1.01-1.01) |
| TC (mmol/L) | 0.57 | 0.07 | 7.72 | < 0.001 | 1.77 (1.53-2.05) |
| TG (mmol/L) | 0.92 | 0.1 | 9.6 | < 0.001 | 2.51 (2.08-3.03) |
| HDL-C (mmol/L) | -0.54 | 0.27 | -2.01 | 0.045 | 0.58 (0.34-0.99) |
| LDL-C (mmol/L) | 0.56 | 0.09 | 6.06 | < 0.001 | 1.74 (1.46-2.09) |
| FBG (mmol/L) | 0.53 | 0.04 | 11.92 | < 0.001 | 1.70 (1.56-1.86) |
The findings of the multivariate logistic regression analyses demonstrated that an augmented ZJU index was significantly correlated with a heightened risk of MASLD in model 1 (unadjusted), model 2 (adjusted for sex, smoking, drinking, hypertension, CAD), model 3 (adjustment for sex, smoking, drinking, hypertension, CAD, age, SBP, DBP, WBC, PLT, BUN, UA, Scr, TP), and model 4 (adjustment for sex, smoking, drinking, hypertension, CAD, age, SBP, DBP, WBC, PLT, BUN, UA, Scr, TP, TC, HDL-C, LDL-C) (all P < 0.001, Table 6). As can be seen from the findings of this study, the odds ratio of the 1-SD increase in the ZJU index were 3.15 [95% confidence interval (CI): 2.31-4.30], 3.05 (95%CI: 2.21-4.20), 2.21 (95%CI: 1.54-3.16), and 1.89 (95%CI: 1.29-2.78), respectively (Table 6).
| Variables | β | SE | Z | P value | OR (95%CI) |
| Model 1 | 1.15 | 0.16 | 7.22 | < 0.001 | 3.15 (2.31-4.30) |
| Model 2 | 1.11 | 0.16 | 6.79 | < 0.001 | 3.05 (2.21-4.20) |
| Model 3 | 0.79 | 0.18 | 4.32 | < 0.001 | 2.21 (1.54-3.16) |
| Model 4 | 0.64 | 0.2 | 3.27 | < 0.001 | 1.89 (1.29-2.78) |
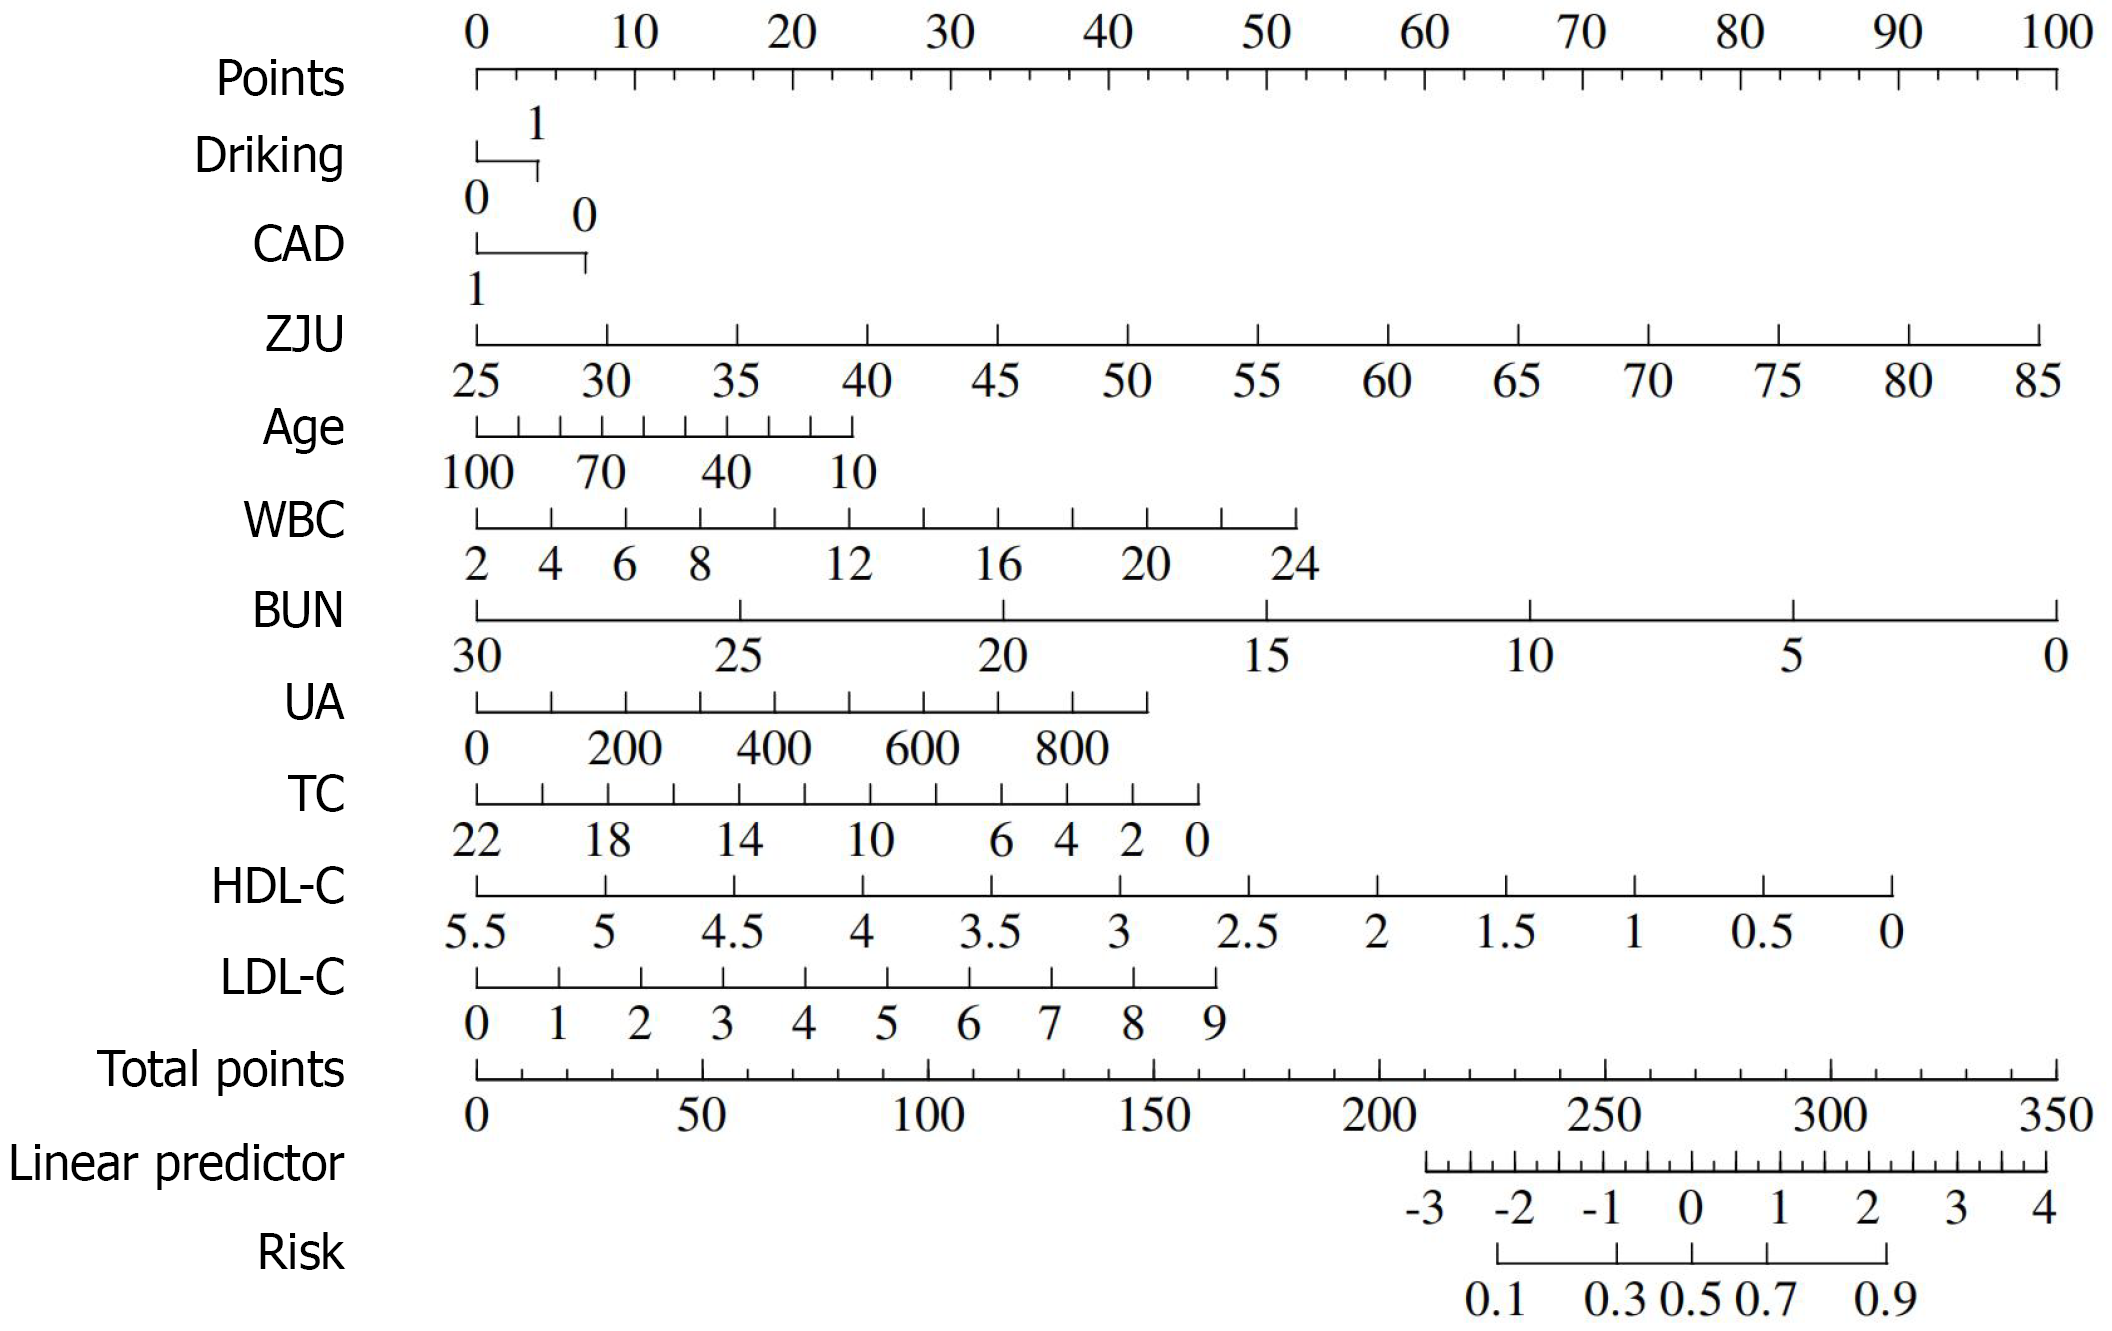
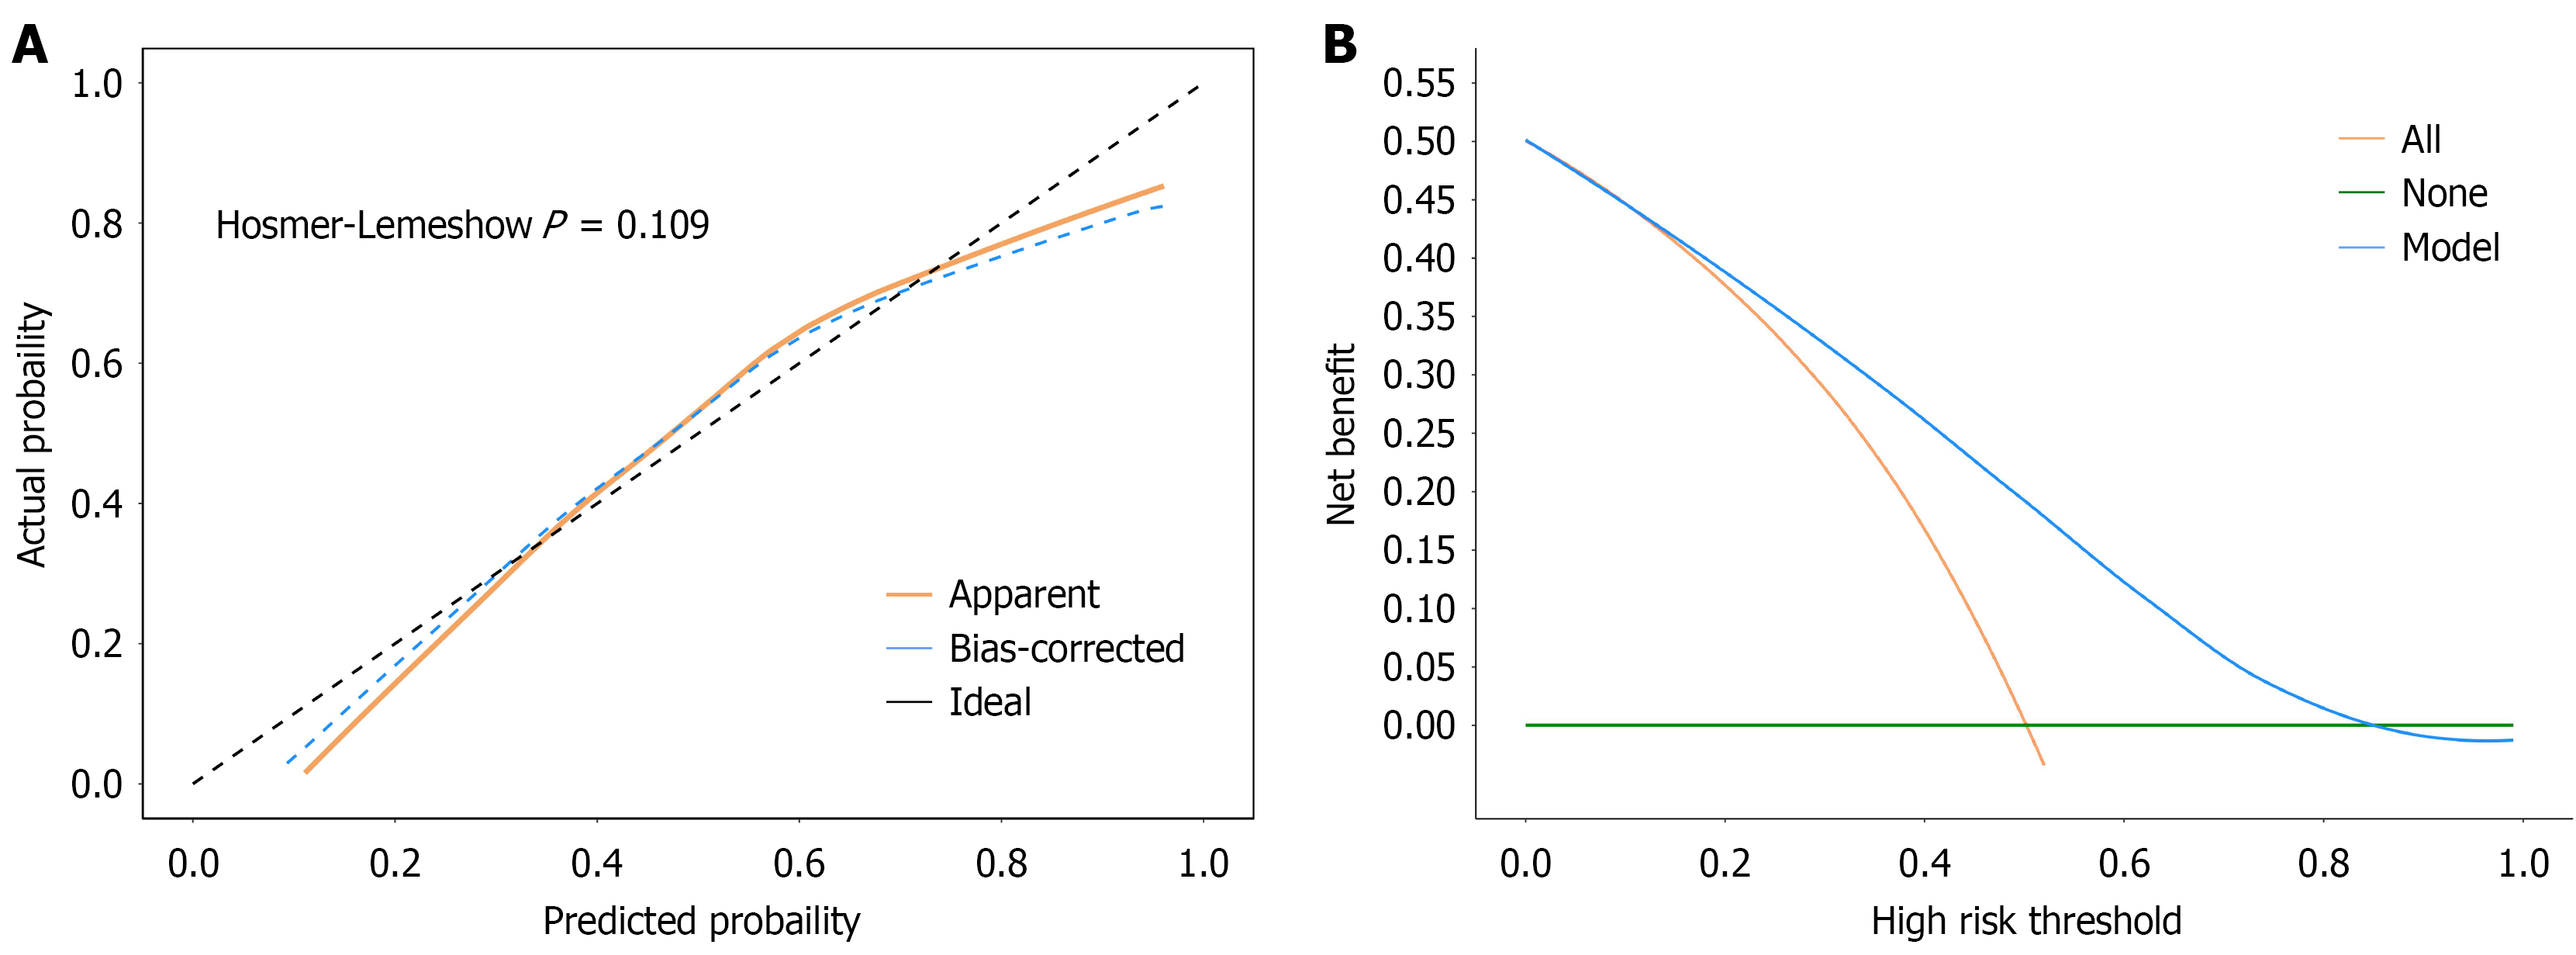
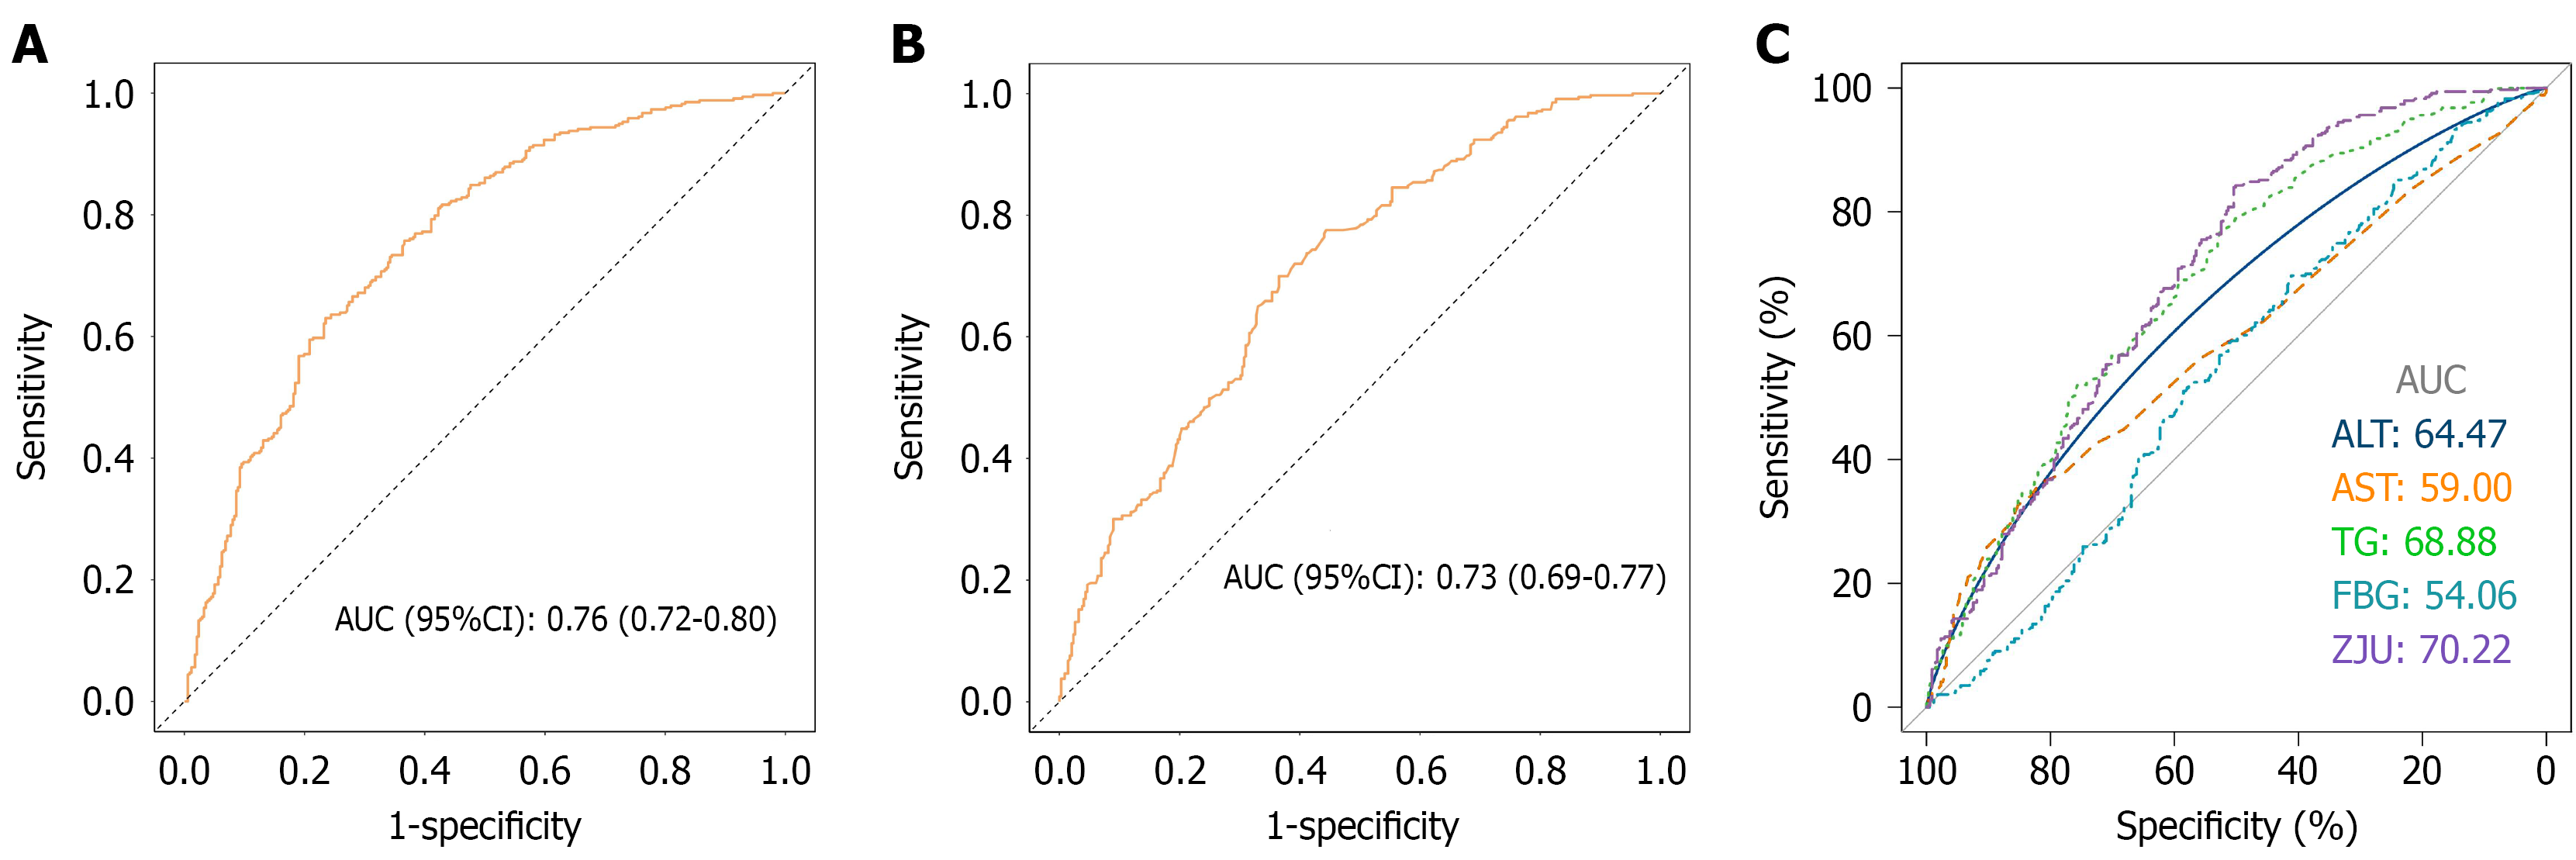
The ensuing analyses yielded a series of findings that were then used to construct a predictive model for the occurrence of MASLD. The model was constructed by taking into account a number of factors, including alcohol consumption, CAD, ZJU index, age, HDL-C, WBC, TC, BUN, UA and LDL-C (Figure 5). The DCA and calibration curves demonstrated the reliability of the new model (Figure 6). The ROC curve revealed that the new model had an area under curve (AUC) value of 0.76 for diagnosing MASLD (0.72-0.80) (Figure 7A). The bootstrapping cross-validated AUC value for the diagnosis of MASLD was 0.73 (0.69-0.77) (Figure 7B). Furthermore, it was observed that the newly developed prediction model exhibited superiority in terms of accuracy when predicting the occurrence of MASLD in comparison to the utilisation of existing indicators alone (Figure 7C).
The present study makes a significant contribution to the existing literature through its systematic evaluation of the correlation between the ZJU index and MASLD among T2DM patients, and the construction of a novel predicting model for MASLD. The primary findings of this study are as follows: (1) A significant positive correlation was identified between the ZJU index and the development of non-alcoholic fatty liver disease, with the index thus being identified as playing a role in the development of MASLD; (2) The RCS results demonstrated a non-linear association between the ZJU index and MASLD, with the ZJU index of 38.87 being identified as the key critical value for the diagnosis of MASLD; and (3) In comparison with metabolic indices alone, the metabolic indices analysed by regression analysis showed that the new prediction model established had a higher diagnostic value for MASLD and demonstrated good accuracy.
As demonstrated in previous studies, the ZJU index has been shown to serve as a reliable indicator for the diagnosis and prediction of MASLD. Additionally, the ZJU index has been found to be associated with hepatic steatosis and fibrosis in patients diagnosed with MASLD[12]. The ZJU index has also been linked to a number of metabolic diseases, including sarcopenia in American adults, sleep apnoea in Chinese middle-aged and older adults, and gallbladder stones in American adults[13-15]. T2DM is a major public health concern, affecting hundreds of millions of people worldwide, and the prevalence of MASLD is particularly high in this demographic[16-19]. Consequently, the development of novel and straightforward diagnostic models that predict MASLD risk in T2DM patients appears to be of significant clinical relevance. The findings of this study suggest that the ZJU index is a promising tool for predicting MASLD in patients with T2DM.
The ZJU index is a more comprehensive indicator of insulin resistance[20,21]. A non-linear association was identified between ZJU index and MASLD by the RCS study, which also determined a critical threshold of 38.87 for the ZJU index. Subsequent analysis of variance demonstrated that patients with a ZJU value greater than 38.87 exhibited a significantly elevated risk of developing MASLD. The ROC results further demonstrated that the AUC value of the ZJU index for the diagnosis of MASLD in patients with T2DM was significantly higher than the diagnostic value of ALT, AST, TG, and FBG alone for the diagnosis of MASLD, with an AUC value of 0.7. In order to further enhance the diagnostic validity of MASLD, a novel predictive model was constructed by screening multiple variables through a regression model. The findings demonstrated that the AUC of this novel model reached 0.76, signifying its diagnostic validity. The analysis revealed that alcohol consumption, ZJU index, WBC, LDL-C and UA were all identified as adverse influences. Conversely, age emerged as a protective factor, which may be associated with a decrease in BMI and a greater focus on dietary control and weight management in the elderly, contributing to the observed protective effect of CAD. With regard to lipids, TG was not included in the new model as it is a key variable in the calculation of the ZJU index. HDL-C appears to have a greater effect on MASLD than other lipid indices, therefore contributing to the lower scores for TC. The DCA curves and the calibration curves indicate the reliability of the model. Consequently, it can be concluded that the newly developed model, which incorporates alcohol consumption, age, ZJU index, WBC, TC, HDL-C, LDL-C, UA, and BUN, possesses a high degree of clinical applicability in predicting the development of MASLD in patients with T2DM. This model can be utilised as a reliable instrument for clinical diagnosis and therapeutic intervention. The ZJU index is a score for typical MASLD that adequately reflects insulin resistance. However, it should be noted that diseases such as metabolic syndrome and polycystic ovary syndrome have also been associated with prediabetes and insulin resistance. The combined effect of these diseases has not been considered in this study, and it is one of the directions for further research in the future.
The present study is not without its limitations. Firstly, patients with T2DM were not subjected to liver biopsies, which precluded the determination of the extent of liver fibrosis. Secondly, the study’s design did not permit the exploration of a causal link among the ZJU index and MASLD; furthermore, patients included in the study were predominantly inpatients, many of whom exhibited multiple complications, thus introducing a risk of overestimation of the MASLD prevalence. Thirdly, this study did not take into consideration the medication use of the T2DM patients, which could have influenced the results. Finally, this study failed to consider the impact that diet and exercise routines, along with insulin levels, might possibly have had on the outcomes.
The findings of this study demonstrated that an elevated ZJU index was associated with an increased risk of MASLD in patients with T2DM. The risk of MASLD increased significantly when the ZJU index exceeded 38.87. The novel model developed in this study, which is based on the ZJU index, has been shown to have a satisfactory predictive value for the risk of developing MASLD in patients with T2DM. Notably, the new low-cost model demonstrates a high level of accuracy, suggesting its potential for wide application in clinical practice and the enhancement of health management for patients with T2DM.
We sincerely thank every patient who participated in this study.
| 1. | Shen J, Xie E, Shen S, Song Z, Li X, Wang F, Min J. Essentiality of SLC7A11-mediated nonessential amino acids in MASLD. Sci Bull (Beijing). 2024;69:3700-3716. [RCA] [PubMed] [DOI] [Full Text] [Cited by in RCA: 18] [Reference Citation Analysis (0)] |
| 2. | Li Y, Yang P, Ye J, Xu Q, Wu J, Wang Y. Updated mechanisms of MASLD pathogenesis. Lipids Health Dis. 2024;23:117. [RCA] [PubMed] [DOI] [Full Text] [Full Text (PDF)] [Cited by in RCA: 136] [Reference Citation Analysis (0)] |
| 3. | De A, Bhagat N, Mehta M, Taneja S, Duseja A. Metabolic dysfunction-associated steatotic liver disease (MASLD) definition is better than MAFLD criteria for lean patients with NAFLD. J Hepatol. 2024;80:e61-e62. [RCA] [PubMed] [DOI] [Full Text] [Cited by in Crossref: 32] [Cited by in RCA: 94] [Article Influence: 47.0] [Reference Citation Analysis (0)] |
| 4. | Nabi O, Lapidus N, Boursier J, de Ledinghen V, Petit JM, Kab S, Renuy A, Zins M, Lacombe K, Serfaty L. Lean individuals with NAFLD have more severe liver disease and poorer clinical outcomes (NASH-CO Study). Hepatology. 2023;78:272-283. [RCA] [PubMed] [DOI] [Full Text] [Cited by in Crossref: 7] [Cited by in RCA: 81] [Article Influence: 27.0] [Reference Citation Analysis (0)] |
| 5. | Targher G, Corey KE, Byrne CD, Roden M. The complex link between NAFLD and type 2 diabetes mellitus - mechanisms and treatments. Nat Rev Gastroenterol Hepatol. 2021;18:599-612. [RCA] [PubMed] [DOI] [Full Text] [Cited by in Crossref: 160] [Cited by in RCA: 584] [Article Influence: 116.8] [Reference Citation Analysis (0)] |
| 6. | En Li Cho E, Ang CZ, Quek J, Fu CE, Lim LKE, Heng ZEQ, Tan DJH, Lim WH, Yong JN, Zeng R, Chee D, Nah B, Lesmana CRA, Bwa AH, Win KM, Faulkner C, Aboona MB, Lim MC, Syn N, Kulkarni AV, Suzuki H, Takahashi H, Tamaki N, Wijarnpreecha K, Huang DQ, Muthiah M, Ng CH, Loomba R. Global prevalence of non-alcoholic fatty liver disease in type 2 diabetes mellitus: an updated systematic review and meta-analysis. Gut. 2023;72:2138-2148. [RCA] [PubMed] [DOI] [Full Text] [Cited by in Crossref: 111] [Cited by in RCA: 193] [Article Influence: 64.3] [Reference Citation Analysis (0)] |
| 7. | Ji B, Qu H, Wang H, Wei H, Deng H. The ZJU index: a useful indicator for recognizing insulin resistance in the Chinese general population. Acta Diabetol. 2016;53:817-823. [RCA] [PubMed] [DOI] [Full Text] [Cited by in Crossref: 4] [Cited by in RCA: 24] [Article Influence: 2.4] [Reference Citation Analysis (0)] |
| 8. | Wang J, Xu C, Xun Y, Lu Z, Shi J, Yu C, Li Y. ZJU index: a novel model for predicting nonalcoholic fatty liver disease in a Chinese population. Sci Rep. 2015;5:16494. [RCA] [PubMed] [DOI] [Full Text] [Full Text (PDF)] [Cited by in Crossref: 93] [Cited by in RCA: 129] [Article Influence: 11.7] [Reference Citation Analysis (0)] |
| 9. | Li L, You W, Ren W. The ZJU index is a powerful index for identifying NAFLD in the general Chinese population. Acta Diabetol. 2017;54:905-911. [RCA] [PubMed] [DOI] [Full Text] [Cited by in Crossref: 15] [Cited by in RCA: 35] [Article Influence: 3.9] [Reference Citation Analysis (0)] |
| 10. | Fu CP, Ali H, Rachakonda VP, Oczypok EA, DeLany JP, Kershaw EE. The ZJU index is a powerful surrogate marker for NAFLD in severely obese North American women. PLoS One. 2019;14:e0224942. [RCA] [PubMed] [DOI] [Full Text] [Full Text (PDF)] [Cited by in Crossref: 9] [Cited by in RCA: 32] [Article Influence: 4.6] [Reference Citation Analysis (0)] |
| 11. | Fan JG, Jia JD, Li YM, Wang BY, Lu LG, Shi JP, Chan LY; Chinese Association for the Study of Liver Disease. Guidelines for the diagnosis and management of nonalcoholic fatty liver disease: update 2010: (published in Chinese on Chinese Journal of Hepatology 2010; 18:163-166). J Dig Dis. 2011;12:38-44. [RCA] [PubMed] [DOI] [Full Text] [Cited by in Crossref: 214] [Cited by in RCA: 232] [Article Influence: 15.5] [Reference Citation Analysis (0)] |
| 12. | Luo S, Weng X, Xu J, Lin H. Correlation between ZJU index and hepatic steatosis and liver fibrosis in American adults with NAFLD. Front Med (Lausanne). 2024;11:1443811. [RCA] [PubMed] [DOI] [Full Text] [Cited by in RCA: 19] [Reference Citation Analysis (0)] |
| 13. | Wang L, Nie G, Yan F, Zhou N, Zhang M, Peng W. The ZJU index is associated with the risk of obstructive sleep apnea syndrome in Chinese middle-aged and older people: a cross-sectional study. Lipids Health Dis. 2023;22:207. [RCA] [PubMed] [DOI] [Full Text] [Cited by in RCA: 13] [Reference Citation Analysis (0)] |
| 14. | Hao JQ, Hu SY, Zhuang ZX, Zhang JW, Xiong MR, Wang R, Zhuang W, Wang MJ. The ZJU index is associated with the risk of sarcopenia in American adults aged 20-59: a cross-sectional study. Lipids Health Dis. 2024;23:389. [RCA] [PubMed] [DOI] [Full Text] [Cited by in RCA: 16] [Reference Citation Analysis (0)] |
| 15. | Xie Z, Chen X, Xie C, Yang Q, Lin H. Association between ZJU index and gallstones in US adult: a cross-sectional study of NHANES 2017-2020. BMC Gastroenterol. 2024;24:458. [RCA] [PubMed] [DOI] [Full Text] [Cited by in RCA: 9] [Reference Citation Analysis (0)] |
| 16. | Guo T, Yan W, Cui X, Liu N, Wei X, Sun Y, Fan K, Liu J, Zhu Y, Wang Z, Zhang Y, Chen L. Liraglutide attenuates type 2 diabetes mellitus-associated non-alcoholic fatty liver disease by activating AMPK/ACC signaling and inhibiting ferroptosis. Mol Med. 2023;29:132. [RCA] [PubMed] [DOI] [Full Text] [Full Text (PDF)] [Cited by in RCA: 56] [Reference Citation Analysis (0)] |
| 17. | Muzica CM, Sfarti C, Trifan A, Zenovia S, Cuciureanu T, Nastasa R, Huiban L, Cojocariu C, Singeap AM, Girleanu I, Chiriac S, Stanciu C. Nonalcoholic Fatty Liver Disease and Type 2 Diabetes Mellitus: A Bidirectional Relationship. Can J Gastroenterol Hepatol. 2020;2020:6638306. [RCA] [PubMed] [DOI] [Full Text] [Full Text (PDF)] [Cited by in Crossref: 60] [Cited by in RCA: 66] [Article Influence: 11.0] [Reference Citation Analysis (0)] |
| 18. | Hu C, Zhuang X, Zhang J, Wang T, Du S, Wang J, Peng X, Cao Q, Zhang M, Jiang Y. Serum Metabolomics in Patients with Coexisting NAFLD and T2DM Using Liquid Chromatography-Mass Spectrometry. Lab Med. 2022;53:360-368. [RCA] [PubMed] [DOI] [Full Text] [Cited by in RCA: 1] [Reference Citation Analysis (0)] |
| 19. | Cozzolino R, De Giulio B, Martignetti A, Forte G, Dallio M, Romeo M, Scognamiglio F, Ventriglia L, Stocchero M, Federico A. Urinary volatile Organic compounds in non-alcoholic fatty liver disease (NAFLD), type two diabetes mellitus (T2DM) and NAFLD-T2DM coexistence. Metabolomics. 2022;18:98. [RCA] [PubMed] [DOI] [Full Text] [Cited by in RCA: 4] [Reference Citation Analysis (0)] |
| 20. | Li X, Qin P, Cao L, Lou Y, Shi J, Zhao P, Wang C, Ma J, Xu S, Peng X, Chen H, Zhao D, Hu F, Zhao Y. Dose-response association of the ZJU index and fatty liver disease risk: A large cohort in China. J Gastroenterol Hepatol. 2021;36:1326-1333. [RCA] [PubMed] [DOI] [Full Text] [Cited by in Crossref: 1] [Cited by in RCA: 11] [Article Influence: 2.2] [Reference Citation Analysis (0)] |
| 21. | Wang J, Ma L, Chen S, Xu L, Miao M, Yu C, Li Y, Xu C. Risk for the development of non-alcoholic fatty liver disease: A prospective study. J Gastroenterol Hepatol. 2018;33:1518-1523. [RCA] [PubMed] [DOI] [Full Text] [Cited by in Crossref: 12] [Cited by in RCA: 13] [Article Influence: 1.6] [Reference Citation Analysis (0)] |
Open Access: This article is an open-access article that was selected by an in-house editor and fully peer-reviewed by external reviewers. It is distributed in accordance with the Creative Commons Attribution NonCommercial (CC BY-NC 4.0) license, which permits others to distribute, remix, adapt, build upon this work non-commercially, and license their derivative works on different terms, provided the original work is properly cited and the use is non-commercial. See: https://creativecommons.org/Licenses/by-nc/4.0/


