Copyright
©The Author(s) 2025.
World J Diabetes. Sep 15, 2025; 16(9): 108480
Published online Sep 15, 2025. doi: 10.4239/wjd.v16.i9.108480
Published online Sep 15, 2025. doi: 10.4239/wjd.v16.i9.108480
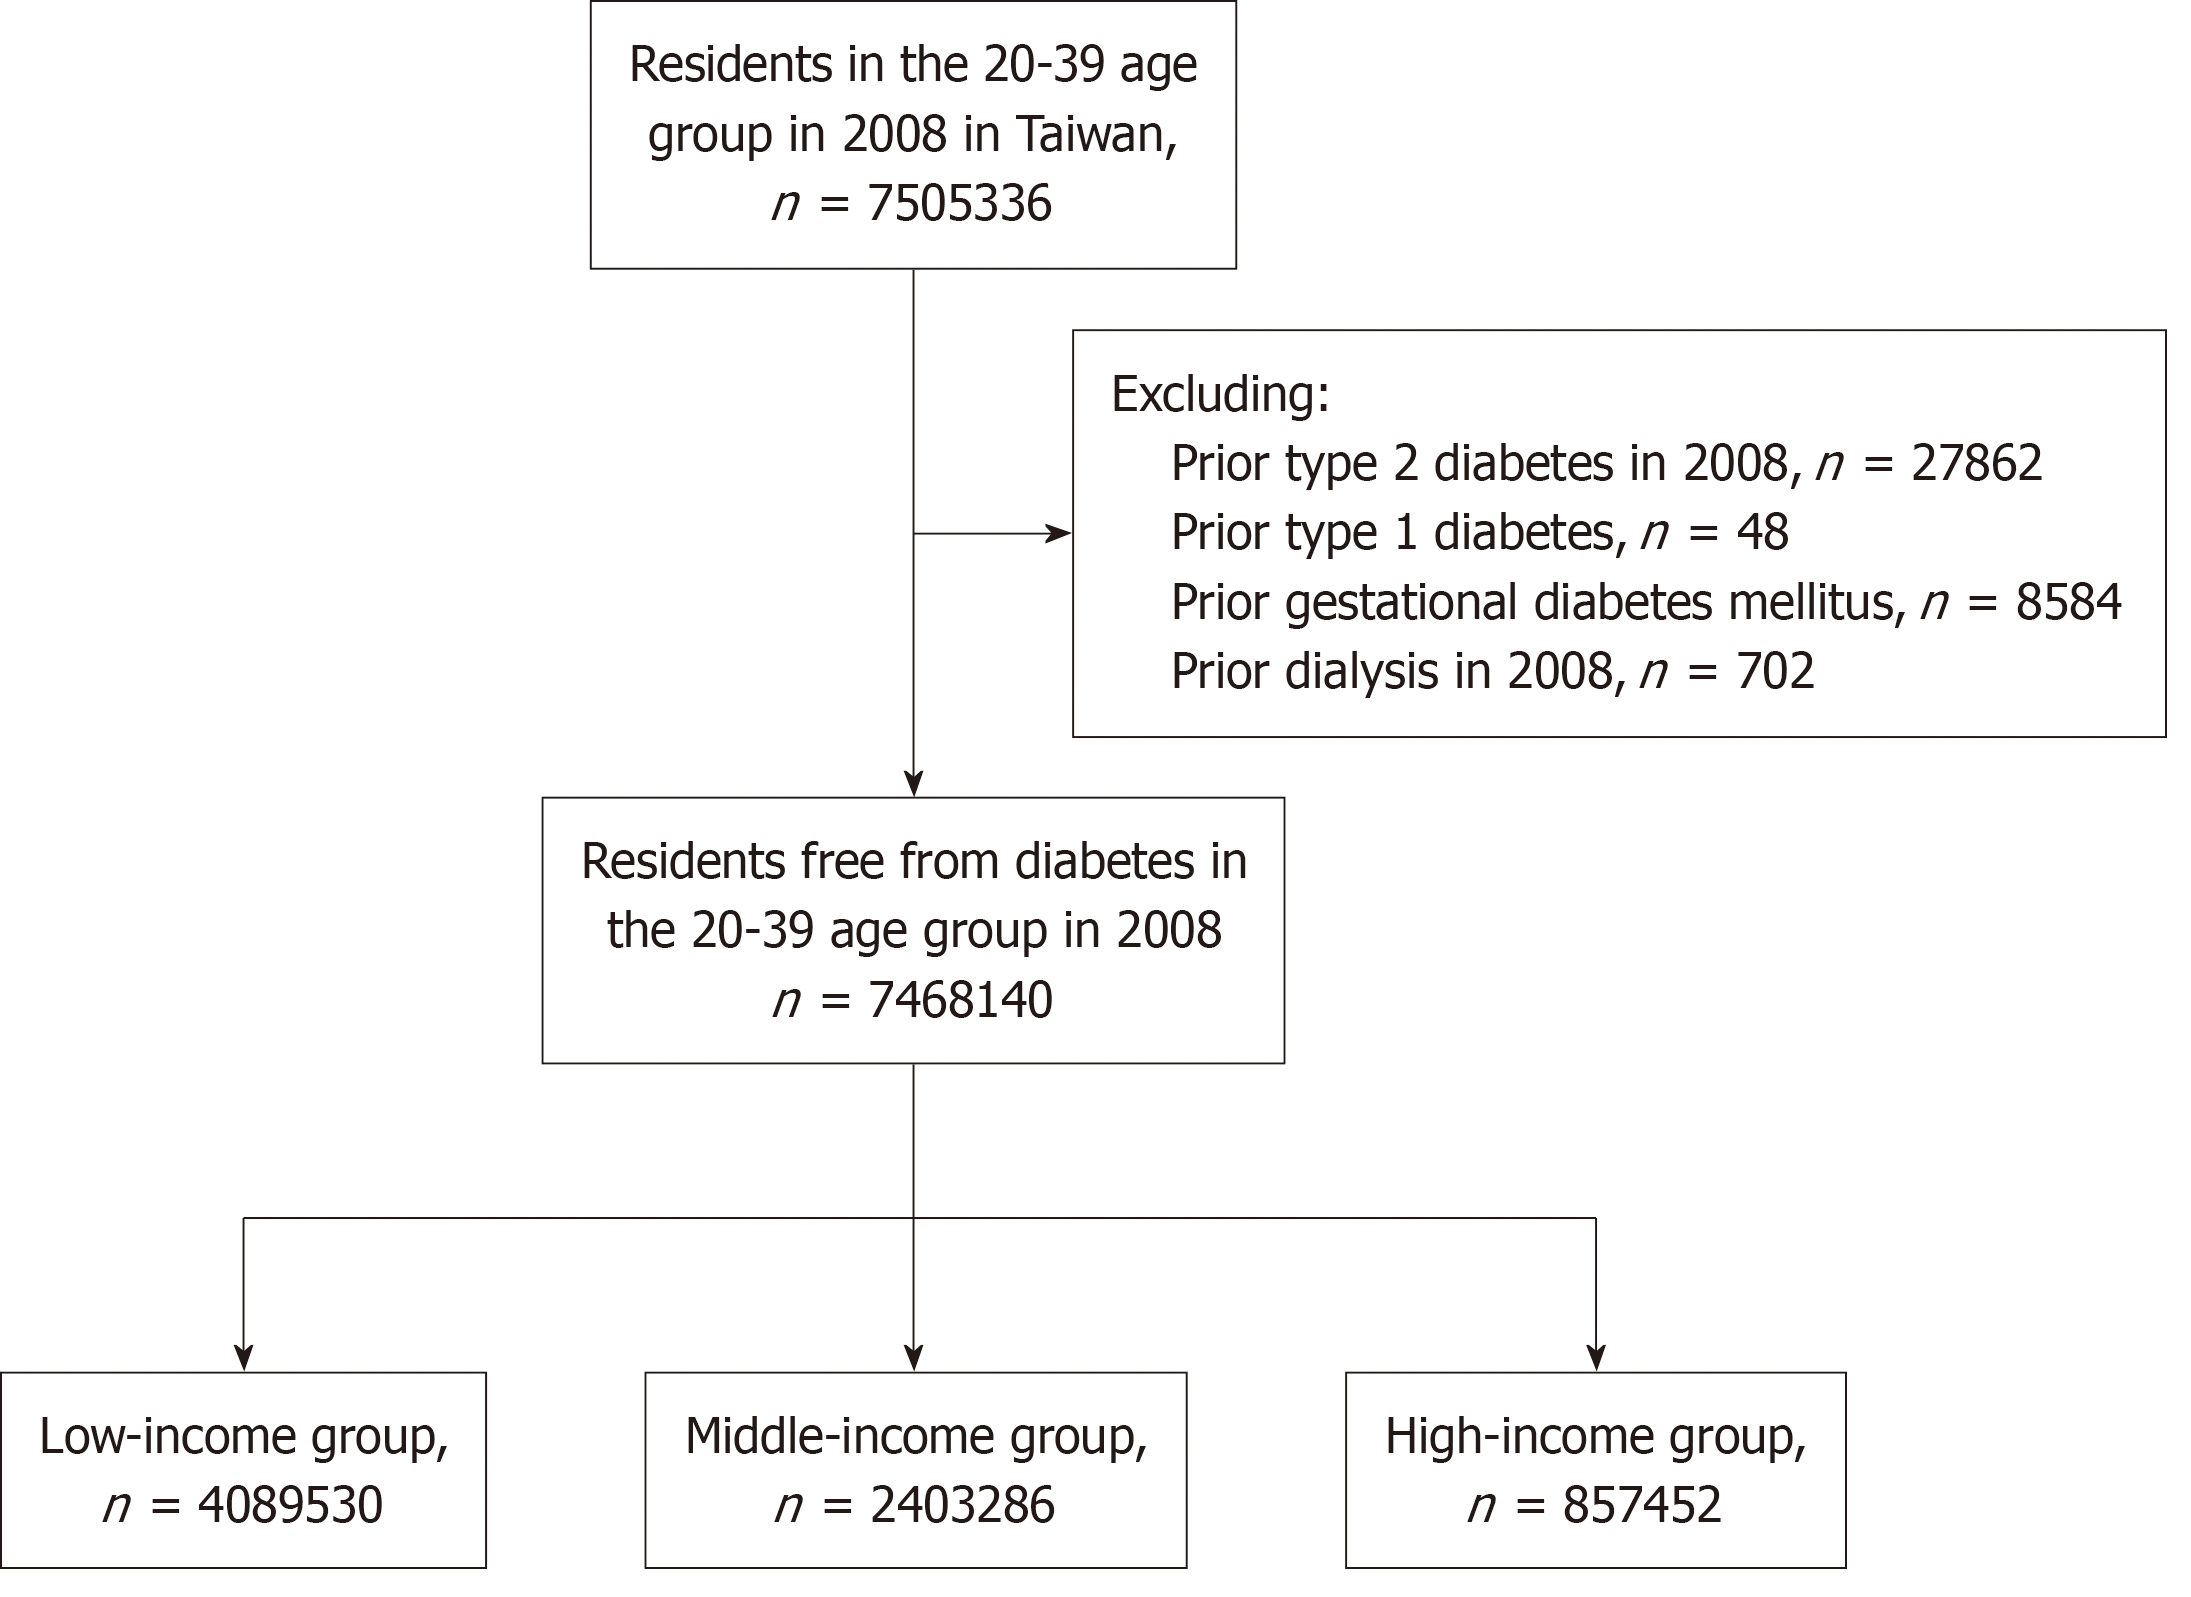
Figure 1 The case selection flowchart.
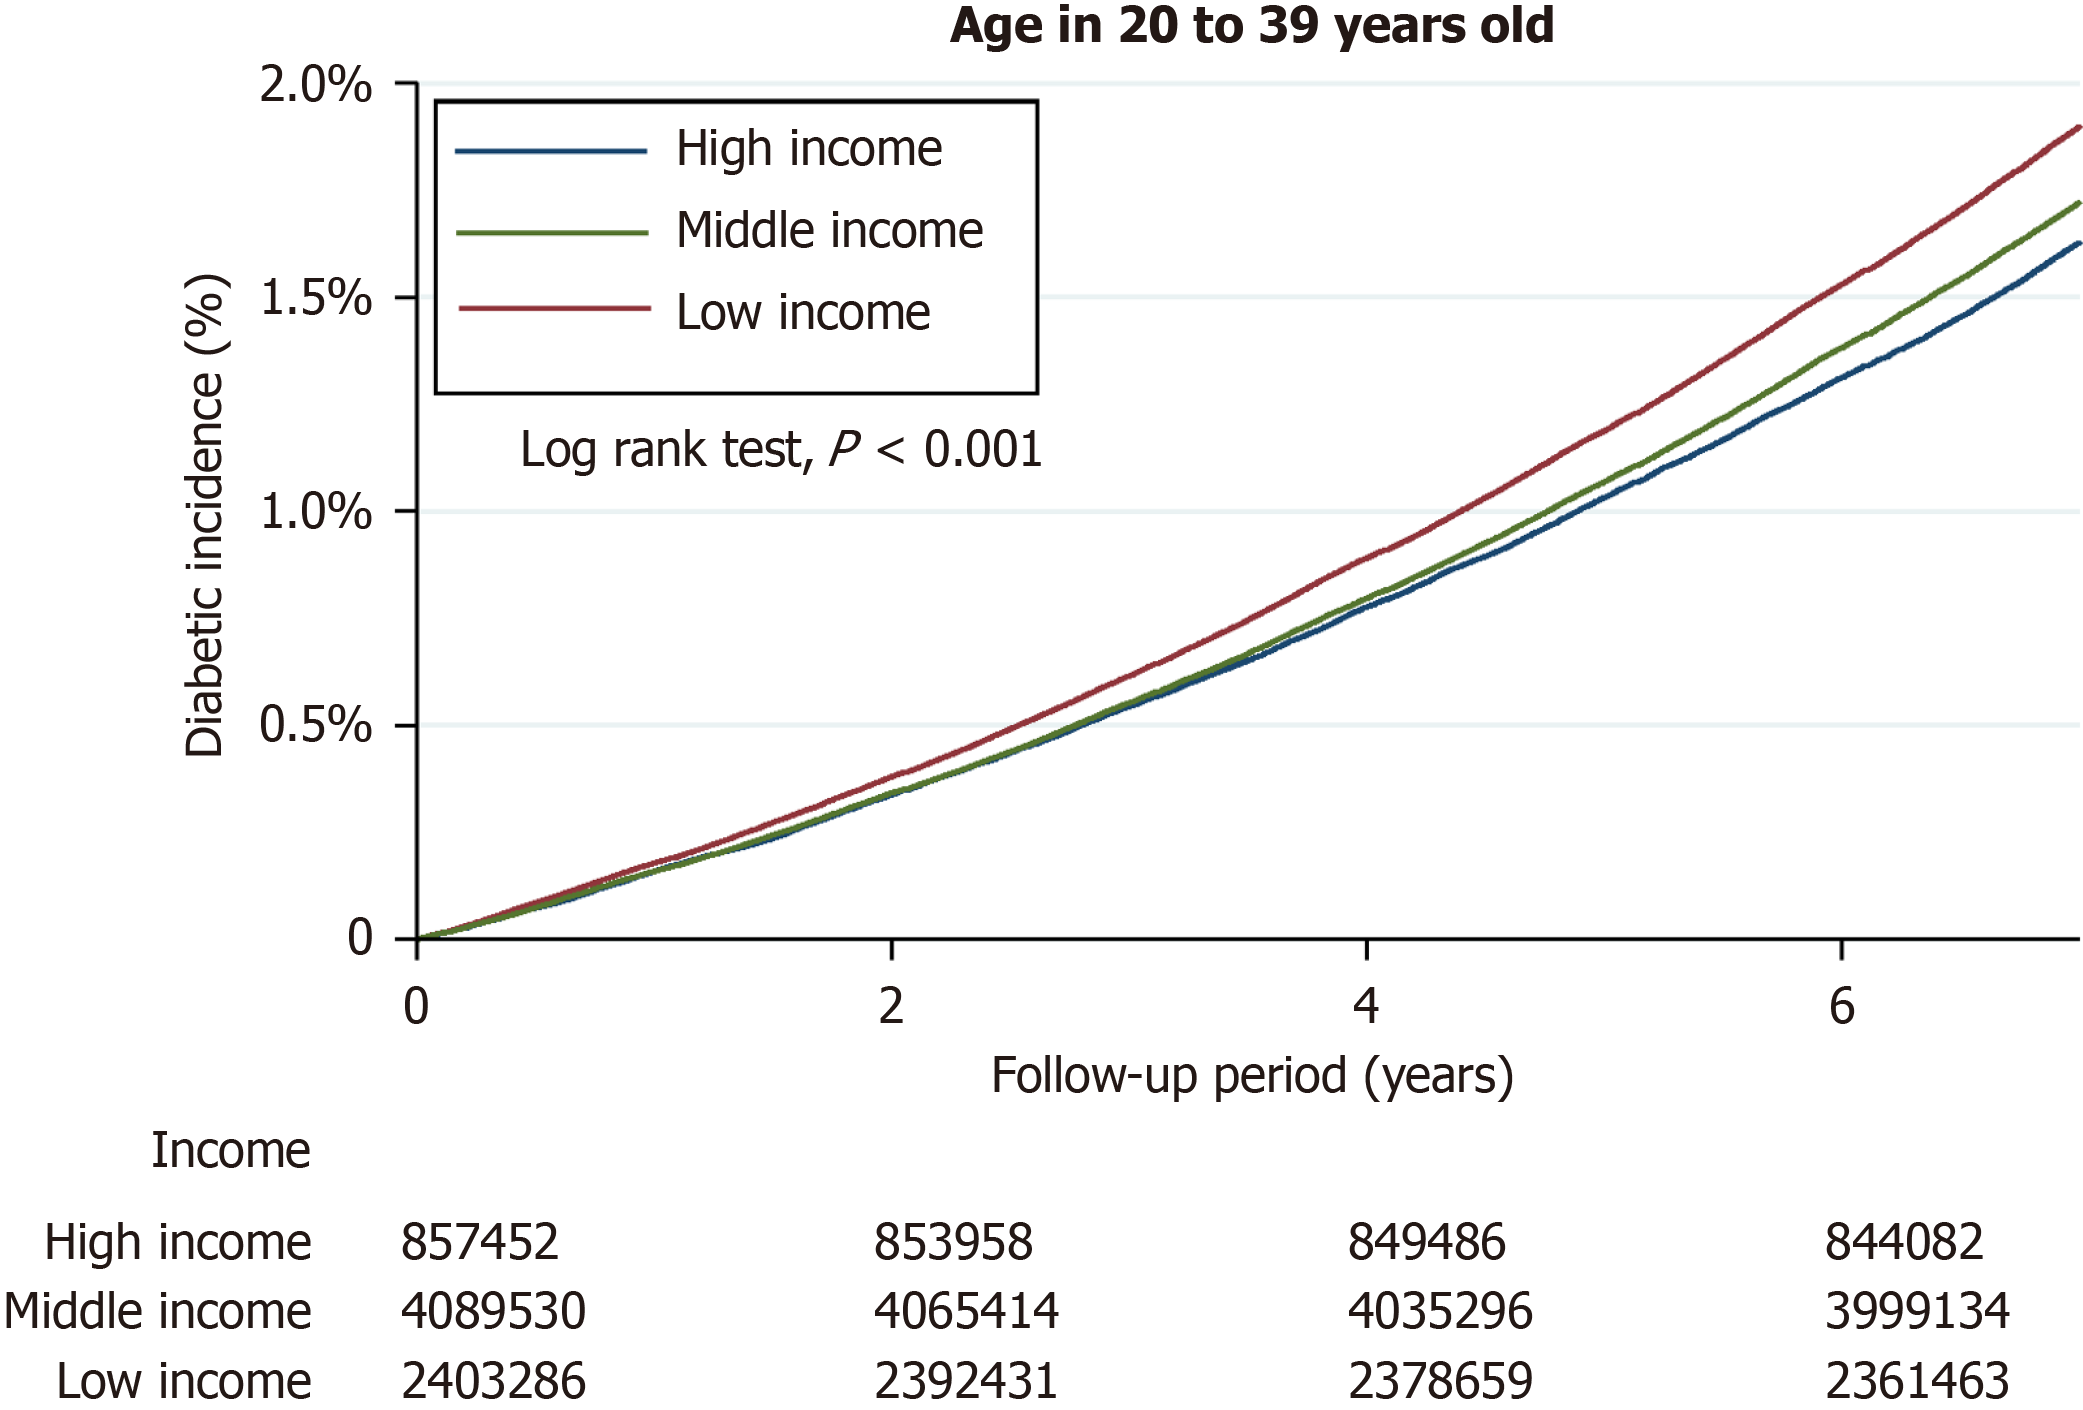
Figure 2 Kaplan-Meier curves illustrated the cumulative incidence of type 2 diabetes incidence in 20-39-year-olds.
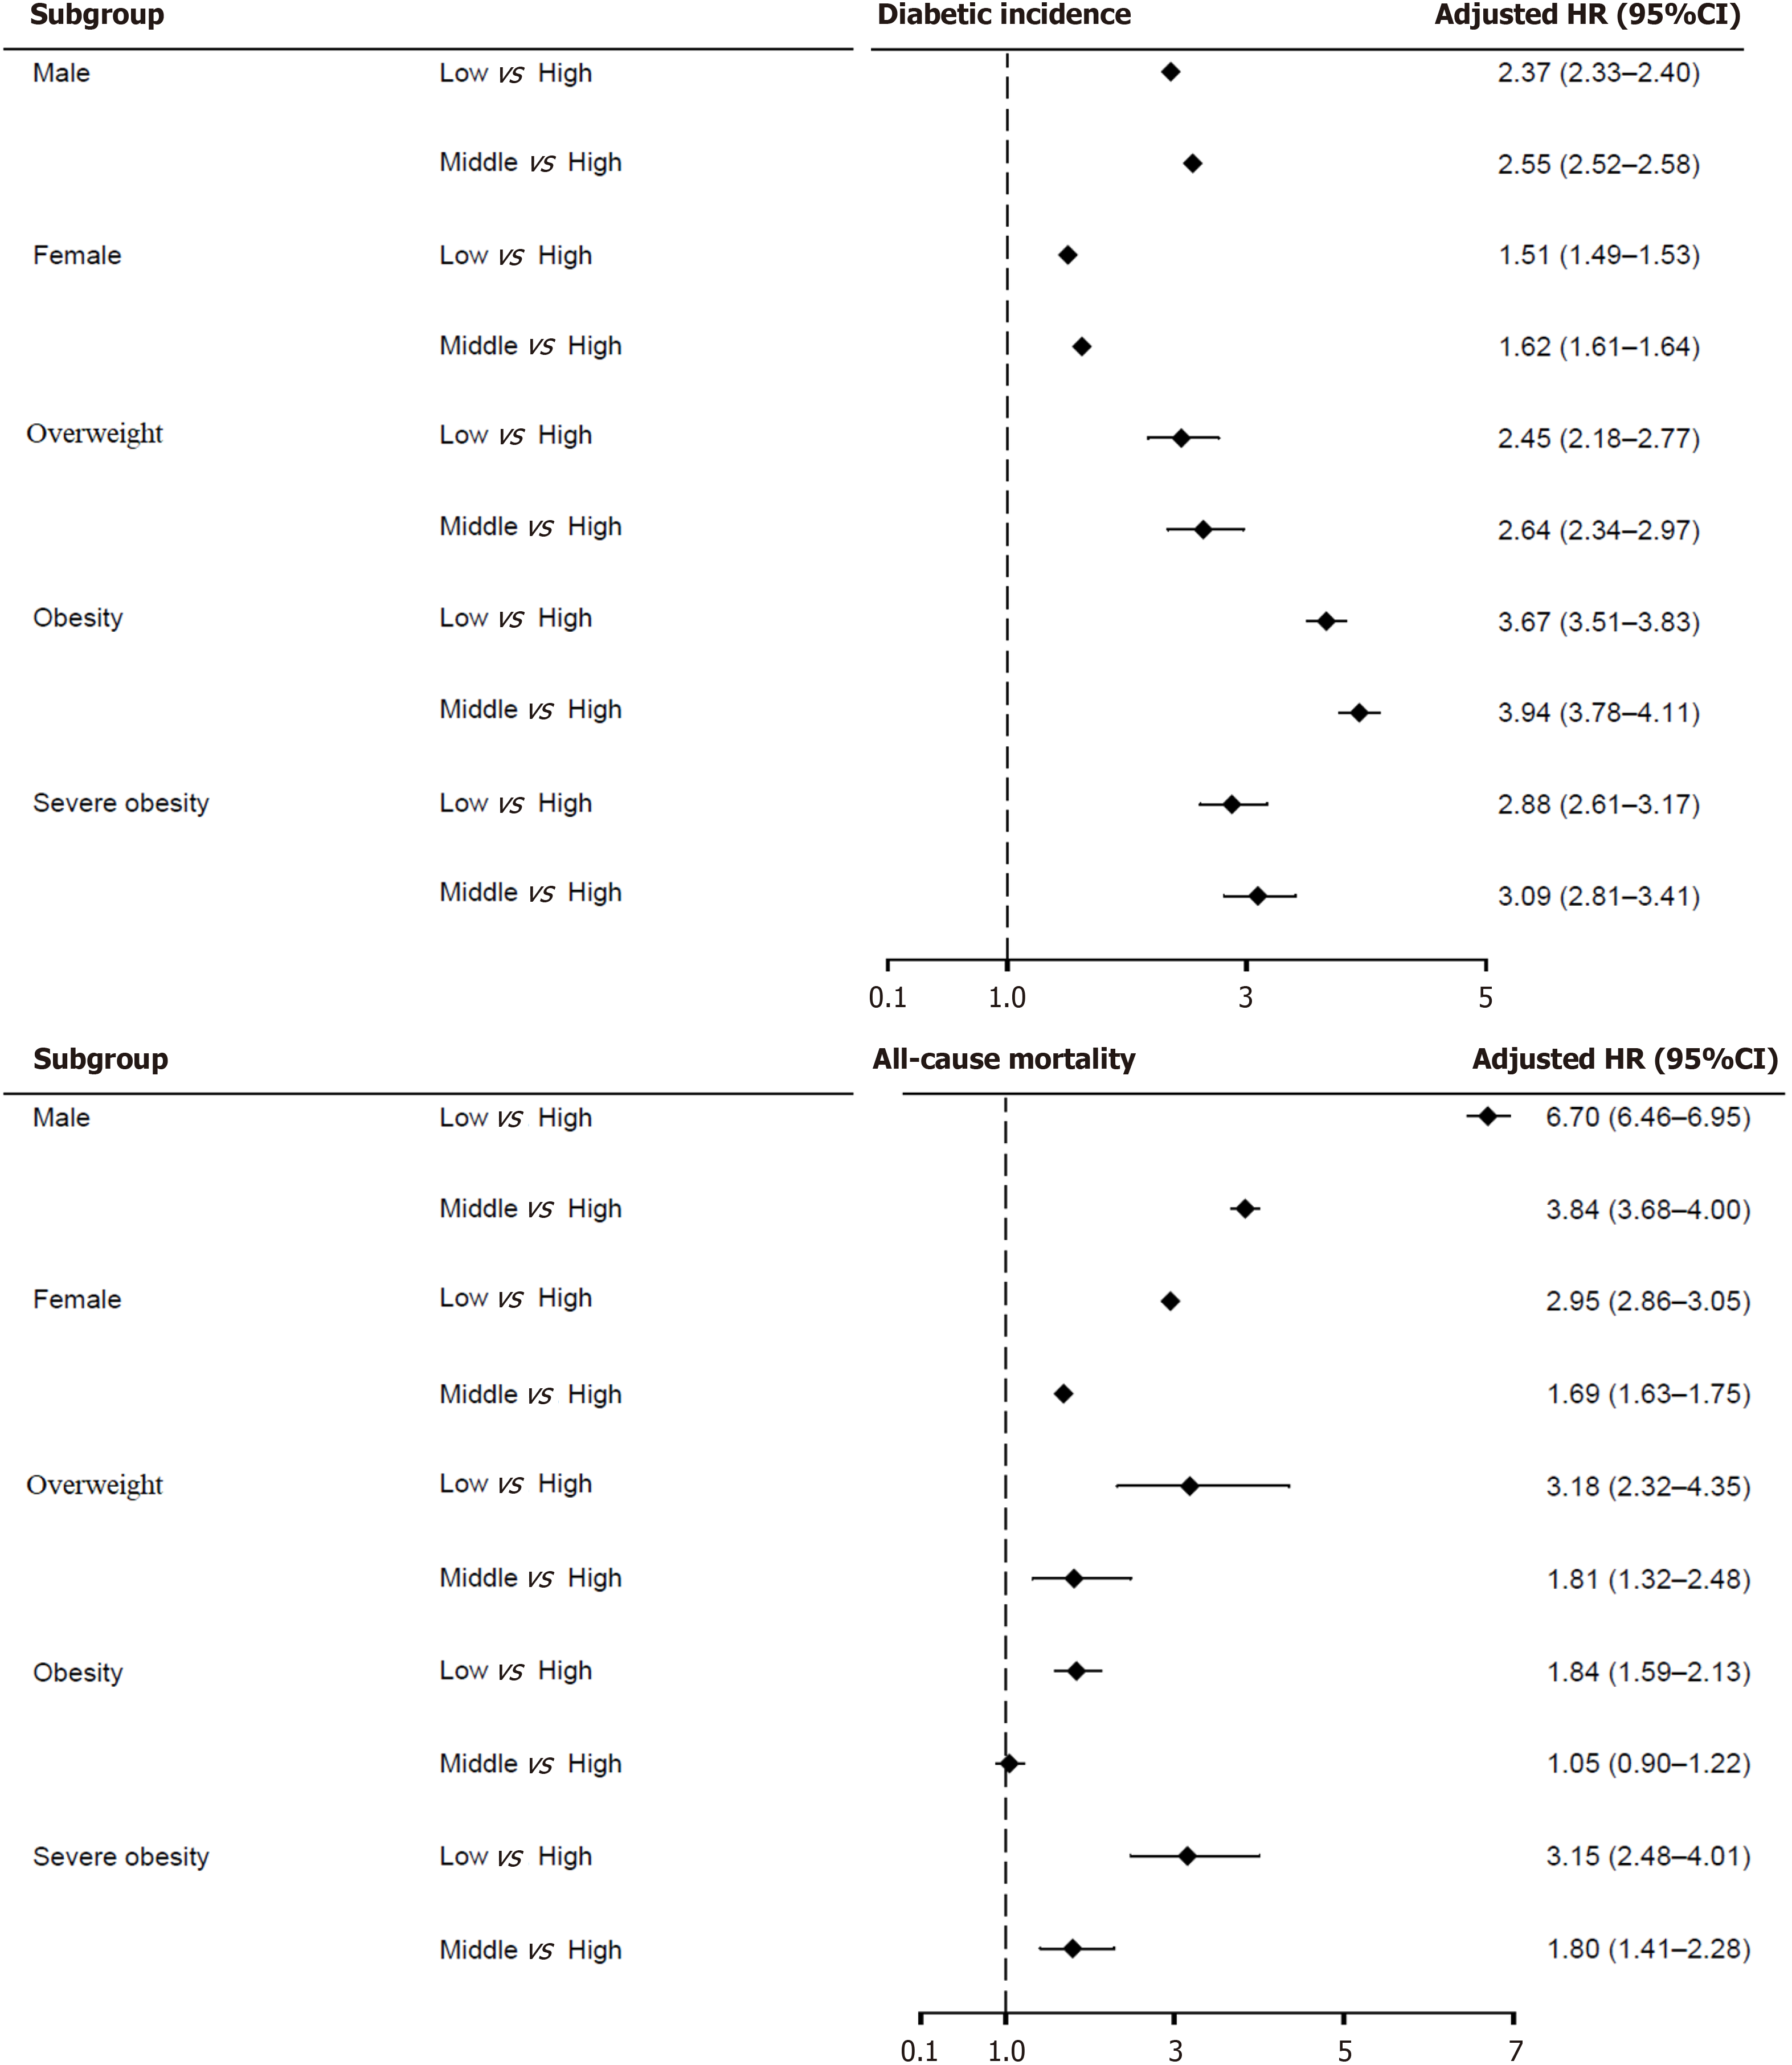
Figure 3 Forest plots illustrating the risks of diabetes and mortality by income levels, stratified by sex and obesity.
HR: Hazards ratio; CI: Confidence interval.
- Citation: Yen FS, Wei JCC, Hung YM, Liu JS, Hwu CM, Hsu CC. Income and wealth inequality is associated with young-onset type 2 diabetes. World J Diabetes 2025; 16(9): 108480
- URL: https://www.wjgnet.com/1948-9358/full/v16/i9/108480.htm
- DOI: https://dx.doi.org/10.4239/wjd.v16.i9.108480


