Copyright
©The Author(s) 2025.
World J Diabetes. Feb 15, 2025; 16(2): 101538
Published online Feb 15, 2025. doi: 10.4239/wjd.v16.i2.101538
Published online Feb 15, 2025. doi: 10.4239/wjd.v16.i2.101538
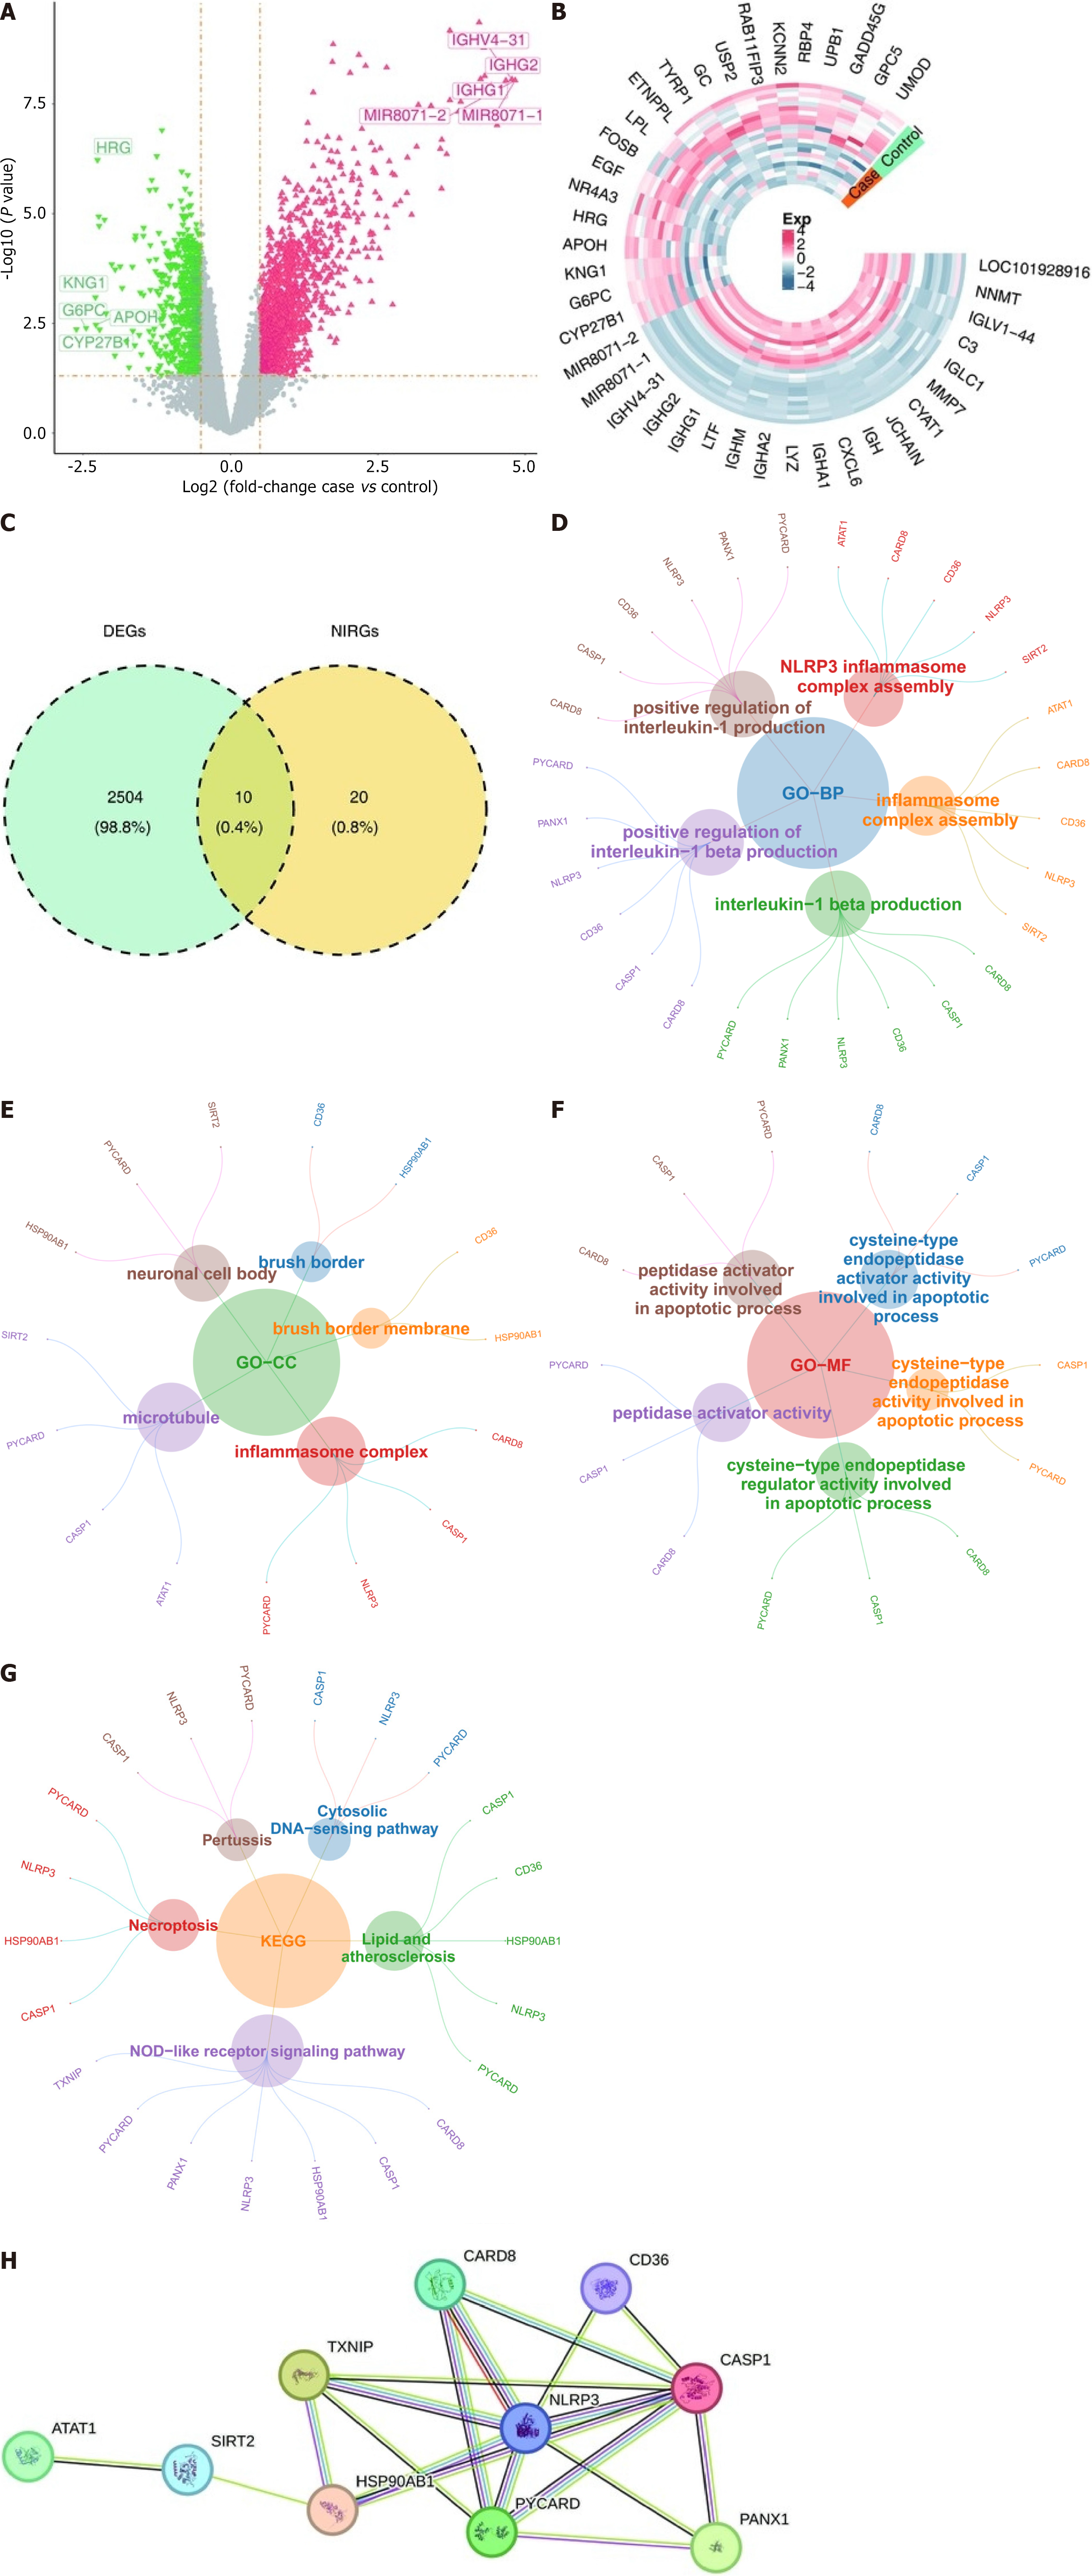
Figure 1 The 10 intersection genes were enriched in the NOD-like receptor signaling pathway.
A: Volcano plot of differentially expressed genes (DEGs); B: Heatmap of DEGs; C: Venn diagram of the intersection of DEGs and NLRP3 inflammasome-associated genes; D-F: Gene Ontology analysis of the intersection genes, including molecular function, cellular components, and biological processes; G: Significantly enriched Kyoto Encyclopedia of Genes and Genomes pathway analysis of the intersecting genes; H: Protein-protein interaction network of DEGs. DEGs: Differentially expressed genes; NLRP3: NOD-like receptor thermal protein domain associated protein 3; NIRGs: NLRP3 inflammasome-associated genes; GO: Gene Ontology; BP: Biological process; CC: Cellular component; MF: Molecular function; KEGG: Kyoto Encyclopedia of Genes and Genomes; SIRT2: Sirtuin 2; CASP1: Caspase 1.
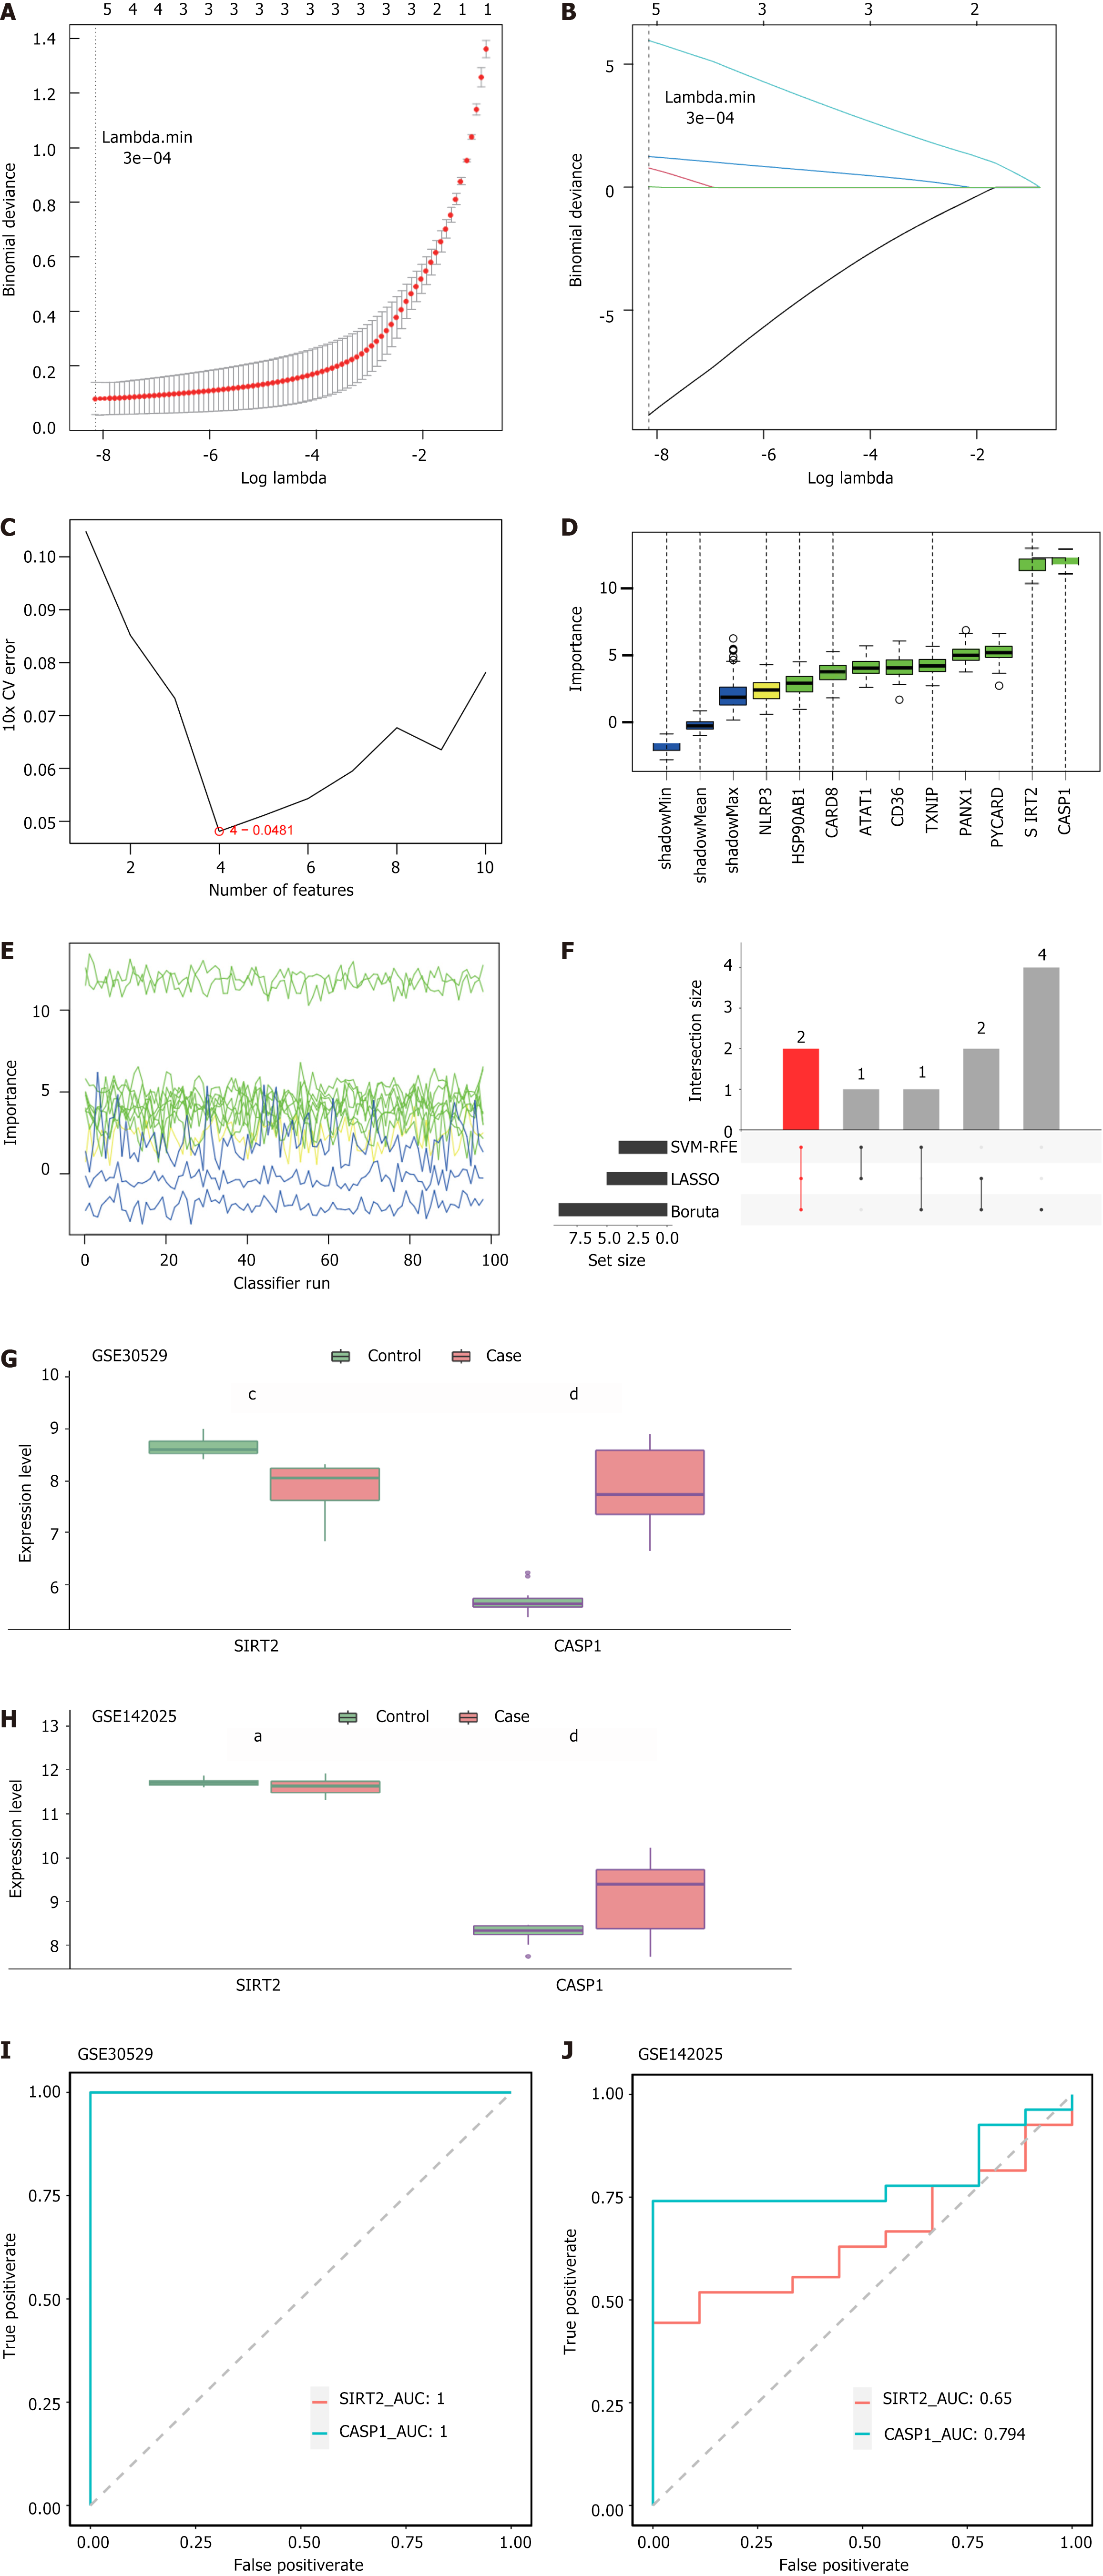
Figure 2 Sirtuin 2 and caspase 1 were considered as biomarkers.
A and B: Feature genes were selected using least absolute shrinkage and selection operator to obtain five genes; C: The process of feature gene selection using support vector machine recursive feature elimination four feature genes were identified among the differentially expressed low-risk groups; D: Plot of variation in Z-score; E: Boruta selection of nine feature genes with importance rankings; F: Overlapping genes were identified using three machine algorithms; G: Expression of sirtuin 2 (SIRT2) and caspase 1 (CASP1) in GSE30529; H: Expression of SIRT2 and CASP1 in GSE142025; I: Receiver operating characteristic curves for SIRT2 and CASP1 in GSE30529, with an area under the curve value of 1; J: Receiver operating characteristic curves of SIRT2 and CASP1 in GSE142025 with an area under the curve value of 0.65 (SIRT2) or 0794 (CASP1). aP < 0.05; cP < 0.001; dP < 0.0001. LASSO: Least absolute shrinkage and selection operator; SVM-RFE: Support vector machine recursive feature elimination; SIRT2: Sirtuin 2; CASP1: Caspase 1; AUC: Area under the curve.
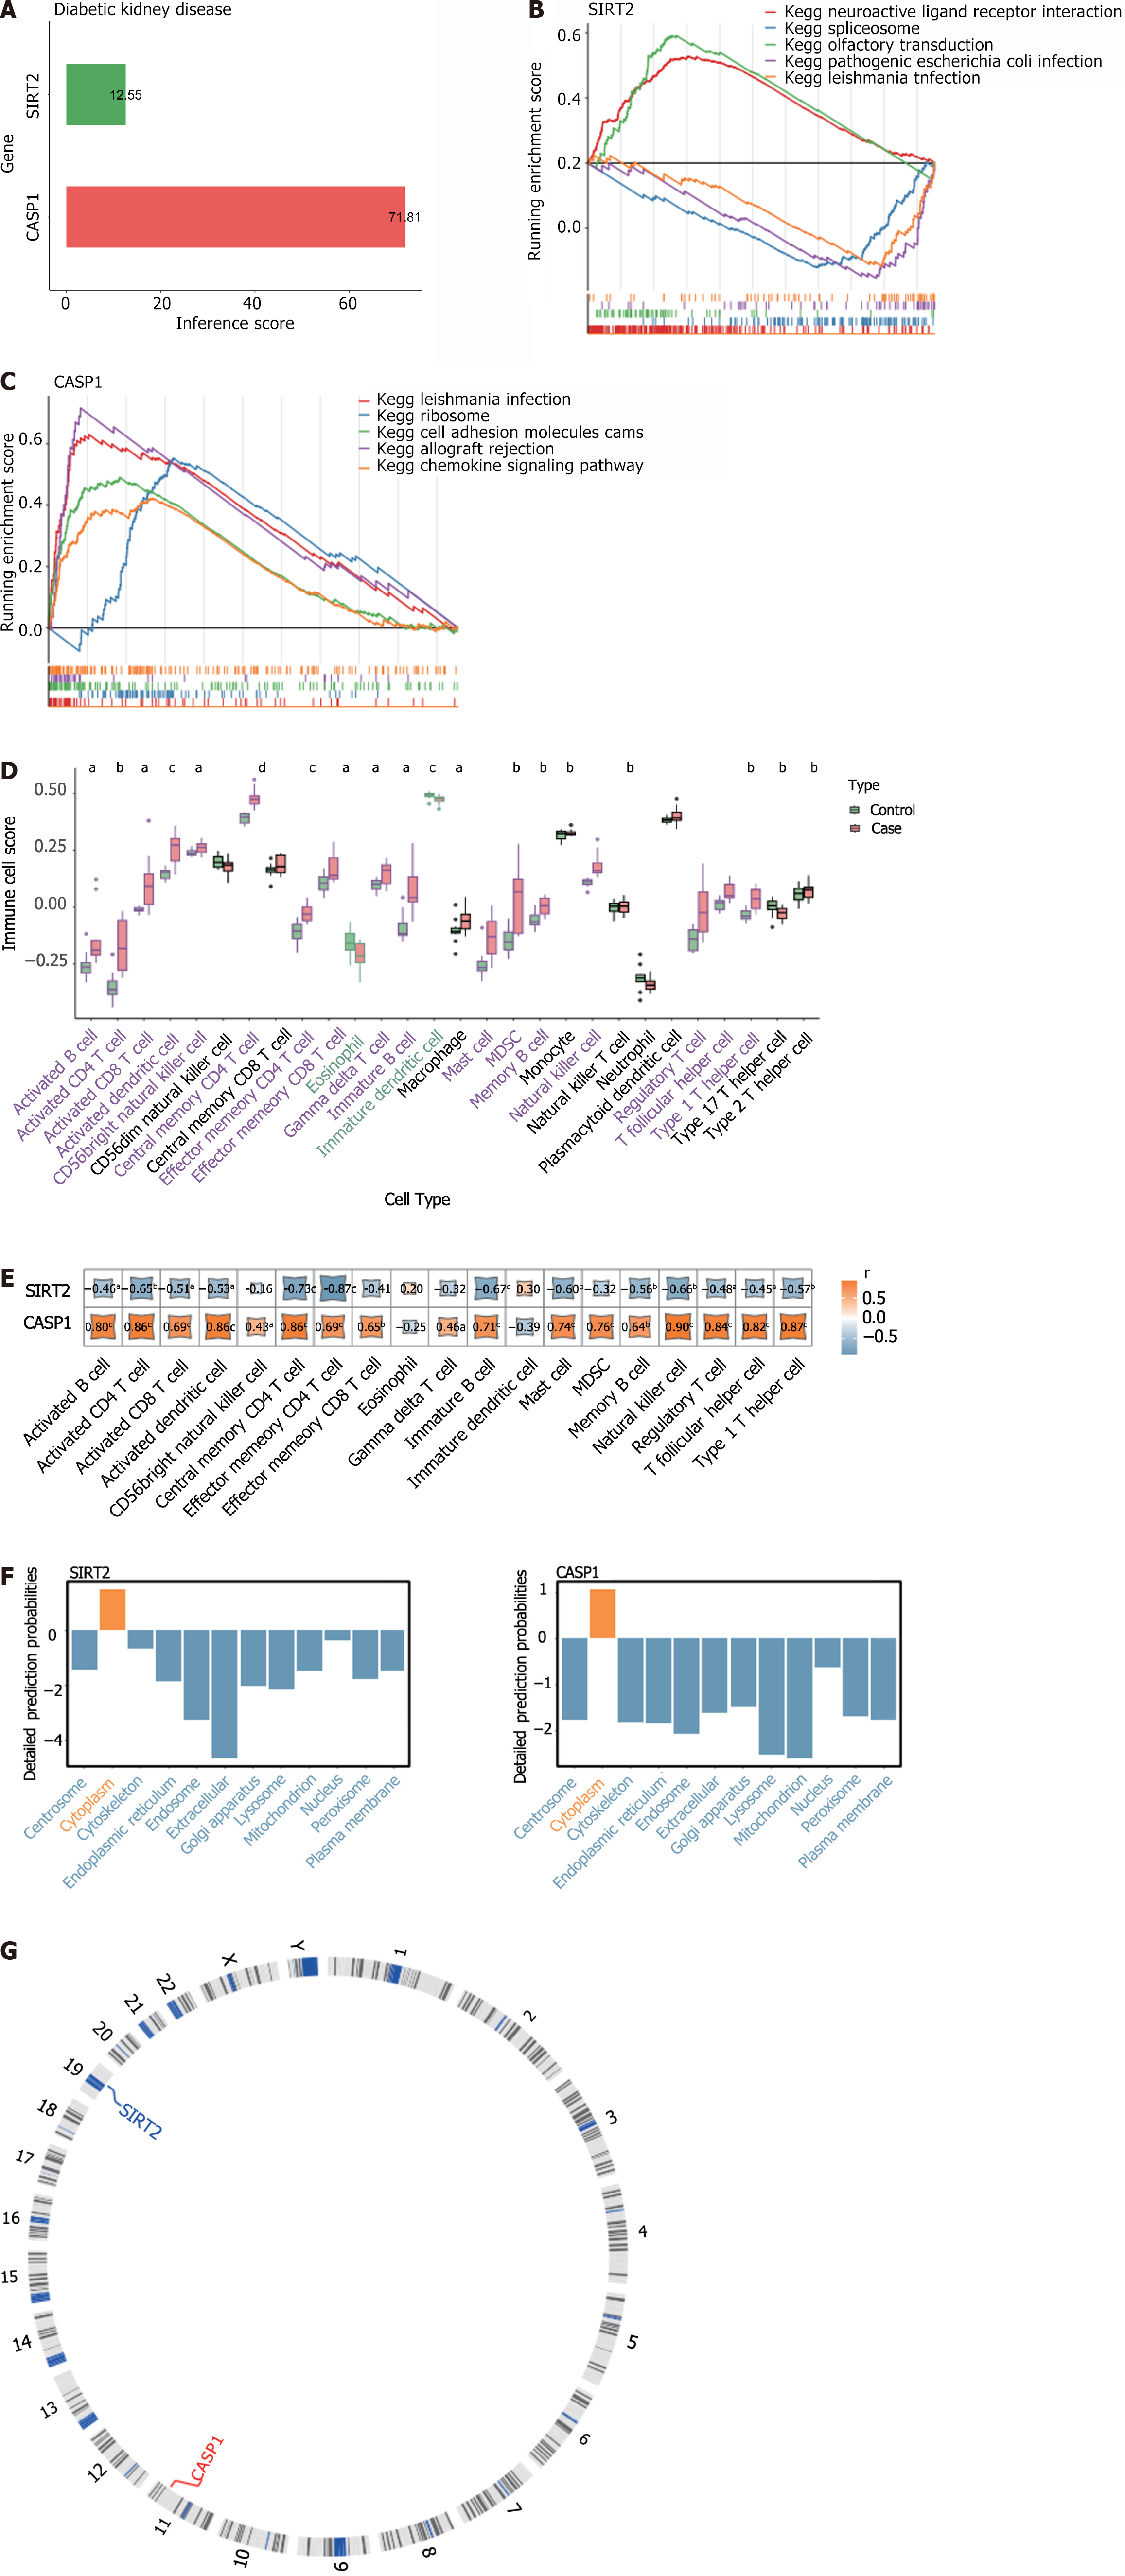
Figure 3 The relationship between biomarkers and diabetic kidney disease.
A: The relationship between biomarkers and diabetic kidney disease; B and C: Representative pathways enriched in the identified genes, as determined by gene set enrichment analysis (normal P < 0.05); D: Enrichment scores of differentially expressed immune cells between the two groups; E: Corrgrams showing the correlations between biomarkers and differential immune cells based on Pearson’s r values; F: Subcellular localization analysis of biomarkers; G: Chromosomal distribution of biomarkers. aP < 0.05; bP < 0.01; cP < 0.001; dP < 0.0001. KEGG: Kyoto Encyclopedia of Genes and Genomes; SIRT2: Sirtuin 2; CASP1: Caspase 1.
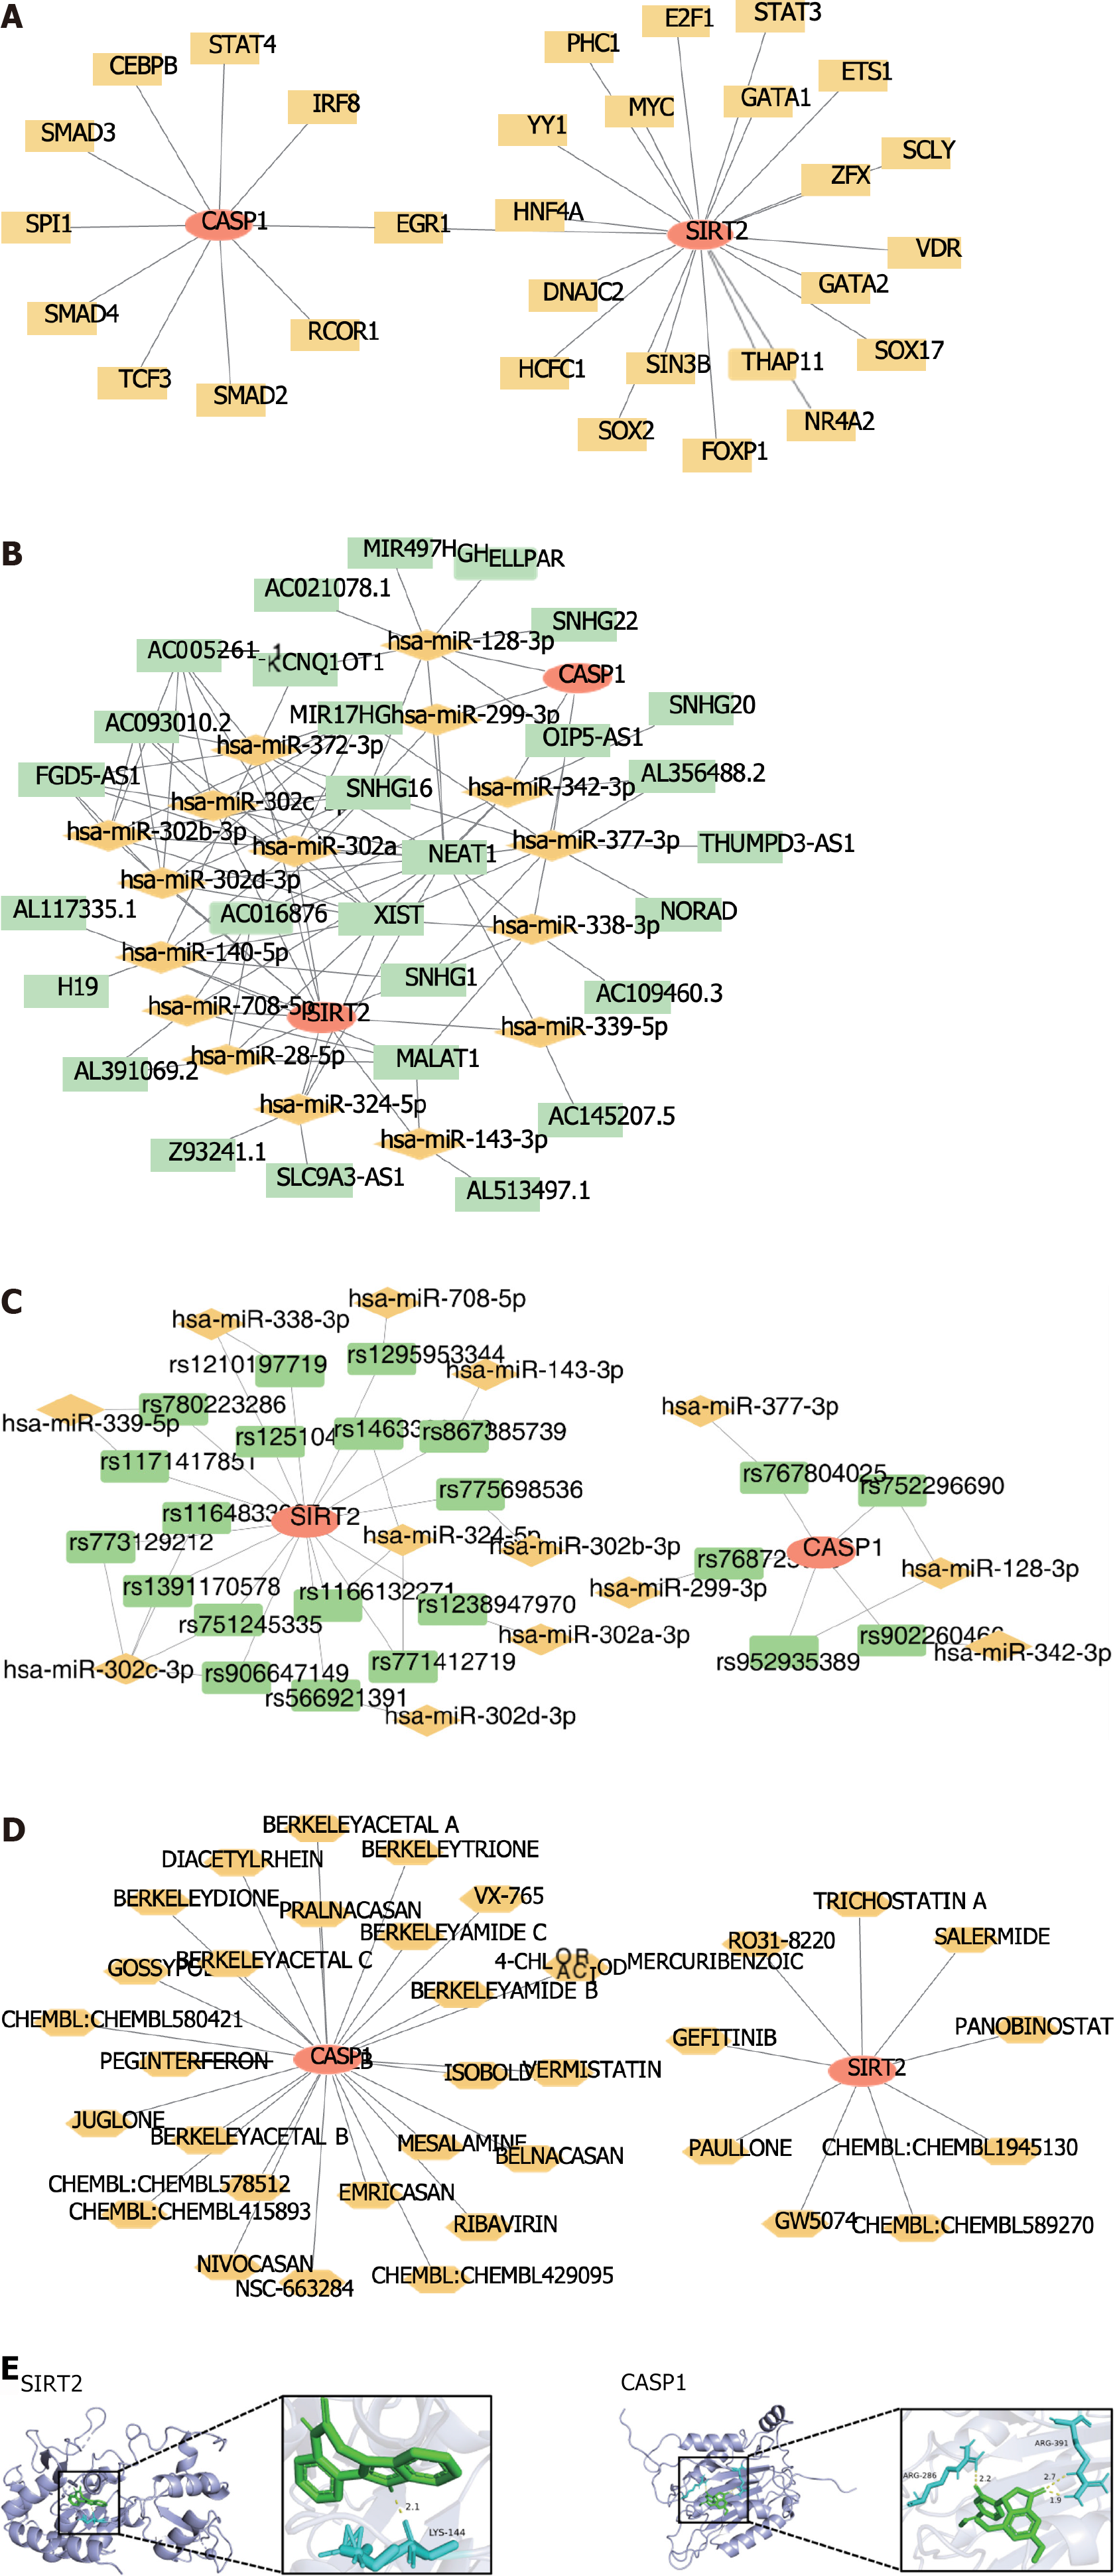
Figure 4 Prediction of drugs through biomarkers and construction of competitive endogenous RNA networks.
A: A total of 30 transcription factors were predicted by biomarkers; B: MicroRNAs-long non-coding RNAs co-regulated the competitive endogenous RNA network; C: The microRNA-single nucleotide polymorphism-biomarker network; D: A total of 35 drugs were predicted using biomarkers; E: Docking energy between the drugs and biomarkers. SIRT2: Sirtuin 2; CASP1: Caspase 1.
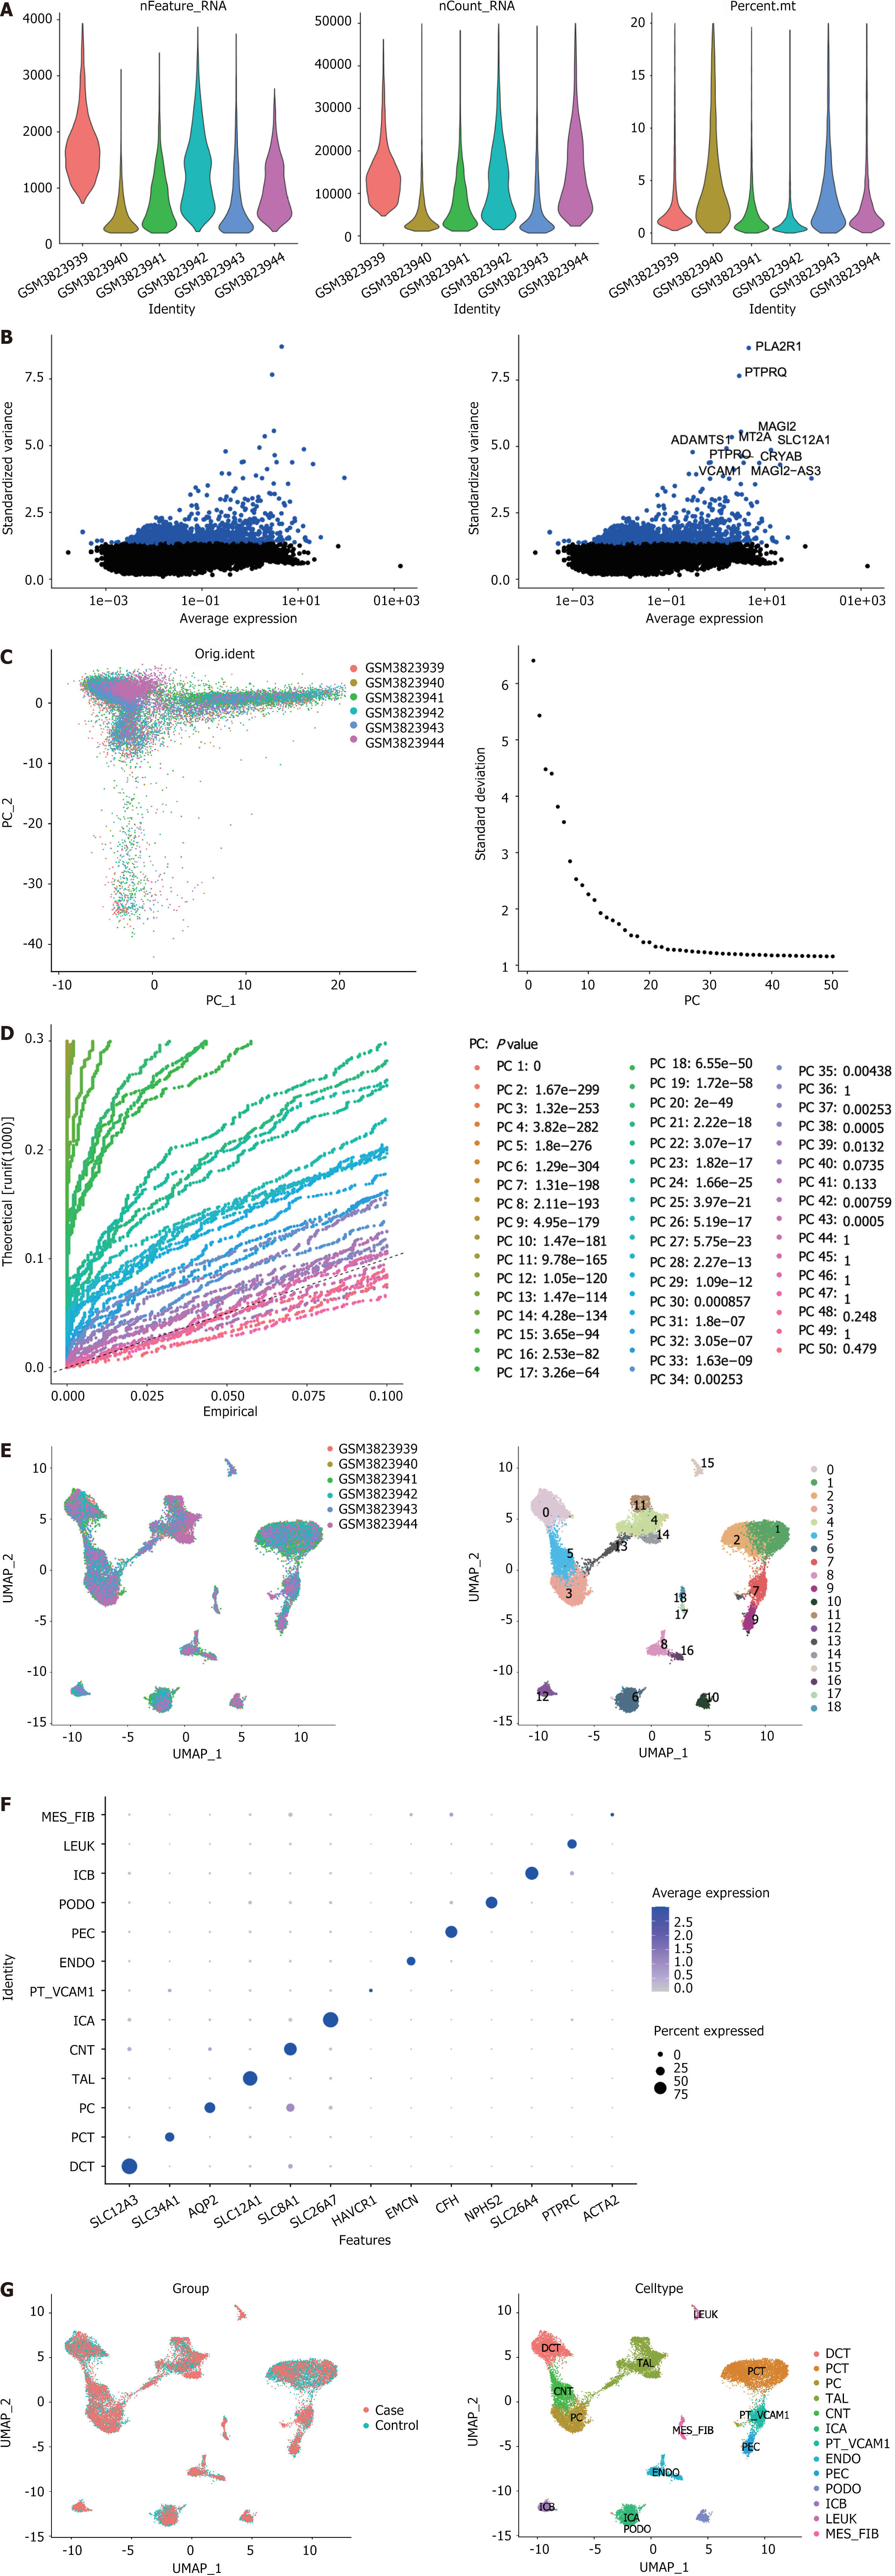
Figure 5 The 13 cells were annotated by single-cell analysis.
A: After quality control, the remaining cells and genes were identified; B: Variance diagram showing variation in gene expression in all cells. Blue dots represent highly variable genes, and black dots represent non-variable genes; C: Principal component analysis exhibited no outliers; D: Principal component analysis identified the top 30 principal components at P < 0.05; E: The uniform manifold approximation and projection algorithm was applied to the top 30 principal components for dimensionality reduction, and 19 cell clusters were successfully classified; F: Expression levels of marker genes in each cell cluster; G: All 13 cell clusters were annotated using singleR and CellMarker based on the composition of marker genes. UMAP: Uniform manifold approximation and projection; MES_FIB: Mesenchymal fibroblast; LEUK: Leukocytes; ICB: Type B intercalated cells; PODO: Podocyte; PEC: Parietal epithelial cells; ENDO: Endothelial cells; PT_VACM1: Proximal tubule with vascular cell adhesion molecule-1 expression; ICA: Type A intercalated cells; CNT: Connecting tubule; TAL: Thick ascending limb; PC: Principal cells; PCT: Proximal convoluted tubule; DCT: Distal convoluted tubule.
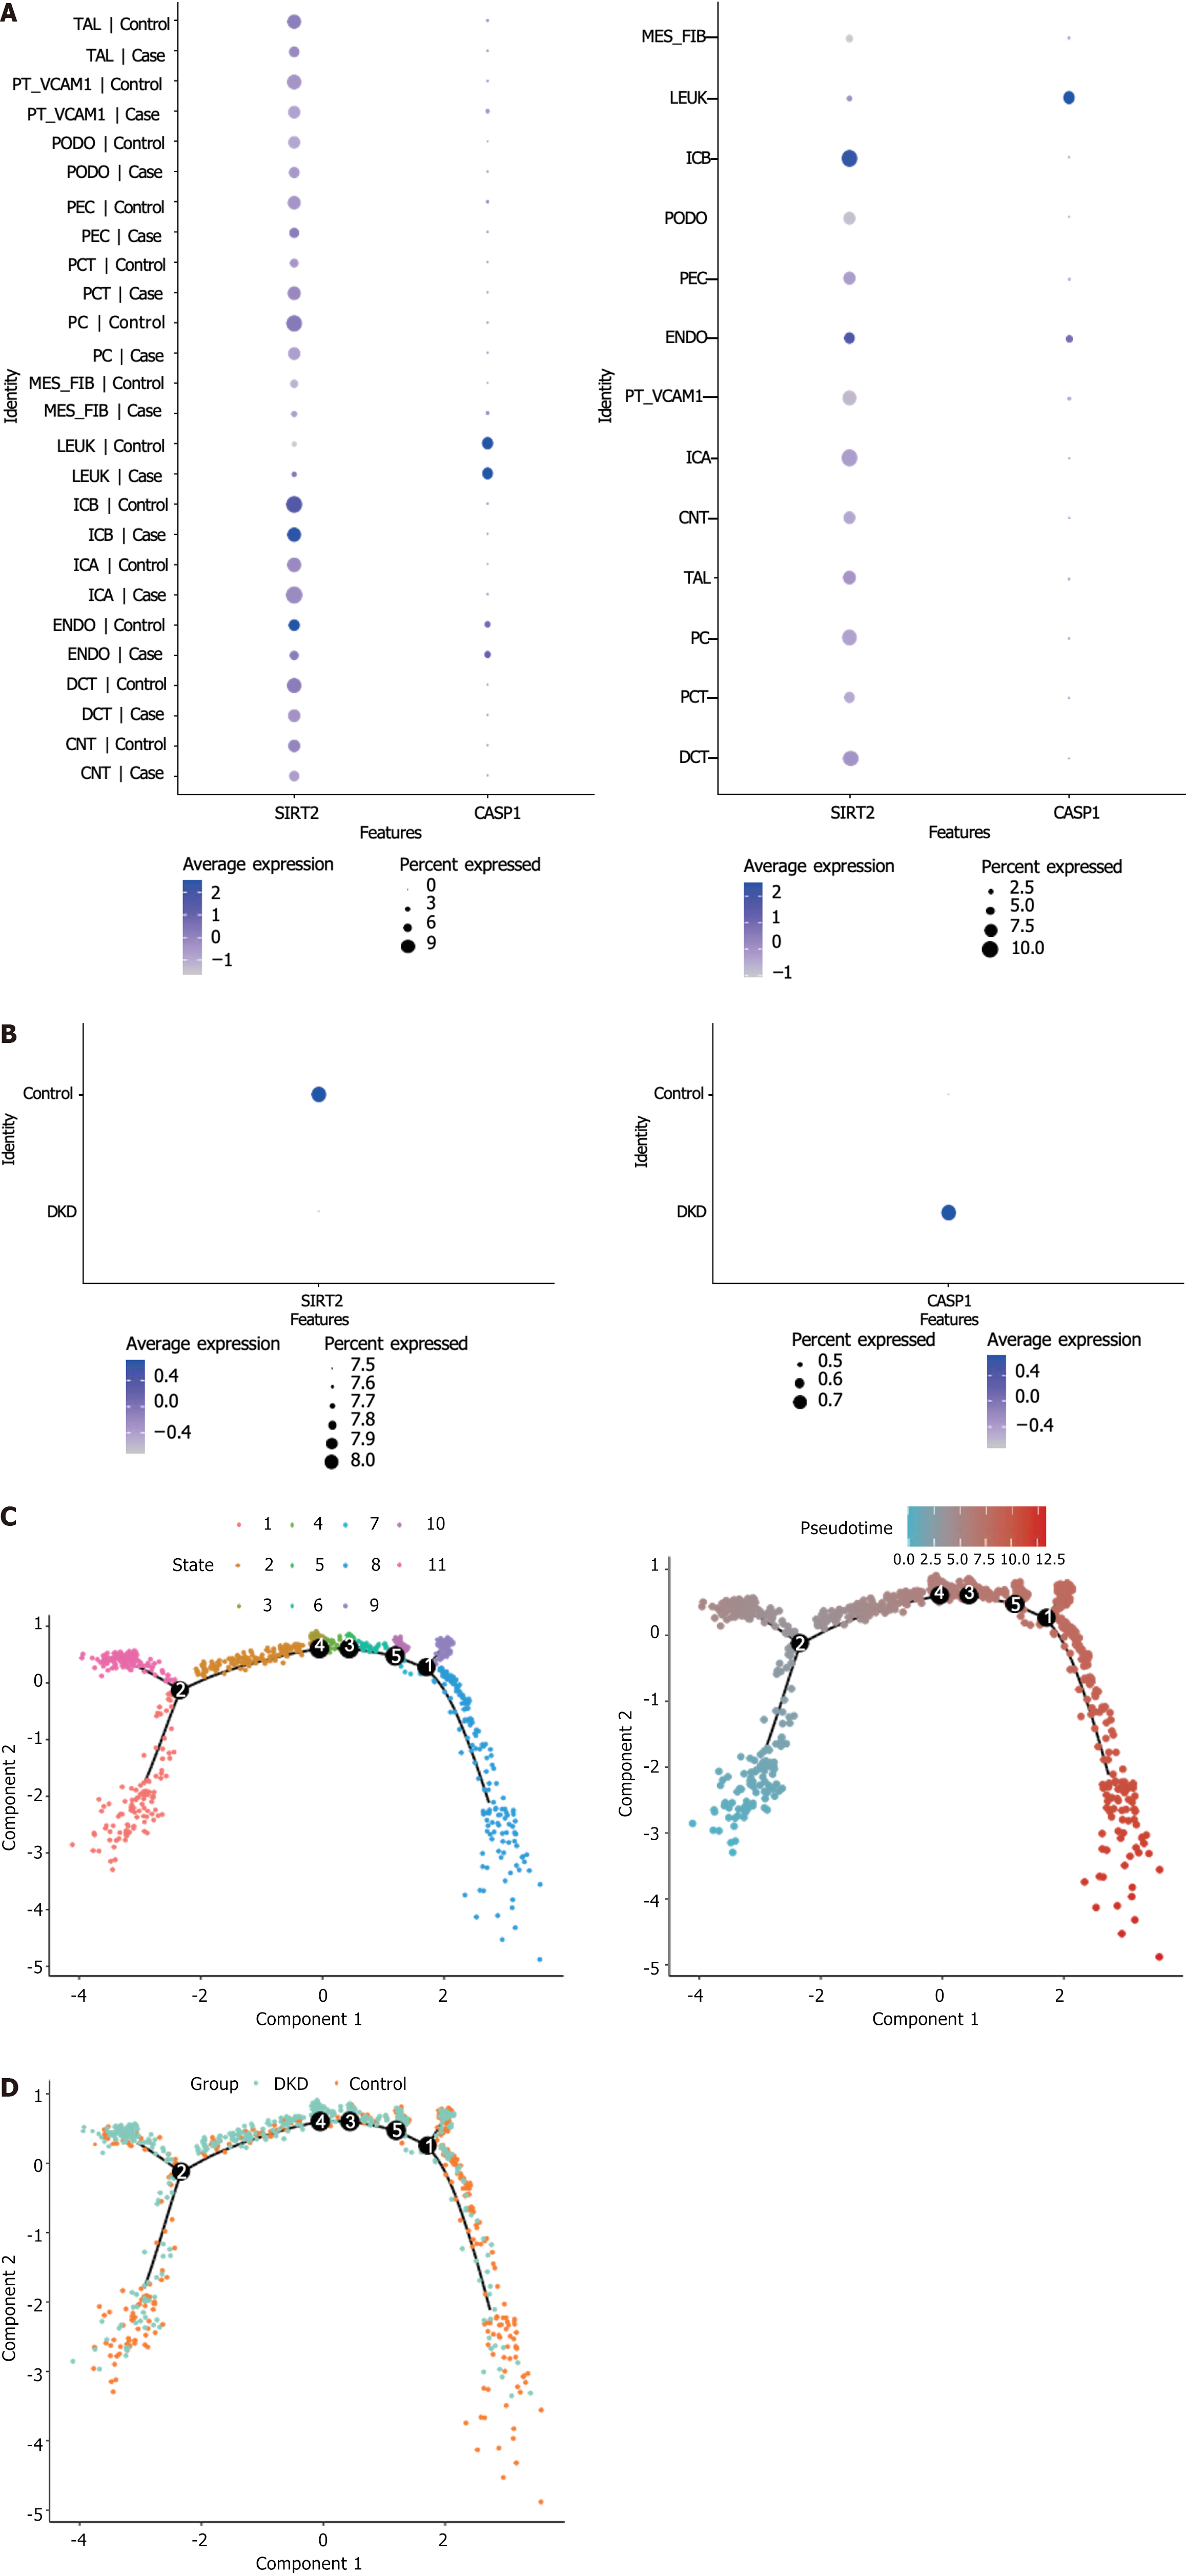
Figure 6 Diabetic kidney disease mostly occurred during the mid-differentiation stage of endothelial cells.
A: Expression levels of caspase 1 (CASP1) and sirtuin 2 (SIRT2) in each cell cluster; B: Expression of CASP1 and SIRT2 in each group; C: Pseudo-temporal analysis reveals 11 states in the differentiation process of endothelial cells; D: Pseudo-temporal analysis reveals that diabetic kidney disease mostly occurs during the mid-differentiation stage of endothelial cells. DKD: Diabetic kidney disease; SIRT2: Sirtuin 2; CASP1: Caspase 1; ENDO: Endothelial cells; TAL: Thick ascending limb; PT_VACM1: Proximal tubule with vascular cell adhesion molecule-1 expression; PODO: Podocyte; PEC: Parietal epithelial cells; PCT: Proximal convoluted tubule; PC: Principal cells; MES_FIB: Mesenchymal fibroblast; LEUK: Leukocytes; ICB: Type B intercalated cells; ICA: Type A intercalated cells; DCT: Distal convoluted tubule; CNT: Connecting tubule.
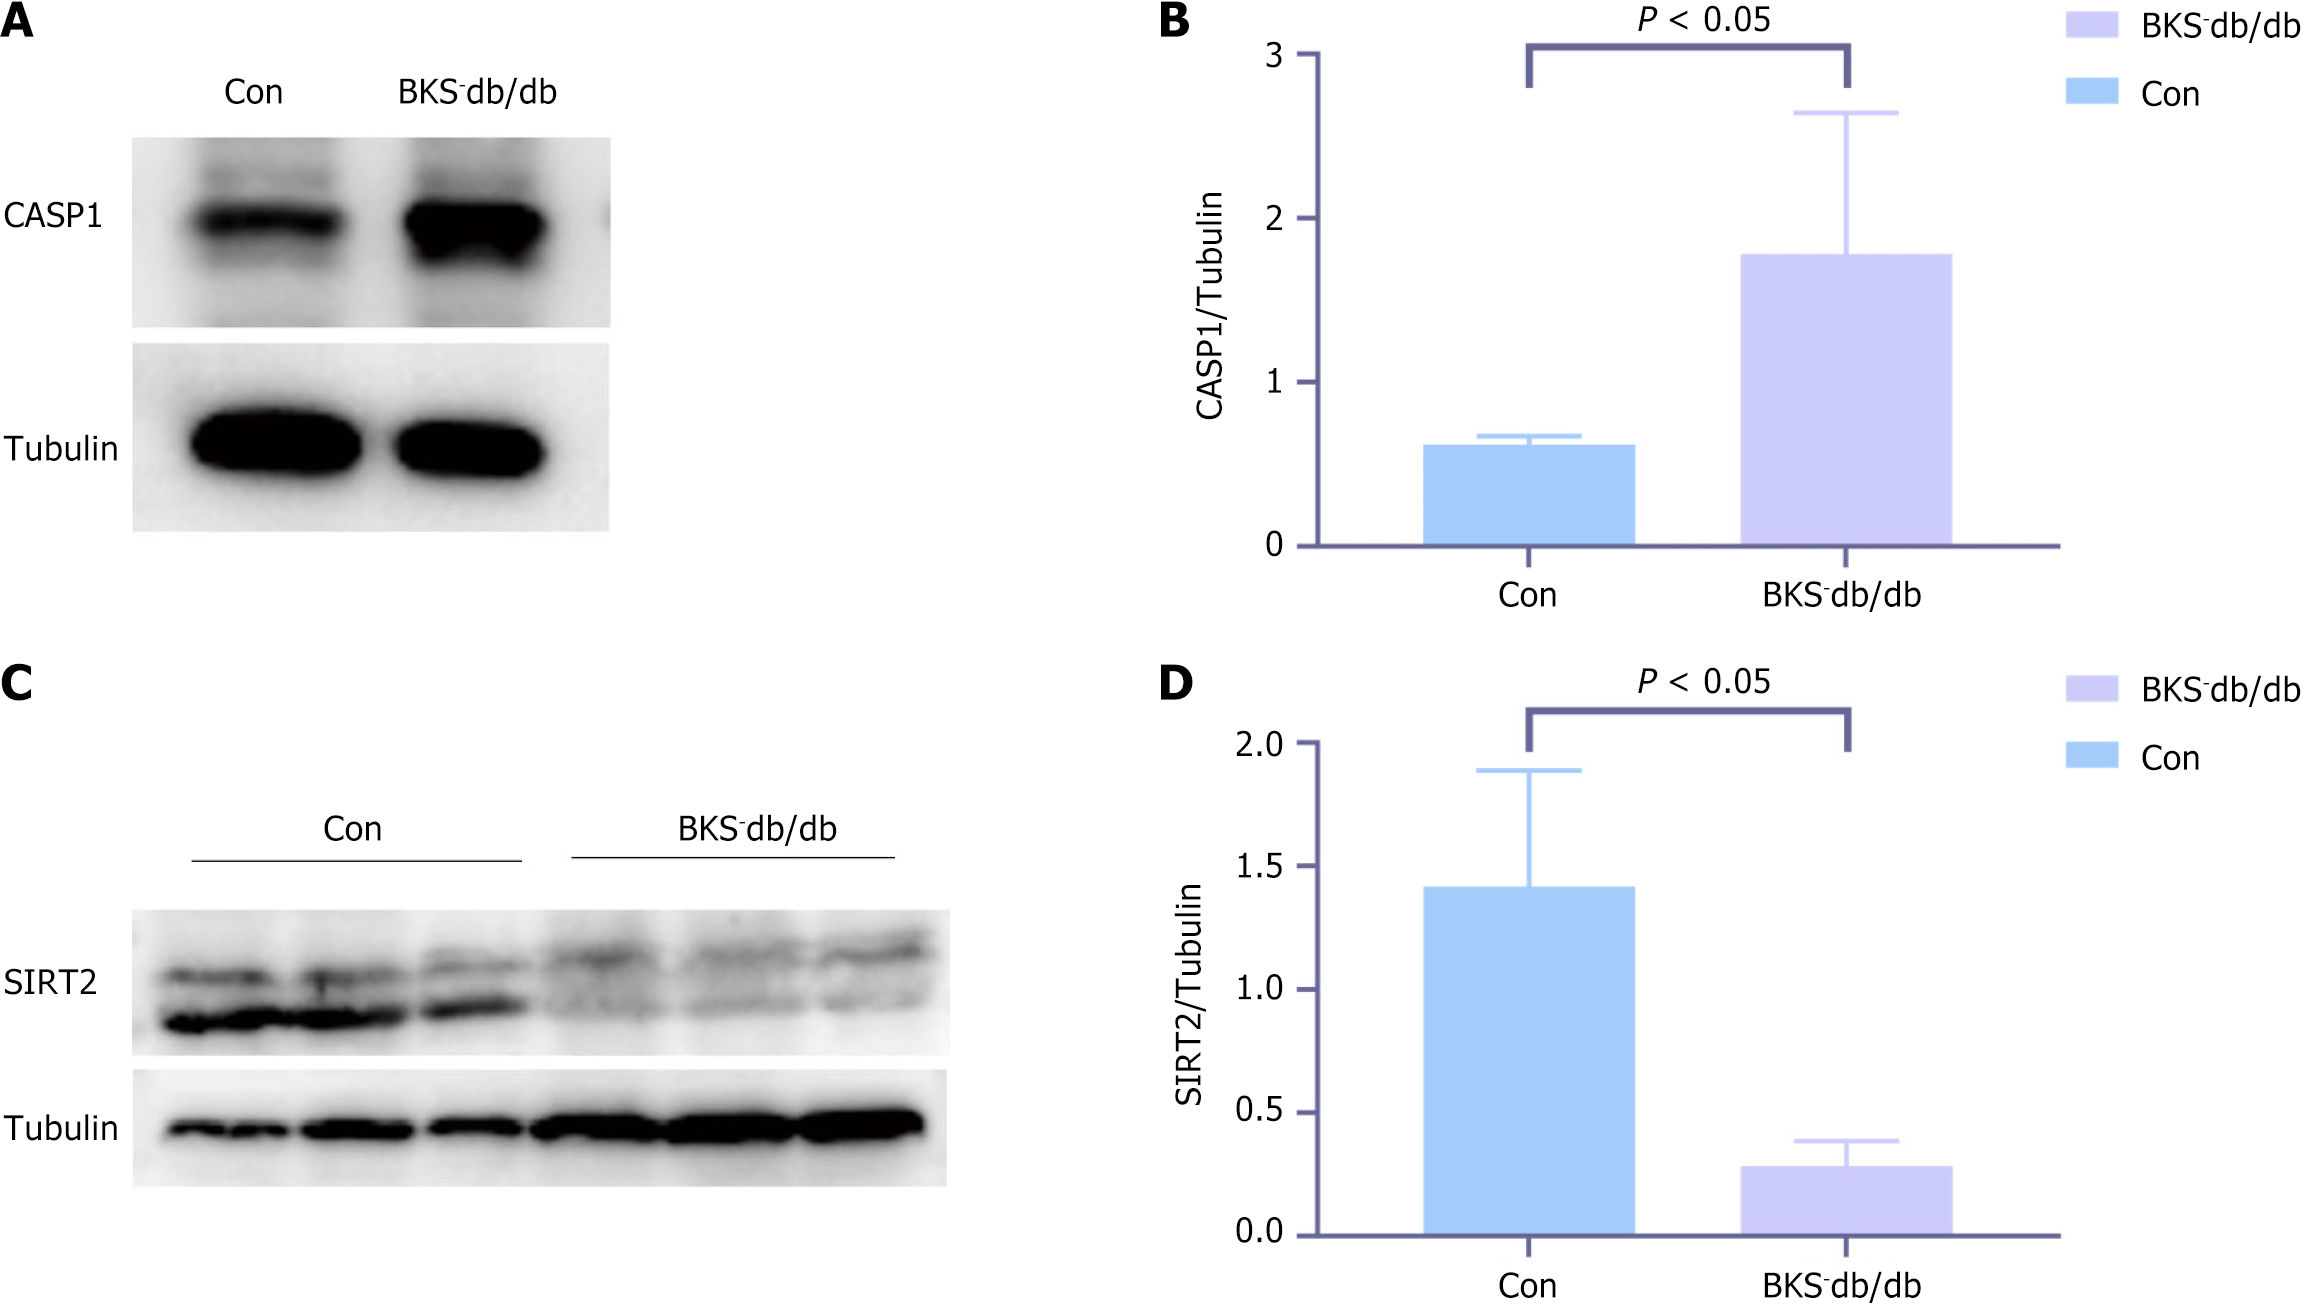
Figure 7 Validation of high caspase 1 and low sirtuin 2 expressions in diabetic kidney disease models.
A and B: Western blot staining of caspase 1 between the diabetic kidney disease and control groups; C and D: Western blot staining of sirtuin 2 between the diabetic kidney disease and control groups (n = 4). CASP1: Caspase 1; SIRT2: Sirtuin 2.
- Citation: Zhou Y, Fang X, Huang LJ, Wu PW. Transcriptome and single-cell profiling of the mechanism of diabetic kidney disease. World J Diabetes 2025; 16(2): 101538
- URL: https://www.wjgnet.com/1948-9358/full/v16/i2/101538.htm
- DOI: https://dx.doi.org/10.4239/wjd.v16.i2.101538


