©The Author(s) 2025.
World J Diabetes. Nov 15, 2025; 16(11): 111578
Published online Nov 15, 2025. doi: 10.4239/wjd.v16.i11.111578
Published online Nov 15, 2025. doi: 10.4239/wjd.v16.i11.111578
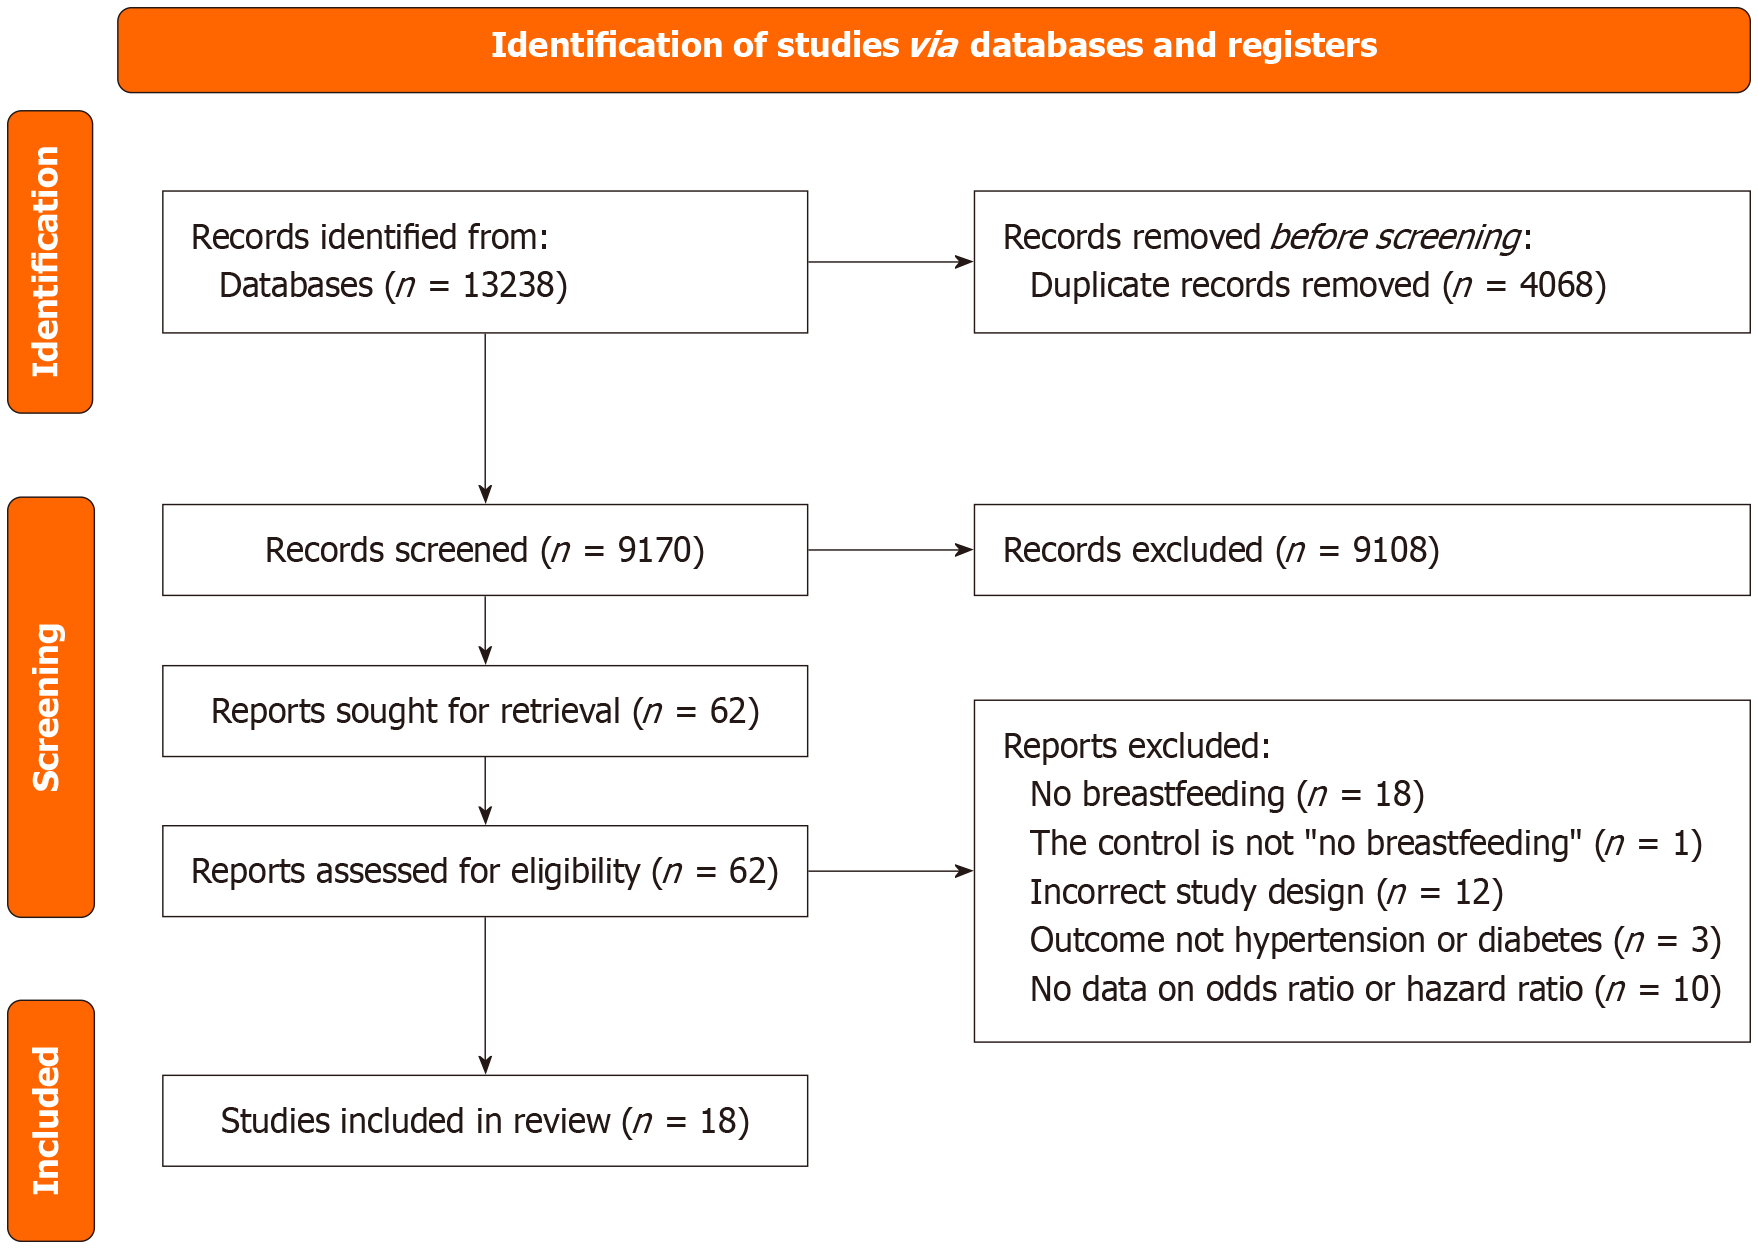
Figure 1
PRISMA flow diagram for article selection for meta-analysis.
Figure 2
Risk of bias graph: The review authors' judgments about each risk of bias item are presented as percentages across all included studies.
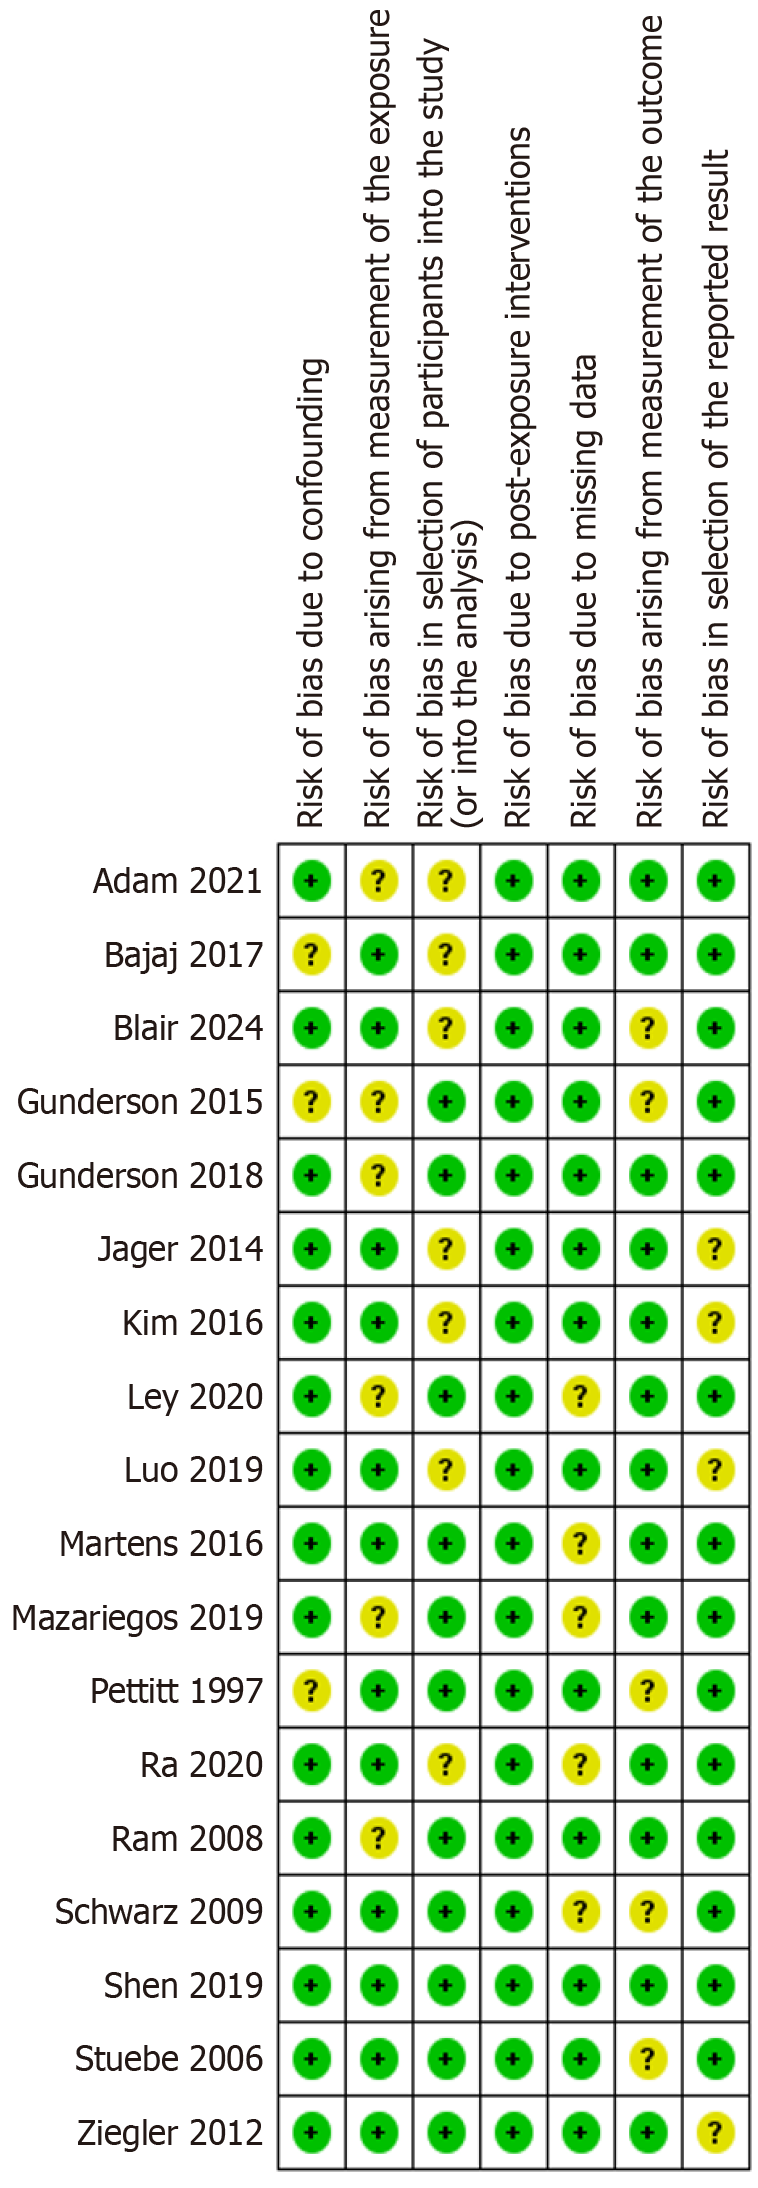
Figure 3
Risk of bias summary: Review authors' judgments about each risk of bias item for each included study.
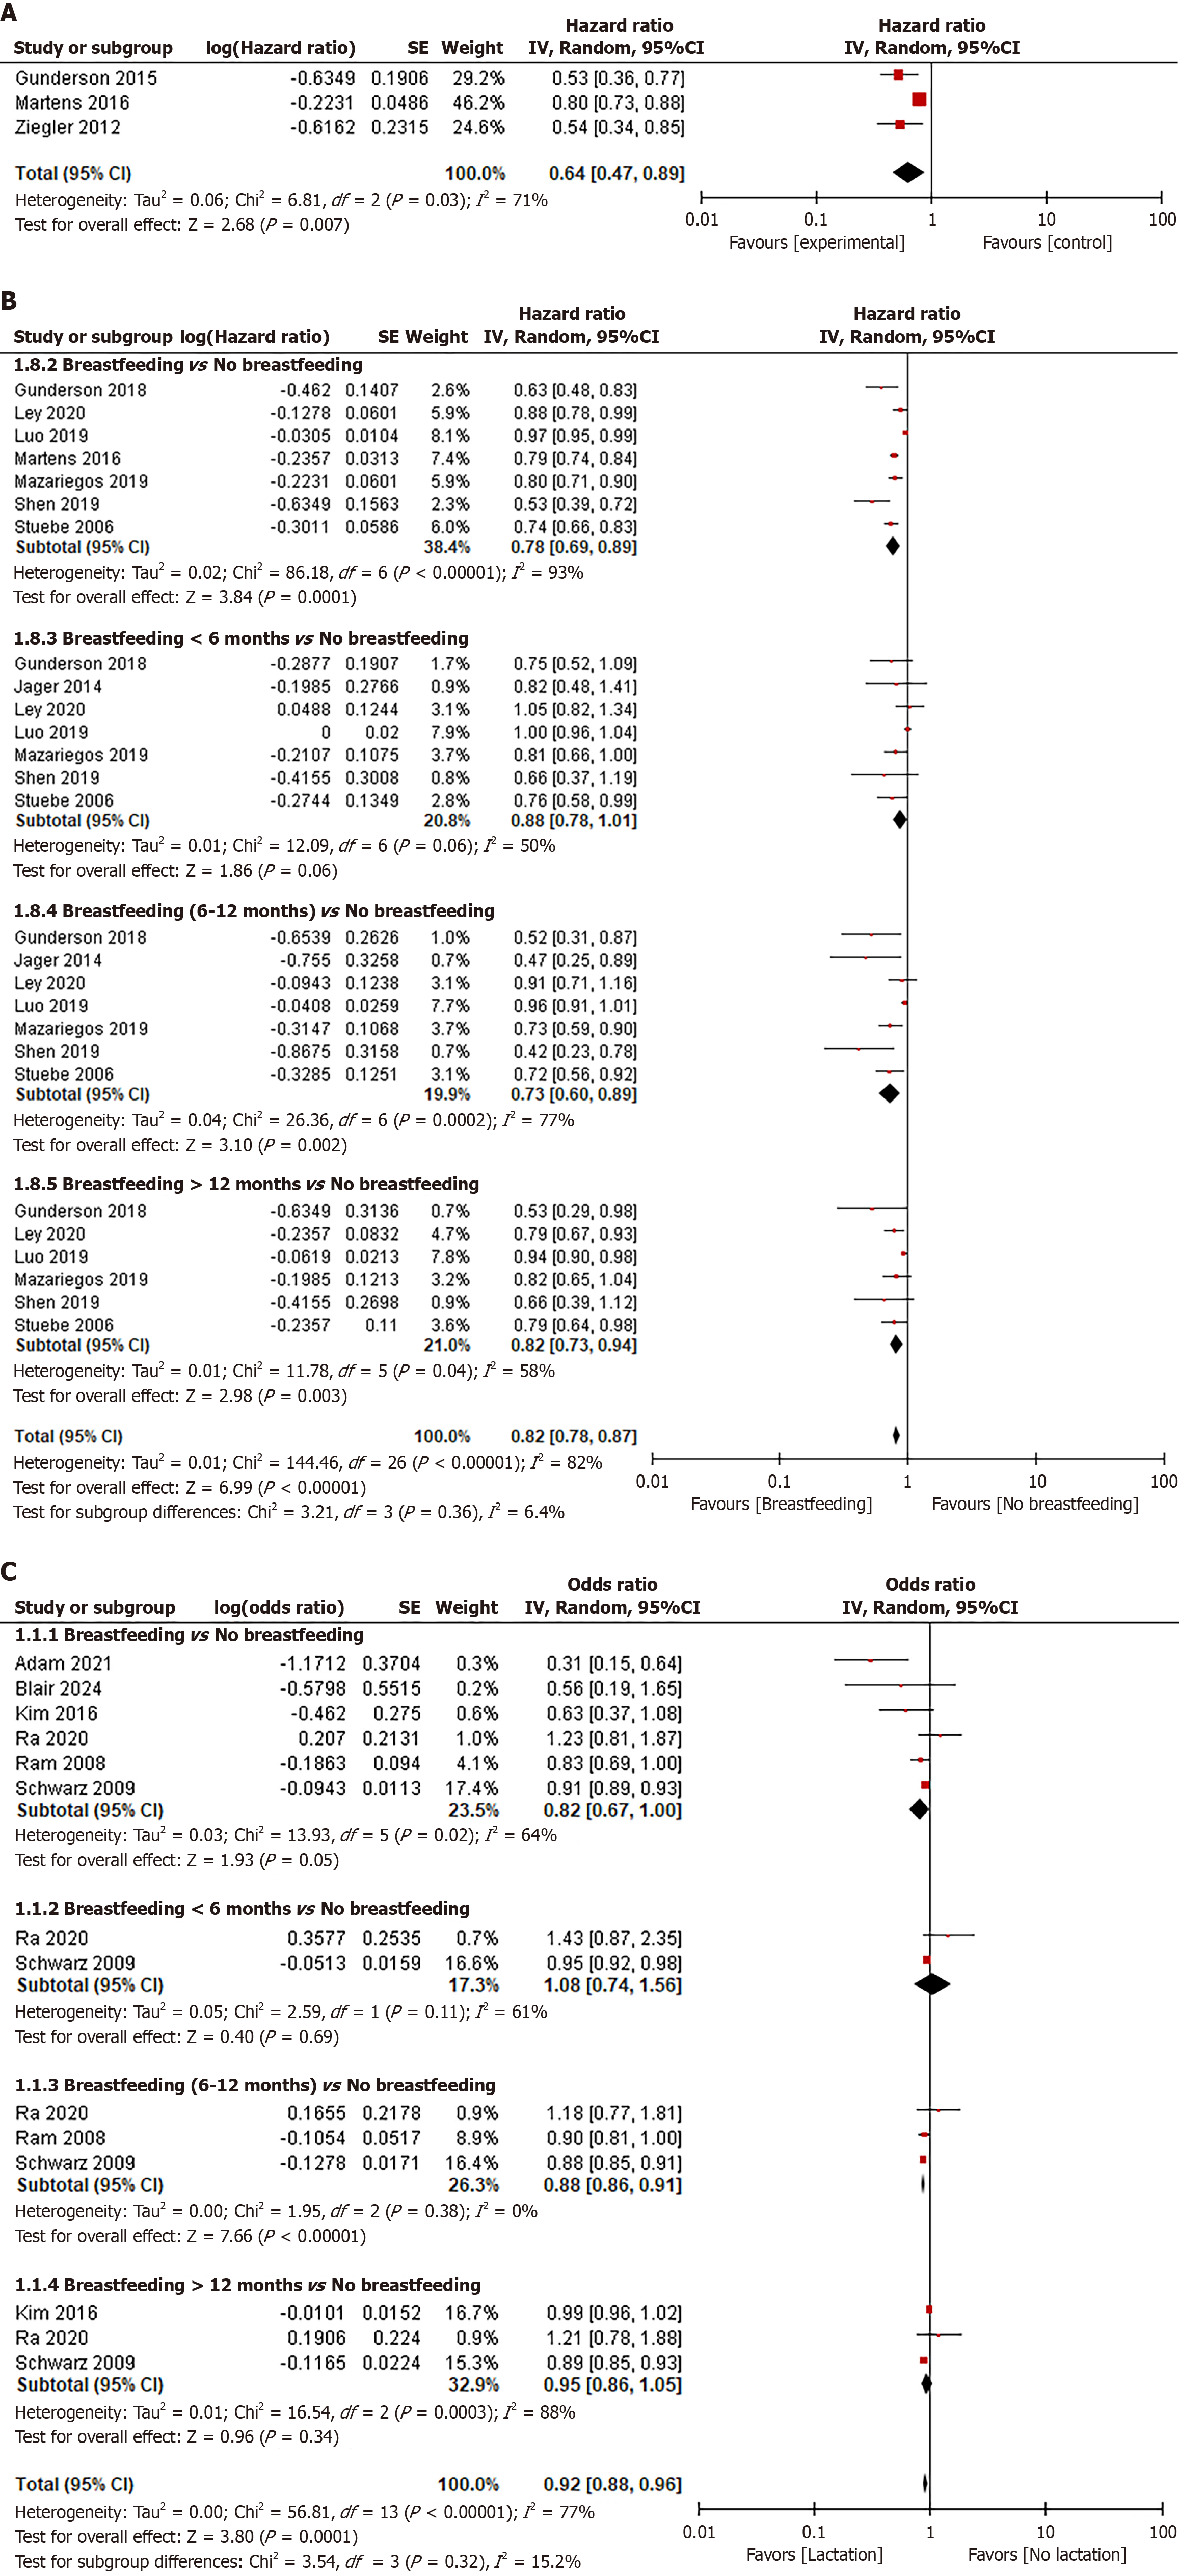
Figure 4 Forest plot.
A: The hazard ratio (HR) of lactation for the risk of diabetes among parous women who previously had gestational diabetes mellitus; B: The HR of lactation for the risk of diabetes among parous women; C: The odds ratio of lactation for the risk of hypertension among parous women. IV: Inverse-variance method; SE: Standard error.
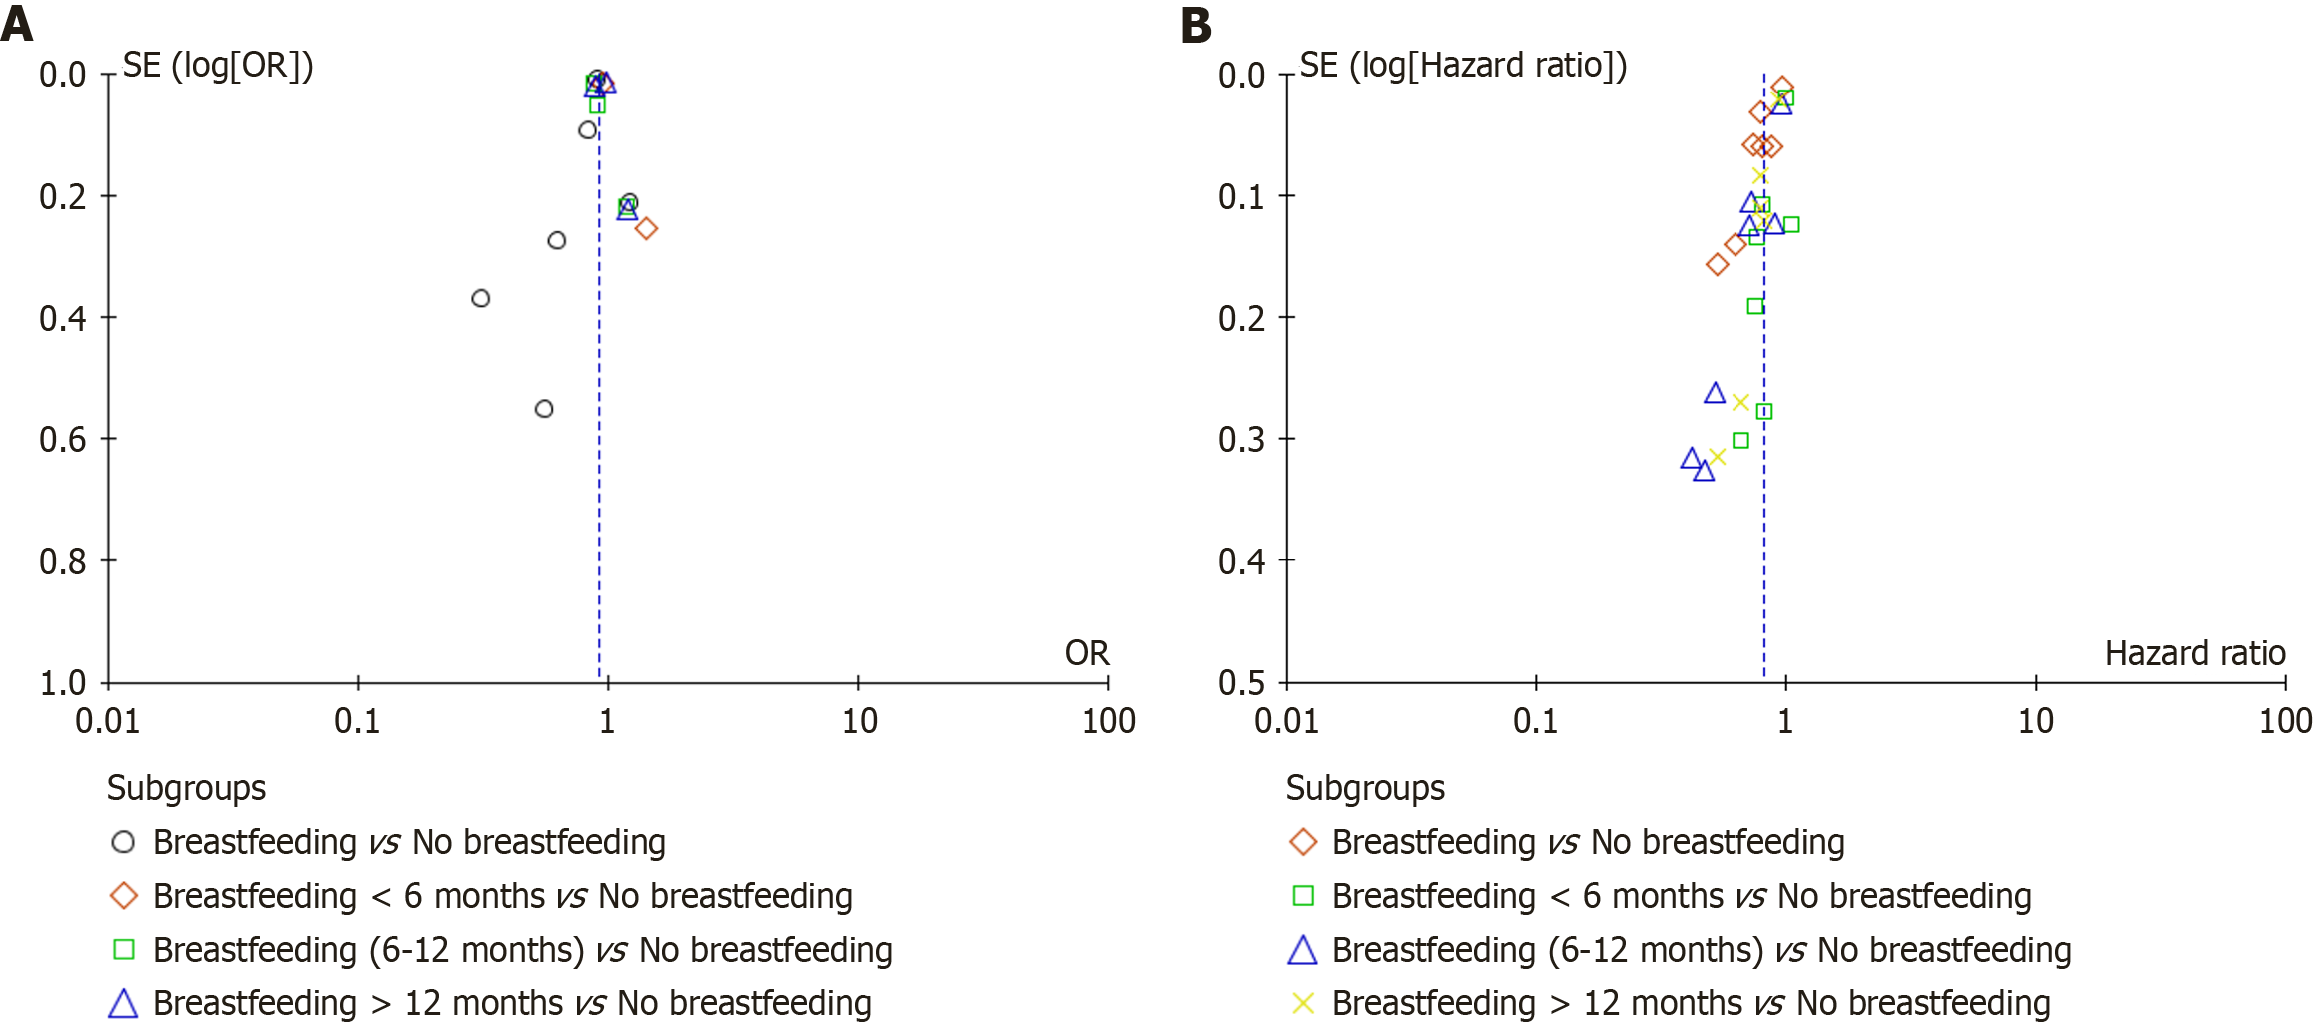
Figure 5 Funnel plots for publication bias assessment.
A: Funnel plot to analyze the odds ratios for hypertension risk among parous women; B: Funnel plot for the analysis of risk for diabetes hazard ratio among parous women. SE: Standard error; OR: Odds ratios.
- Citation: Zheng SW, Lin XY, Xie NS, Zhang XY, Deng F, Zou HQ, Zhan XL, Tang GY. Breastfeeding was associated with lower risks of maternal postpartum hypertension and diabetes mellitus: A systematic review and meta-analysis. World J Diabetes 2025; 16(11): 111578
- URL: https://www.wjgnet.com/1948-9358/full/v16/i11/111578.htm
- DOI: https://dx.doi.org/10.4239/wjd.v16.i11.111578


