©The Author(s) 2025.
World J Diabetes. Nov 15, 2025; 16(11): 109919
Published online Nov 15, 2025. doi: 10.4239/wjd.v16.i11.109919
Published online Nov 15, 2025. doi: 10.4239/wjd.v16.i11.109919
Figure 1 Statistical comparison of gastrointestinal flora abundance between the two groups of patients.
A: Comparison of Chaol index; B: ACE index comparison; C: For the Shannon index comparison; D: Comparison of Simpson index. T2DM: Type 2 diabetes mellitus; DN: Diabetic nephropathy.
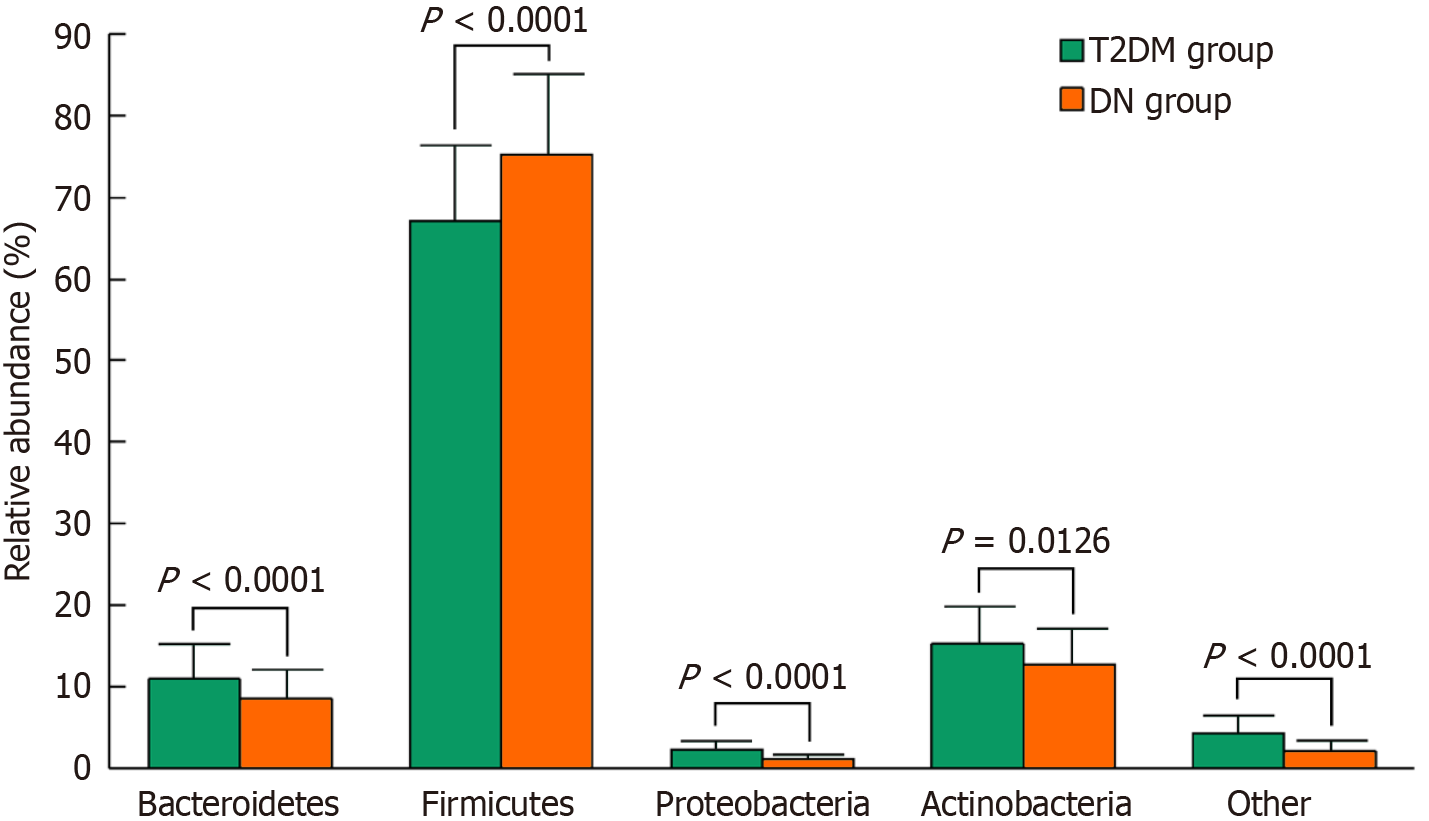
Figure 2 Statistical comparison of the relative abundance of gastrointestinal flora between the two groups of patients.
Bacteroidetes is the genus of Bacteroidetes, Firmicutes is the genus of Firmicutes, Proteobacteria is the genus of Proteobacteria, Actinobacteria is the genus of Actinobacteria, and Other is the other gastrointestinal flora in addition to the above. T2DM: Type 2 diabetes mellitus; DN: Diabetic nephropathy.
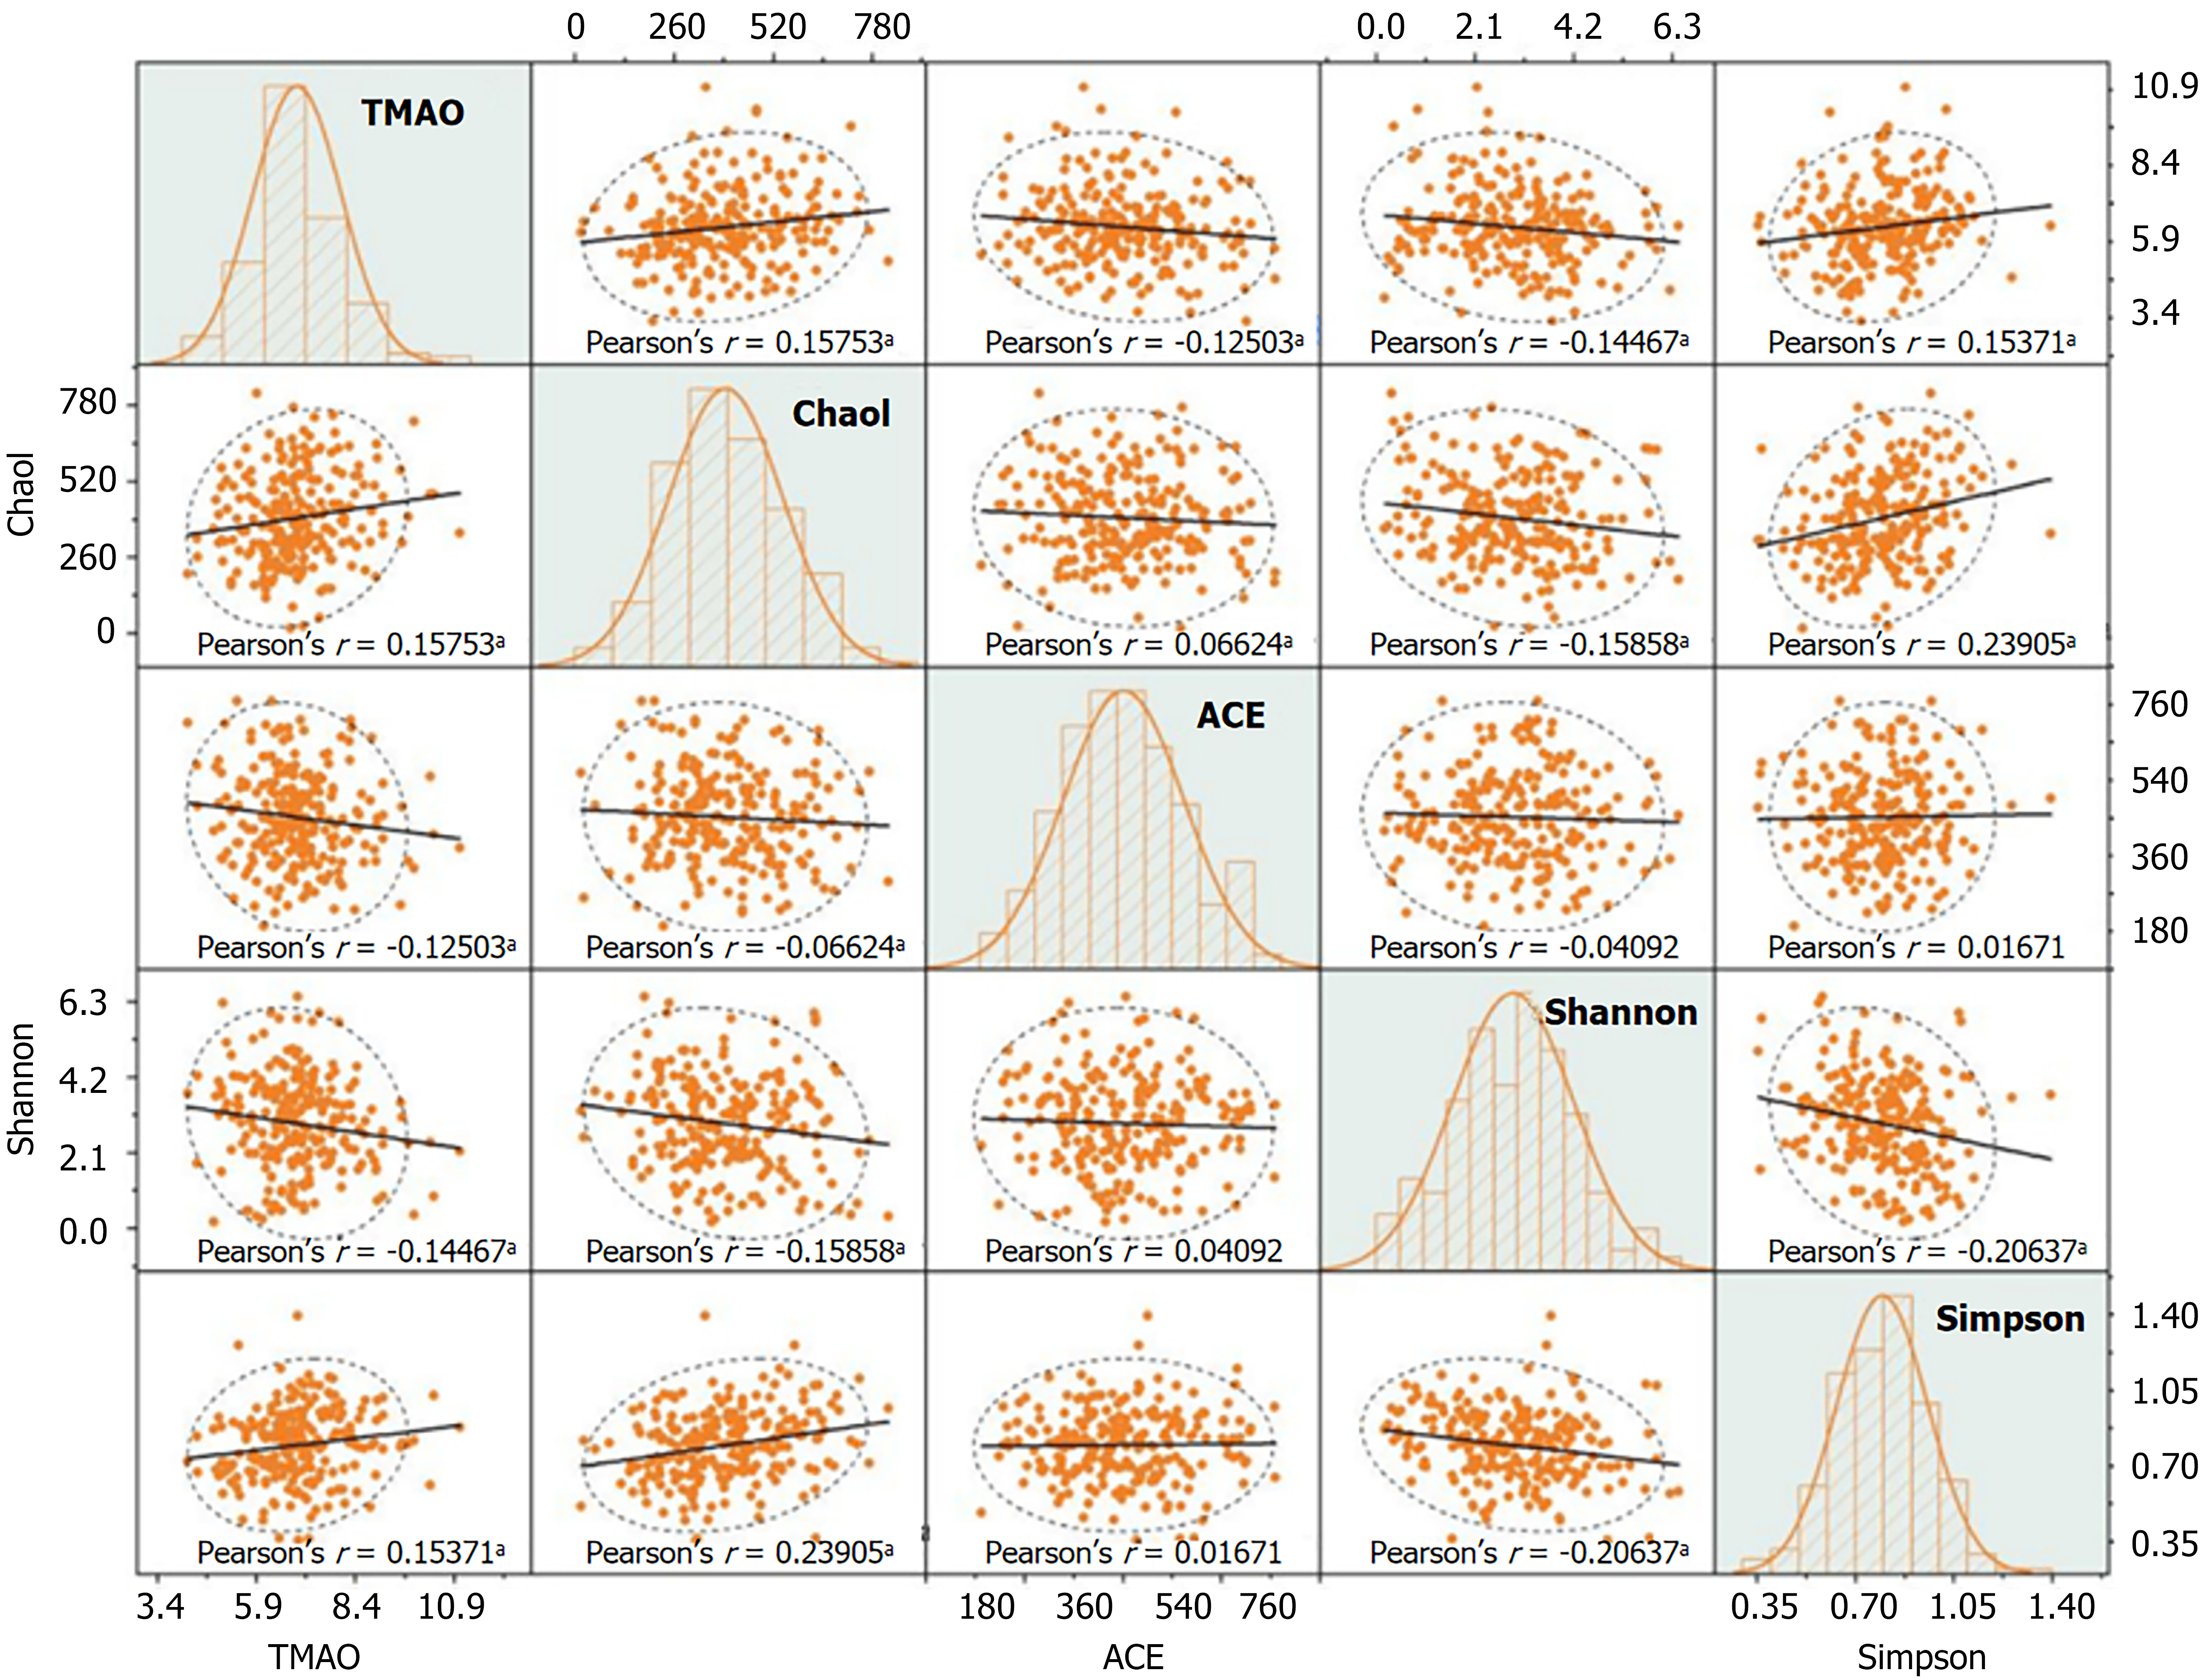
Figure 3 Correlation analysis between trimethylamine N-oxide and gastrointestinal flora abundance in patients with diabetic nephro
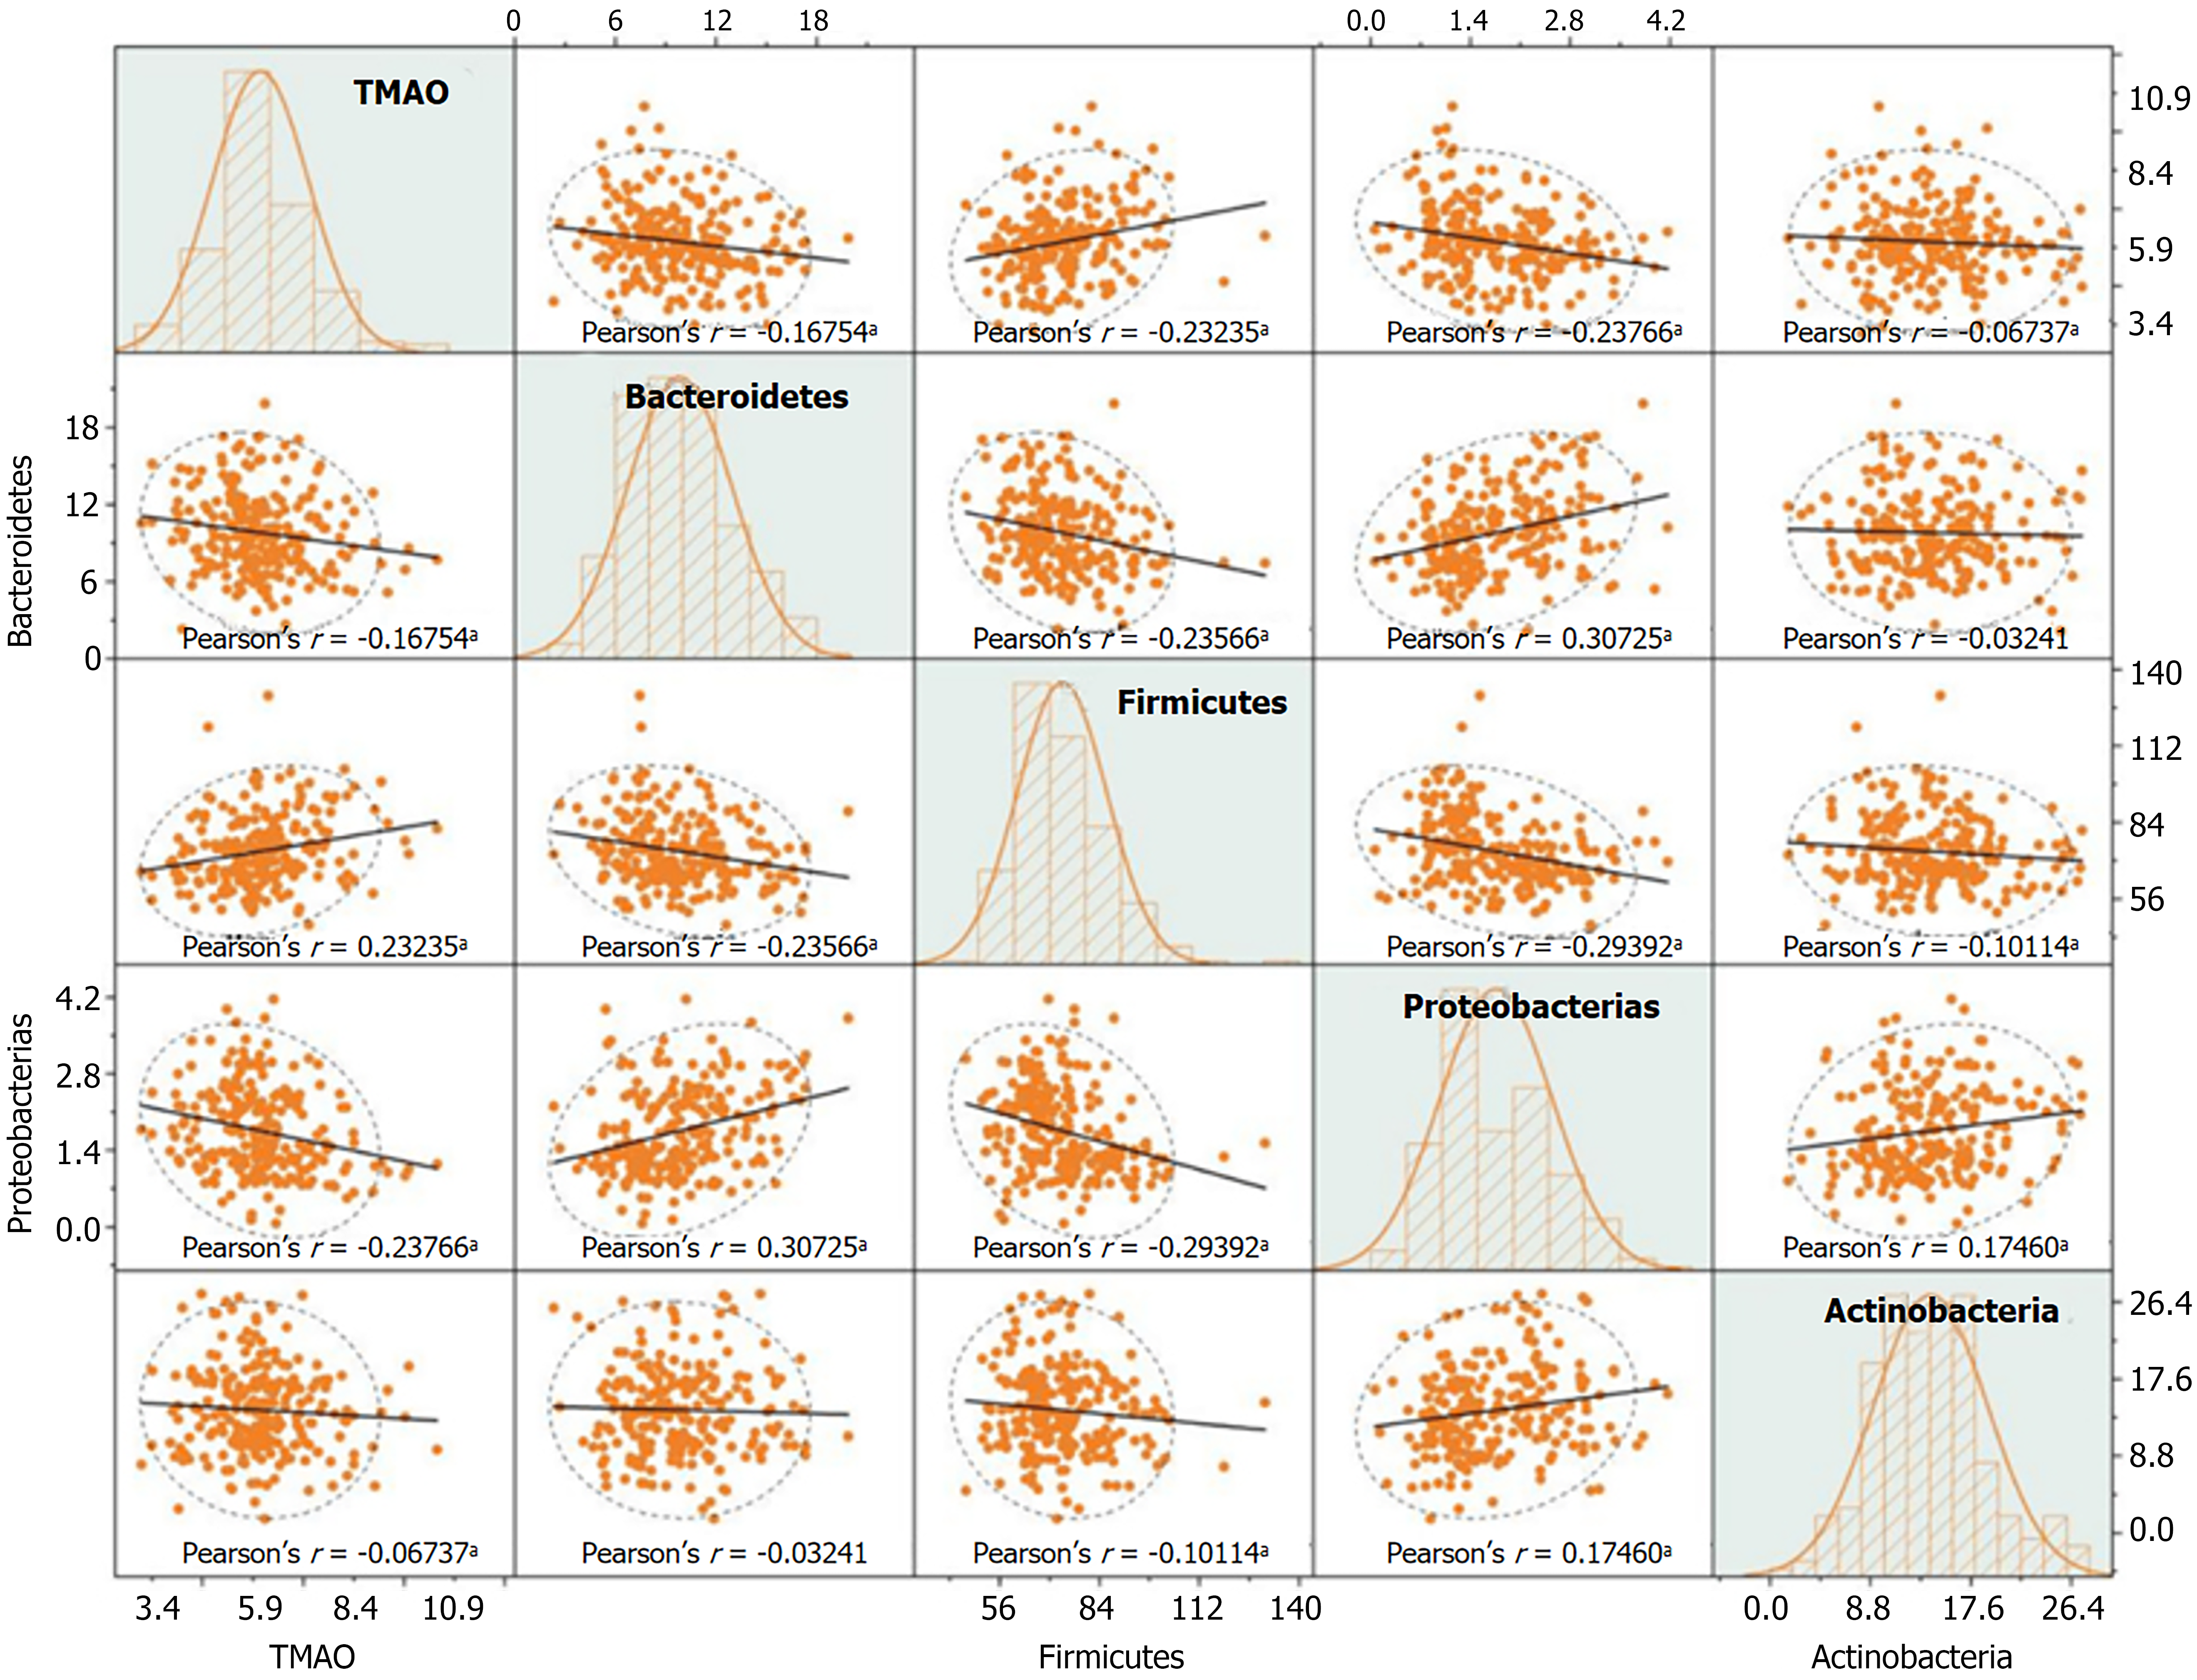
Figure 4 Correlation scatter plot matrix of trimethylamine N-oxide and the relative abundance of gut microbiota phyla in patients with diabetic nephropathy.
r represents the correlation coefficient. Polynomial fitting is used to explore potential nonlinear trends, and the Pearson correlation coefficient r is applied to quantify the strength of associations between variables. Histograms on the diagonal illustrate the distribution patterns of each variable. In the scatter plots, an upward-sloping trend line indicates a positive correlation, while a downward-sloping trend line indicates a negative correlation. The area within the ellipse represents the cluster of data points, while those outside the ellipse are considered outliers. aP < 0.05. TMAO: Trimethylamine N-oxide.
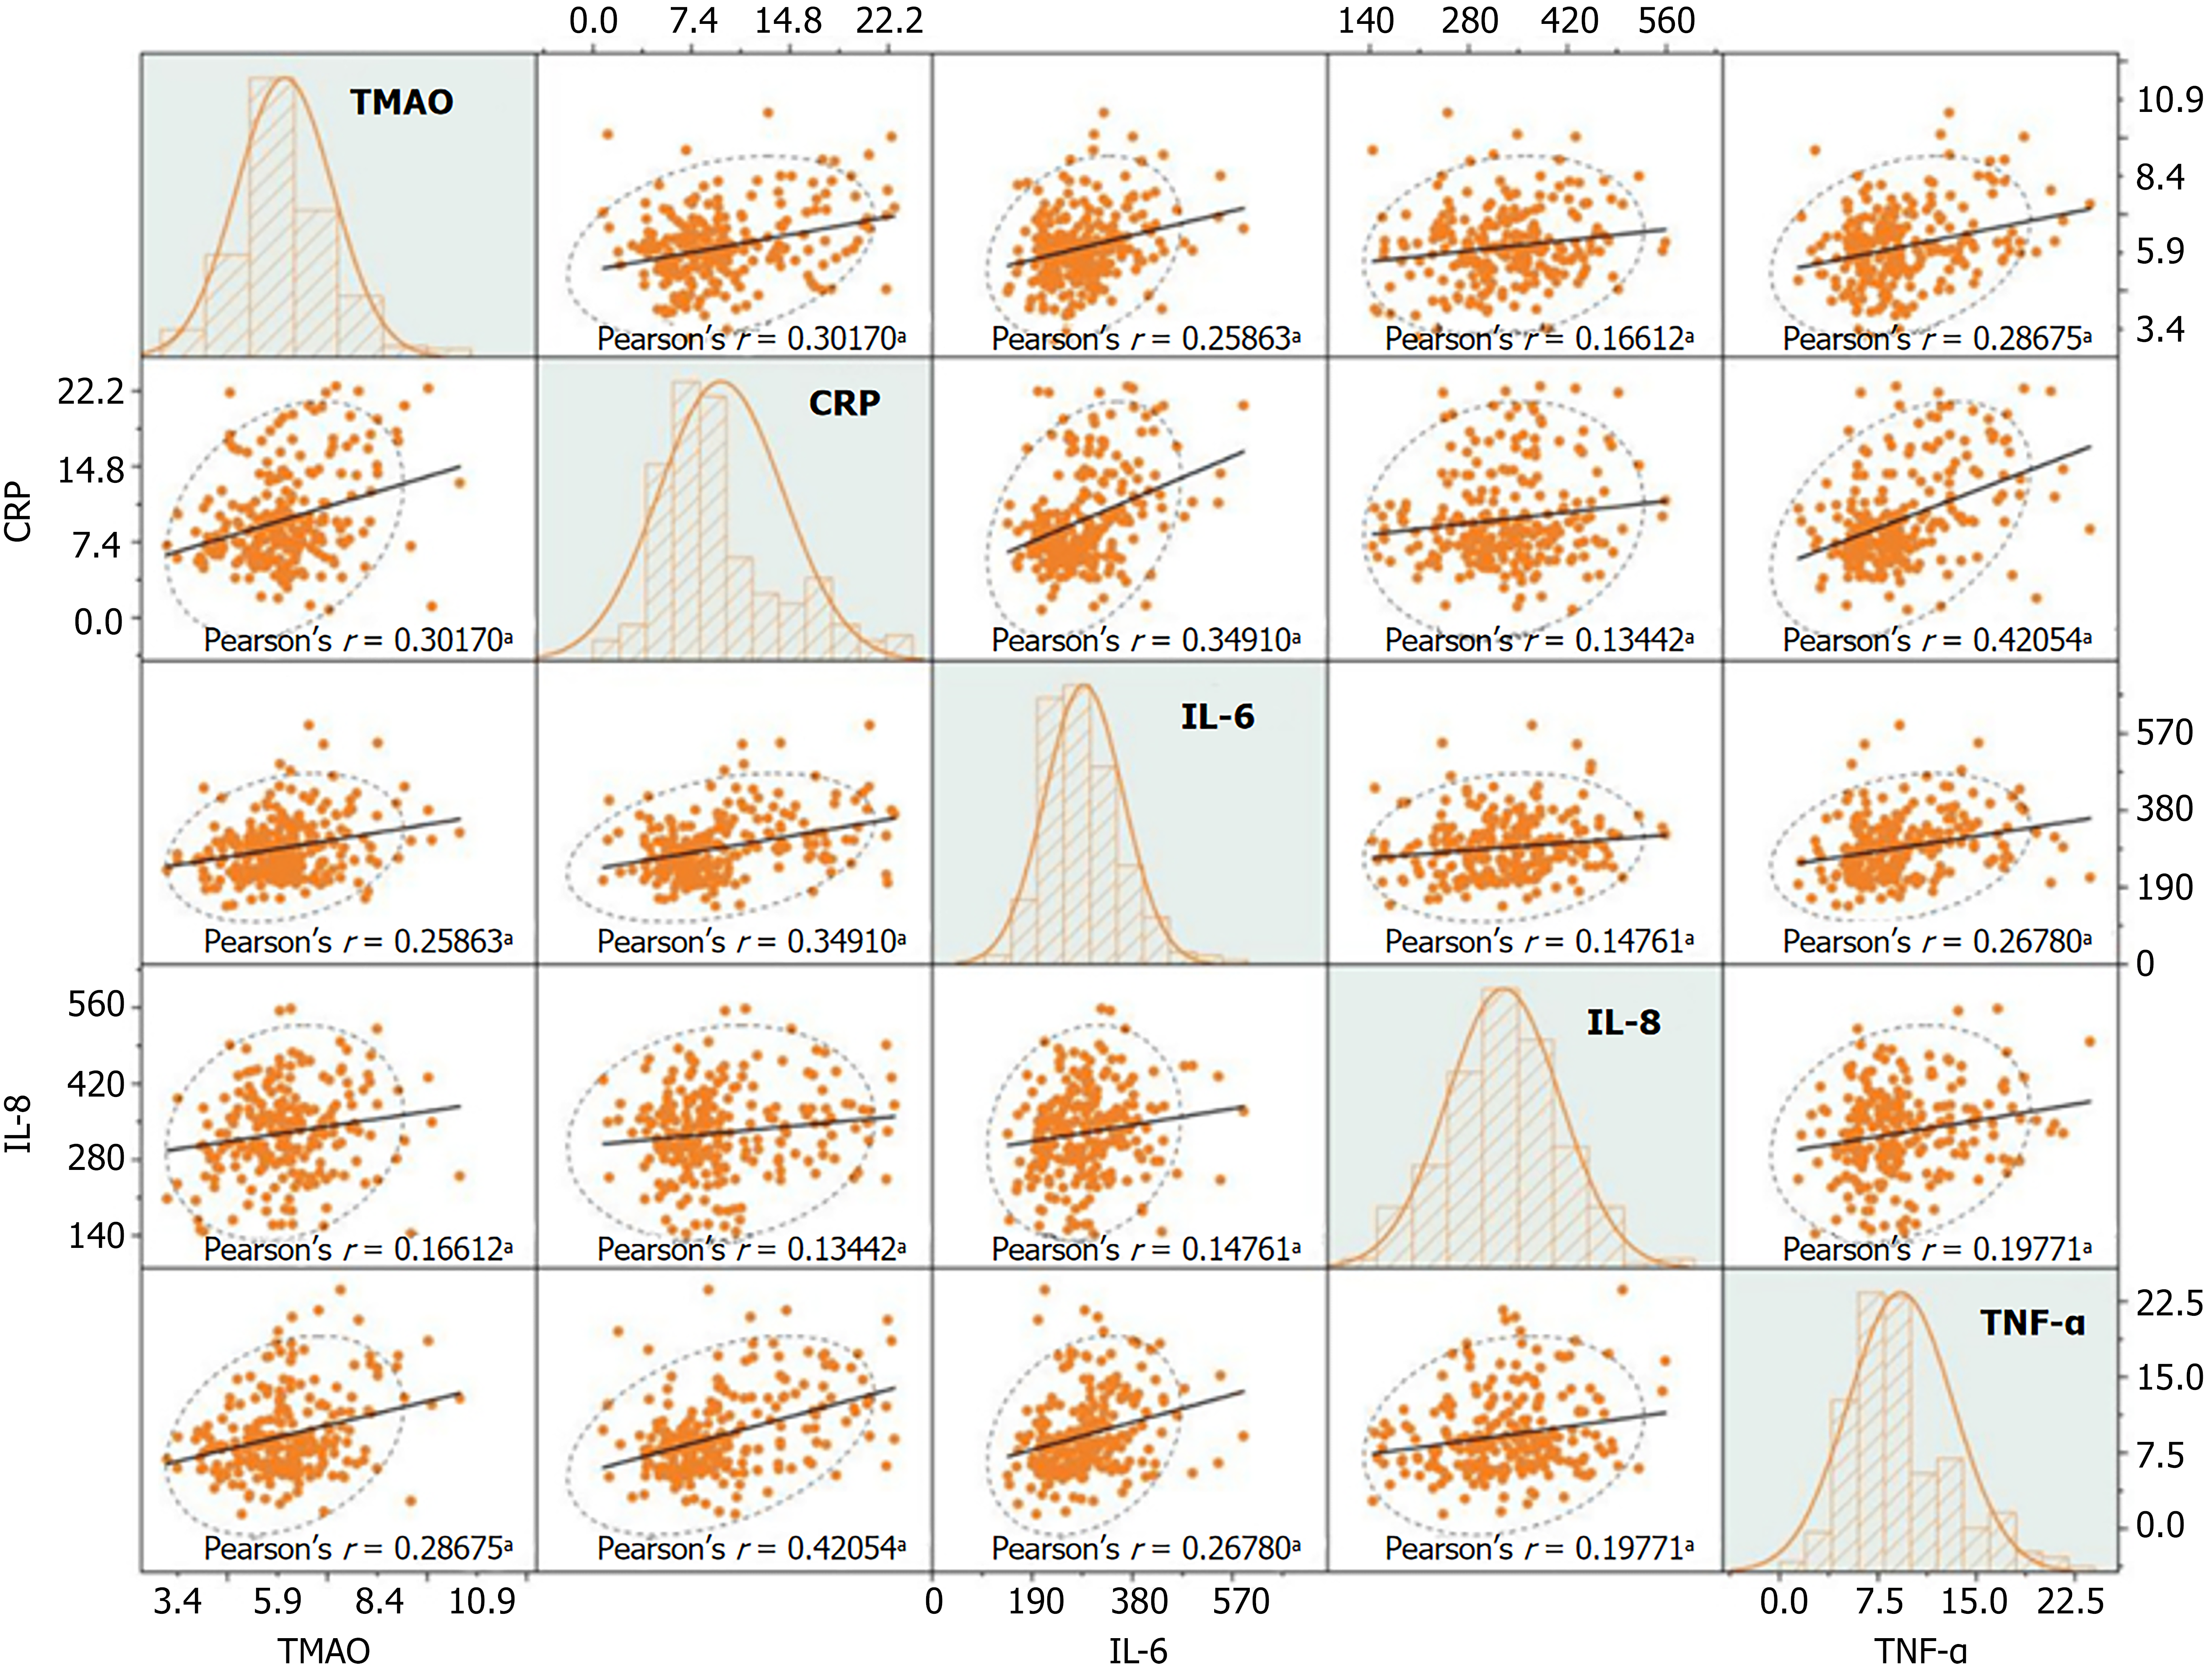
Figure 5 Correlation analysis of trimethylamine N-oxide and inflammatory factor levels in patients with diabetic nephropathy.
Matrix scatter plot. r denotes the correlation coefficient. Polynomial fitting is used to explore potential nonlinear trends, and the Pearson correlation coefficient r is applied to quantify the strength of relationships between variables. Histograms on the diagonal represent data distribution patterns. In the scatter plots, an upward-sloping trend line indicates a positive correlation, while a downward-sloping trend line indicates a negative correlation. Data points clustered within the ellipse represent the main distribution area, whereas points outside the ellipse are considered outliers. aP < 0.05. TMAO: Trimethylamine N-oxide; CRP: C-reactive protein; IL-6: Interleukin-6; IL-8: Interleukin-8; TNF-α: Tumor necrosis factor.
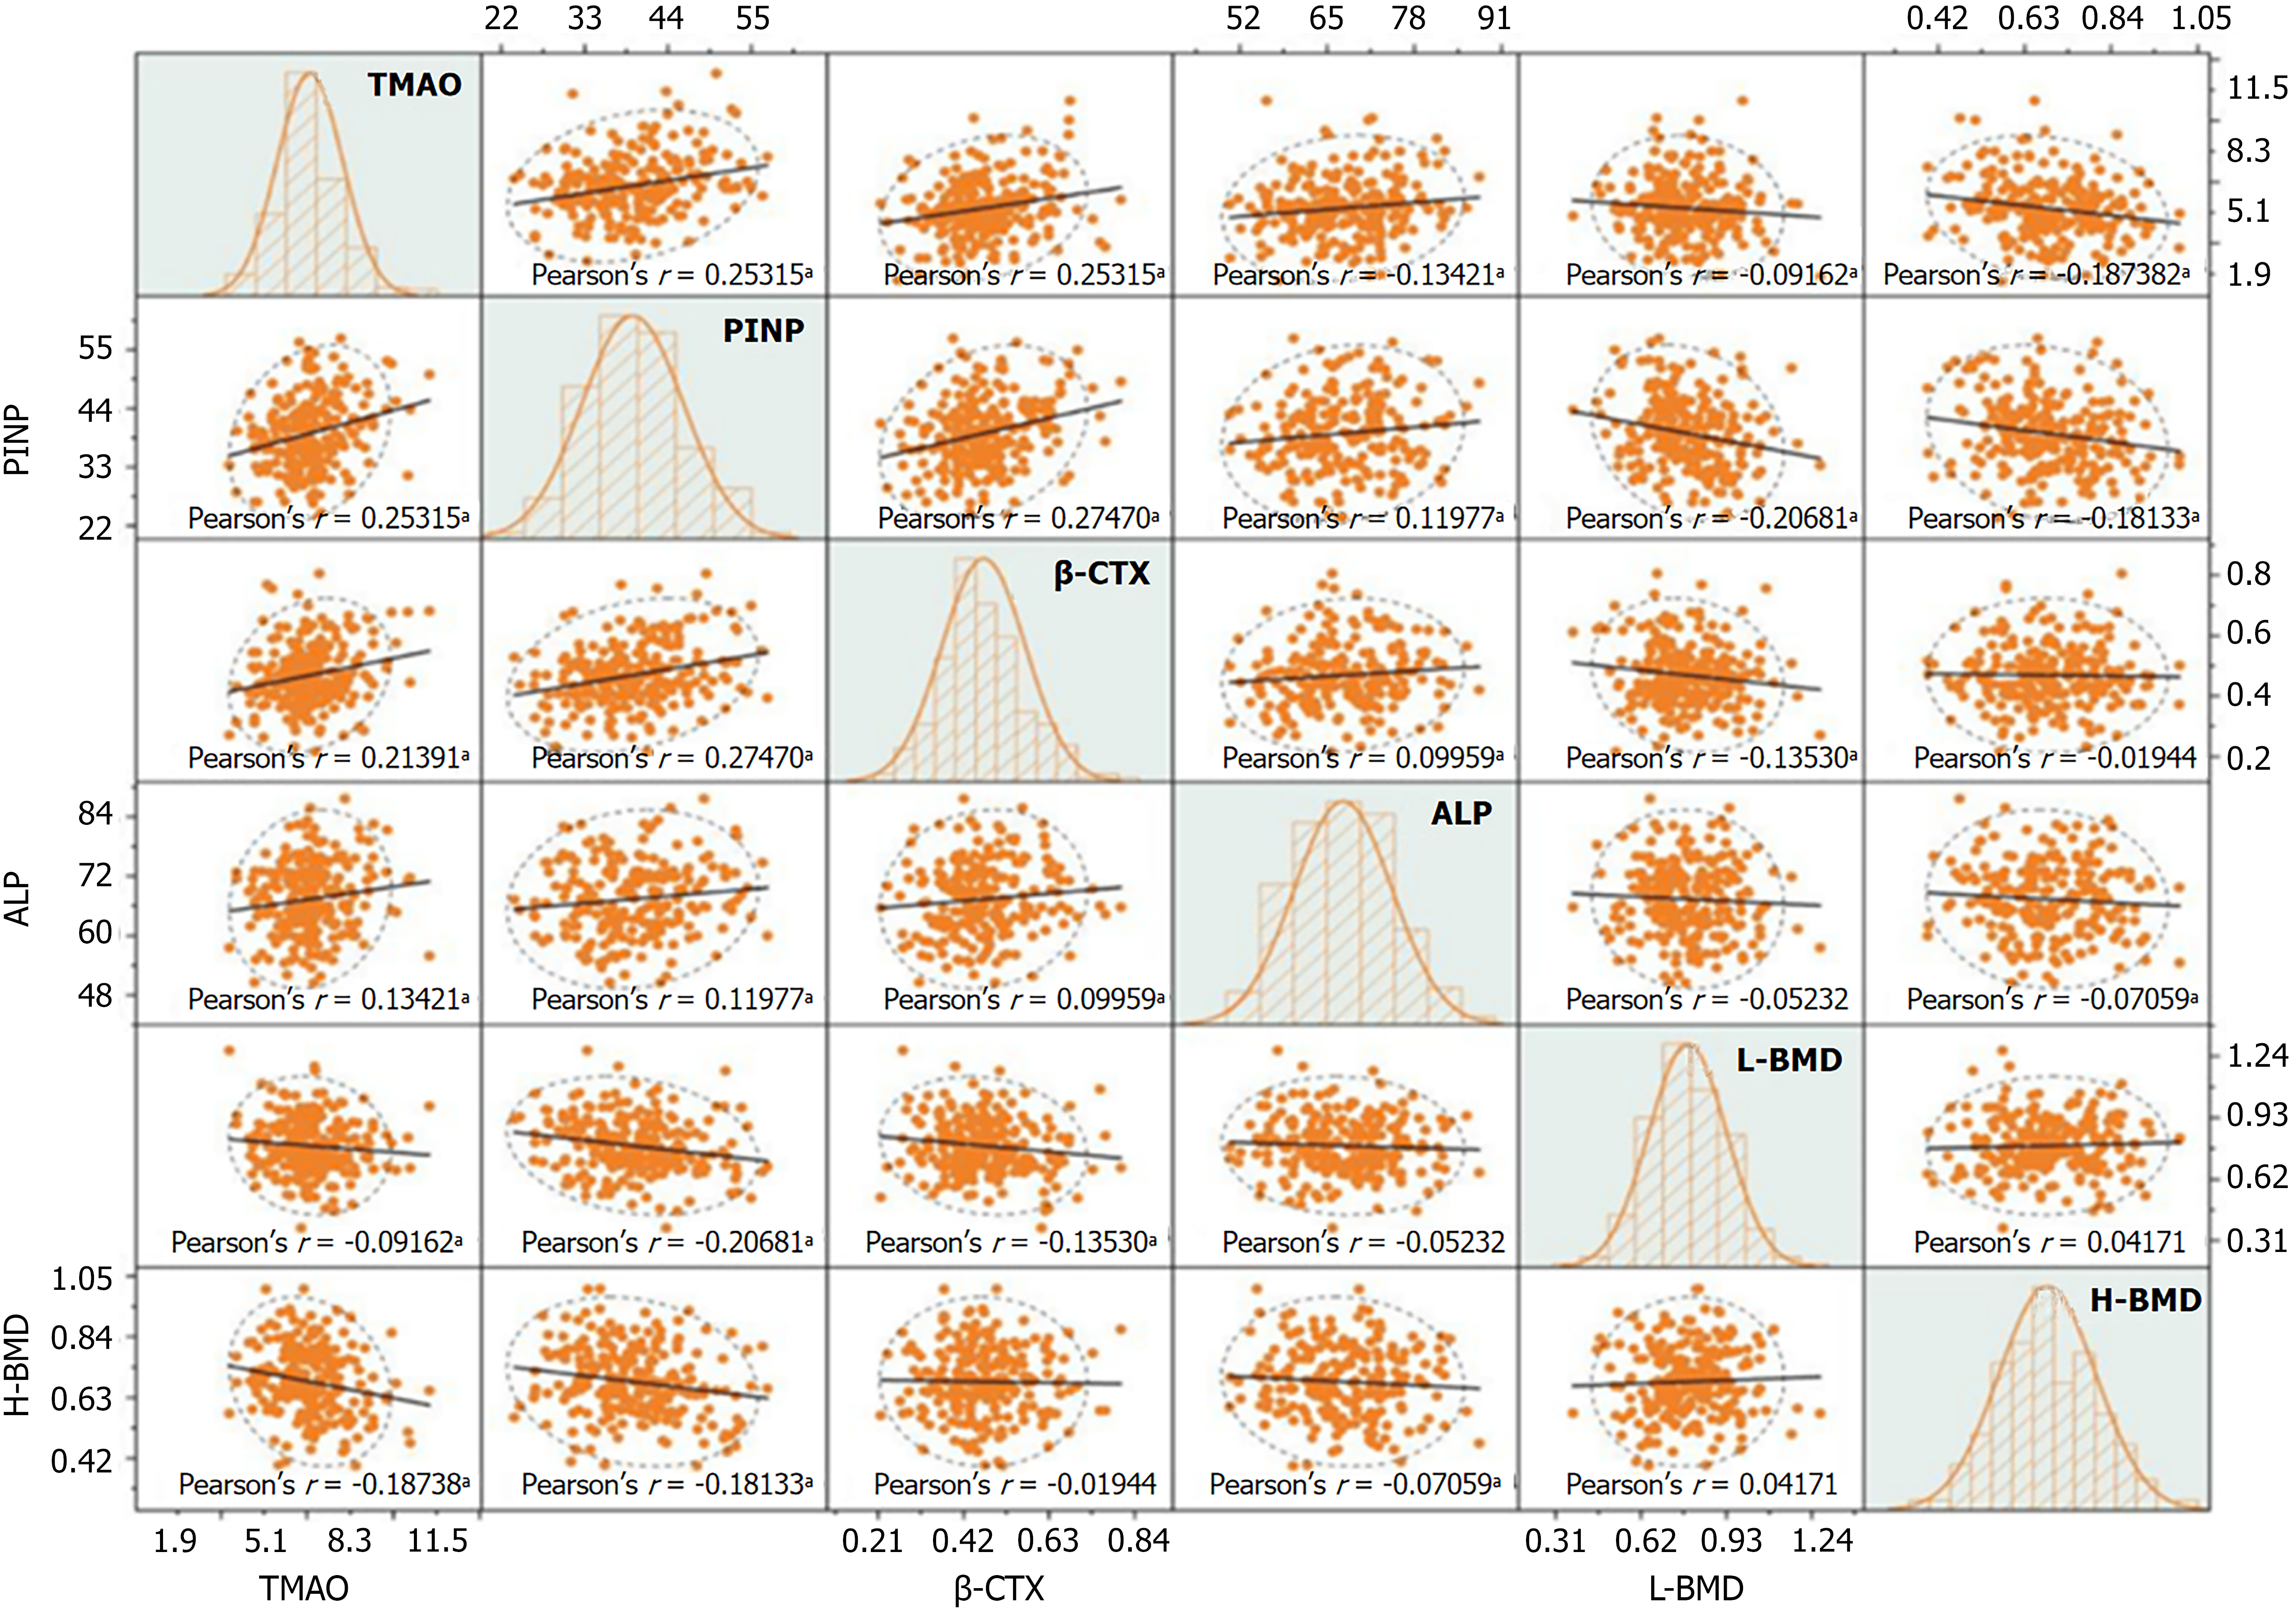
Figure 6 Correlation analysis of trimethylamine N-oxide and bone metabolism index levels in patients with diabetic nephropathy.
Matrix scatter plot. r denotes the correlation coefficient. Polynomial fitting is used to explore potential nonlinear trends. The Pearson correlation coefficient r is applied to quantify the strength of the relationships between variables. Histograms on the diagonal illustrate the data distribution patterns. In the scatter plots, an upward-sloping trend line indicates a positive correlation, while a downward-sloping trend line indicates a negative correlation. Data points within the ellipse represent the main clustering region, while those outside the ellipse are considered outliers. aP < 0.05. TMAO: Trimethylamine N-oxide; H-BMD: Hip bone mineral density; L-BMD: Lumbar vertebrae bone mineral density; PINP: Procollagen type I N-terminal propeptide; β-CTX: Β-CrossLaps; ALP: Alkaline phosphatase.
- Citation: Pan ZL, Li MQ, Zhang J, Xue LY, Shi YP. Correlation of gut microbiota metabolite trimethylamine N-oxide with inflammatory levels and osteoporosis in patients with diabetic nephropathy. World J Diabetes 2025; 16(11): 109919
- URL: https://www.wjgnet.com/1948-9358/full/v16/i11/109919.htm
- DOI: https://dx.doi.org/10.4239/wjd.v16.i11.109919


