©The Author(s) 2025.
World J Diabetes. Nov 15, 2025; 16(11): 109455
Published online Nov 15, 2025. doi: 10.4239/wjd.v16.i11.109455
Published online Nov 15, 2025. doi: 10.4239/wjd.v16.i11.109455
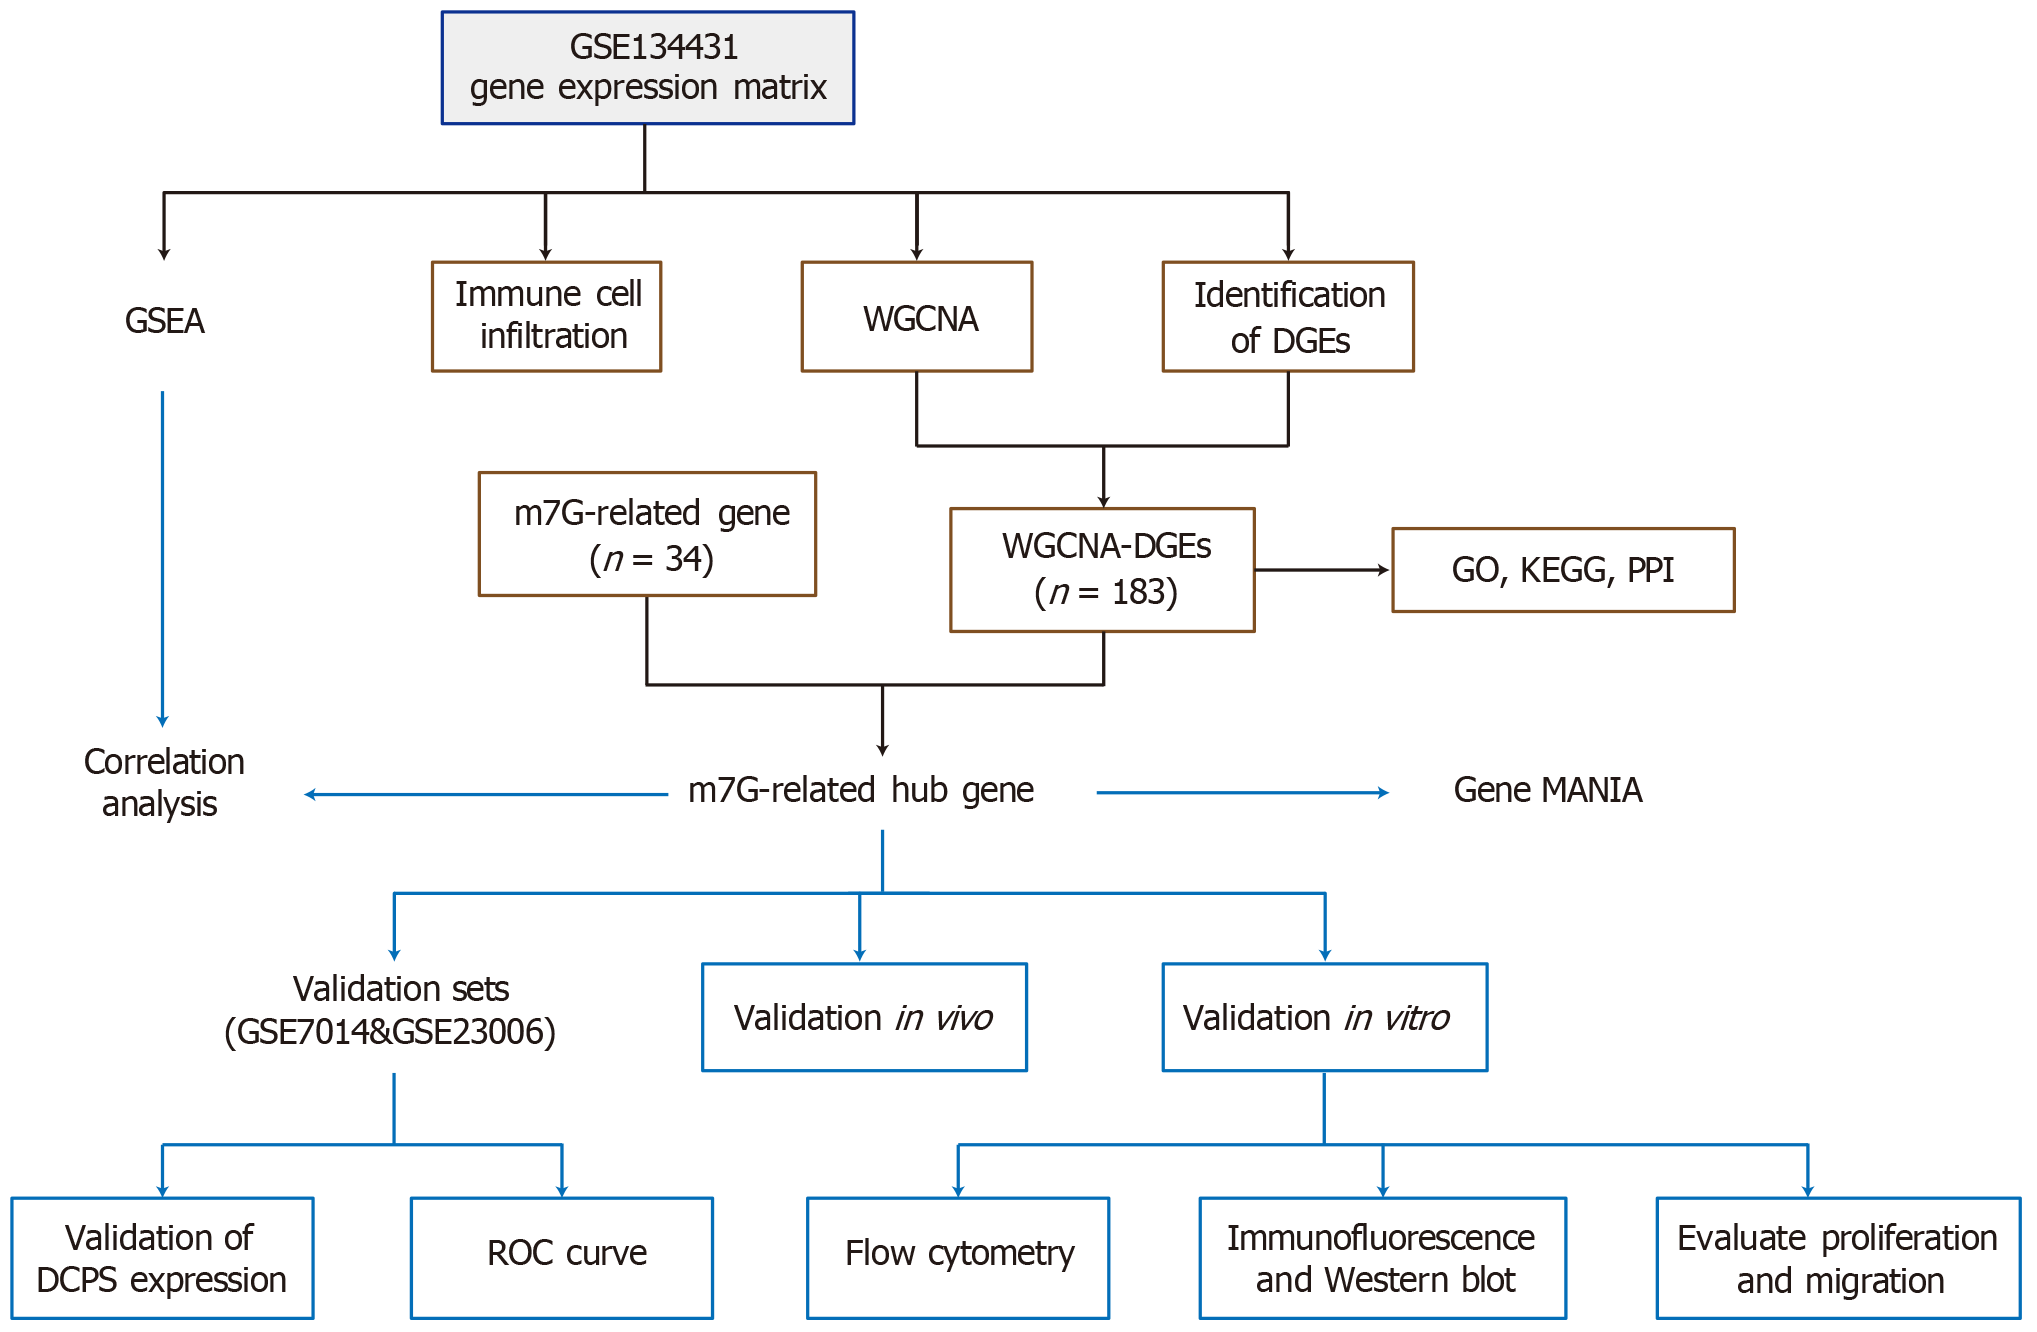
Figure 1 Research framework.
GSEA: Gene set enrichment analysis; WGCNA: Weighted gene co-expression network analysis; DGEs: Differentially expressed genes; m7G: N7-methylguanosine; GO: Gene Ontology; KEGG: Kyoto Encyclopedia of Genes and Genomes; PPI: Protein-protein interaction; DCPS: Decapping scavenger enzyme; ROC: Receiver operating characteristic.
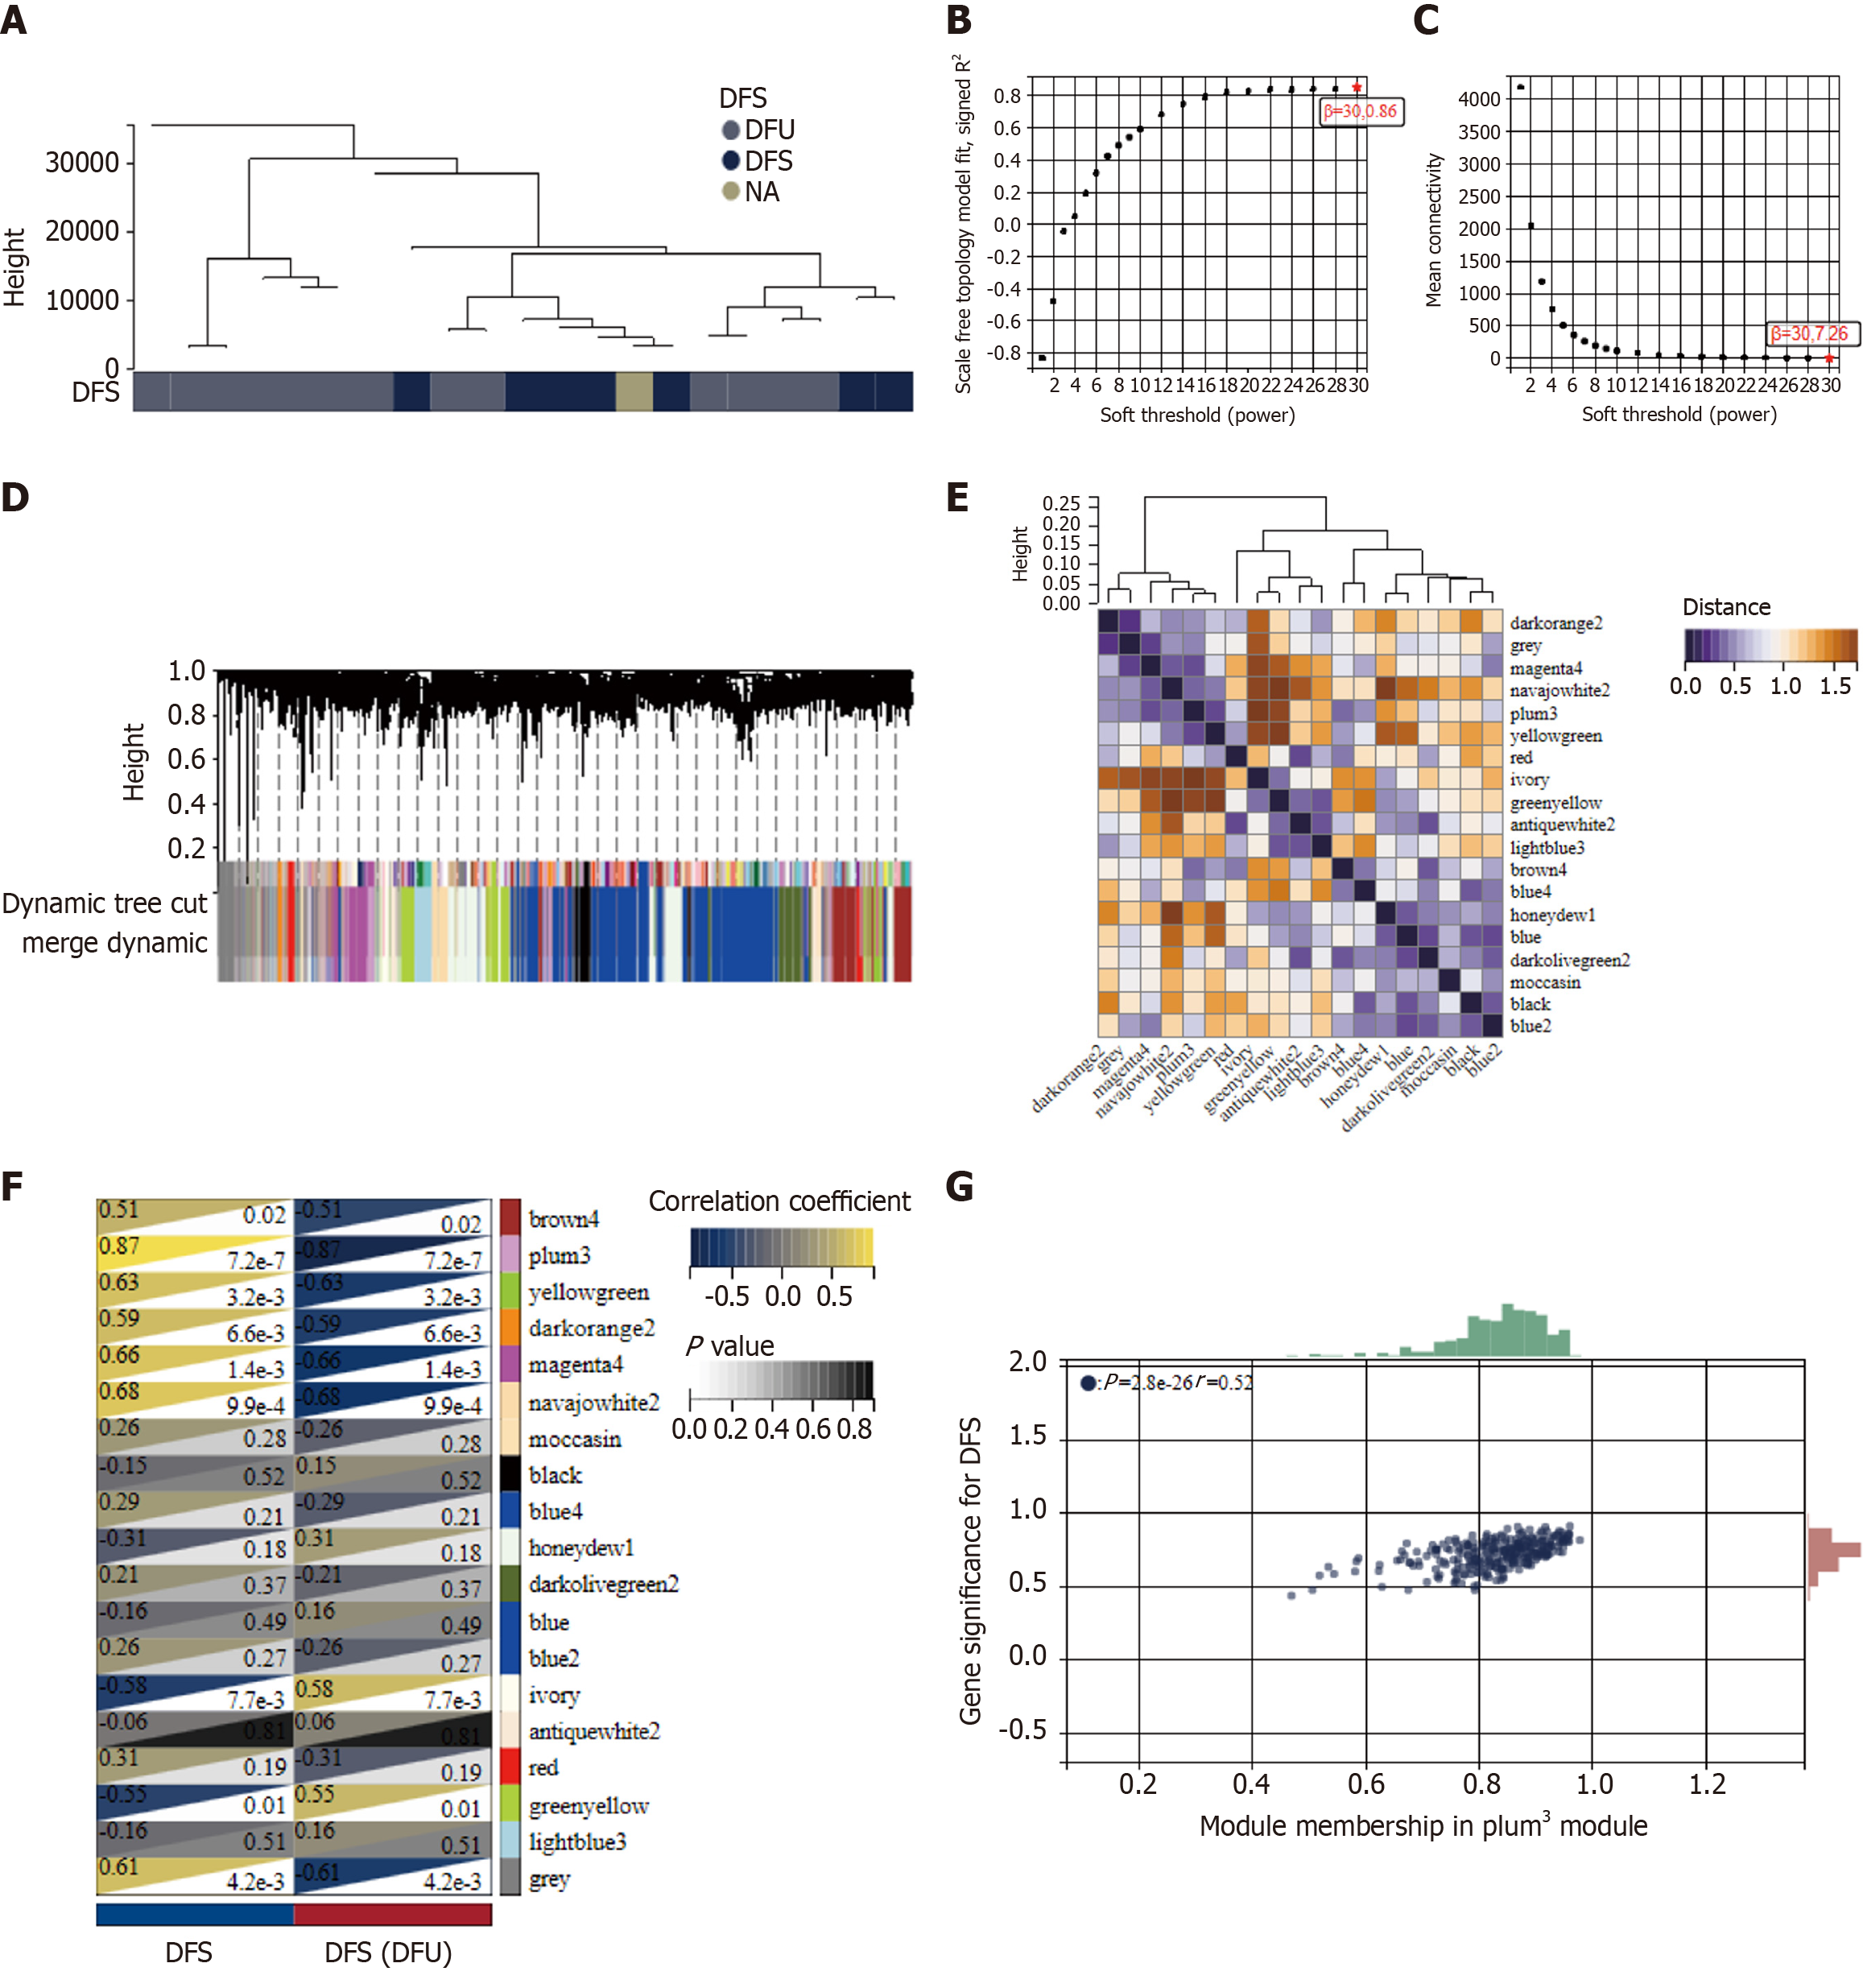
Figure 2 Identification of key modules of weighted gene coexpression network analysis.
A: Sample clustering dendrogram of 21 samples of GSE134431; B and C: The scale-free fit index for various soft-thresholding powers (β) and the mean connectivity for various soft-thresholding powers; D: Dendrogram of genes clustered via the dissimilarity measure (1-topological overlap matrix); E: Heatmap of eigengene adjacency; F: Heatmap of the correlation between genes and clinical traits; G: Correlation plot between module membership and gene significance of genes included in the plum3 module, which contains 252 hub genes. DFS: Disease free survival; DFU: Diabetic foot ulcer; NA: Not available.
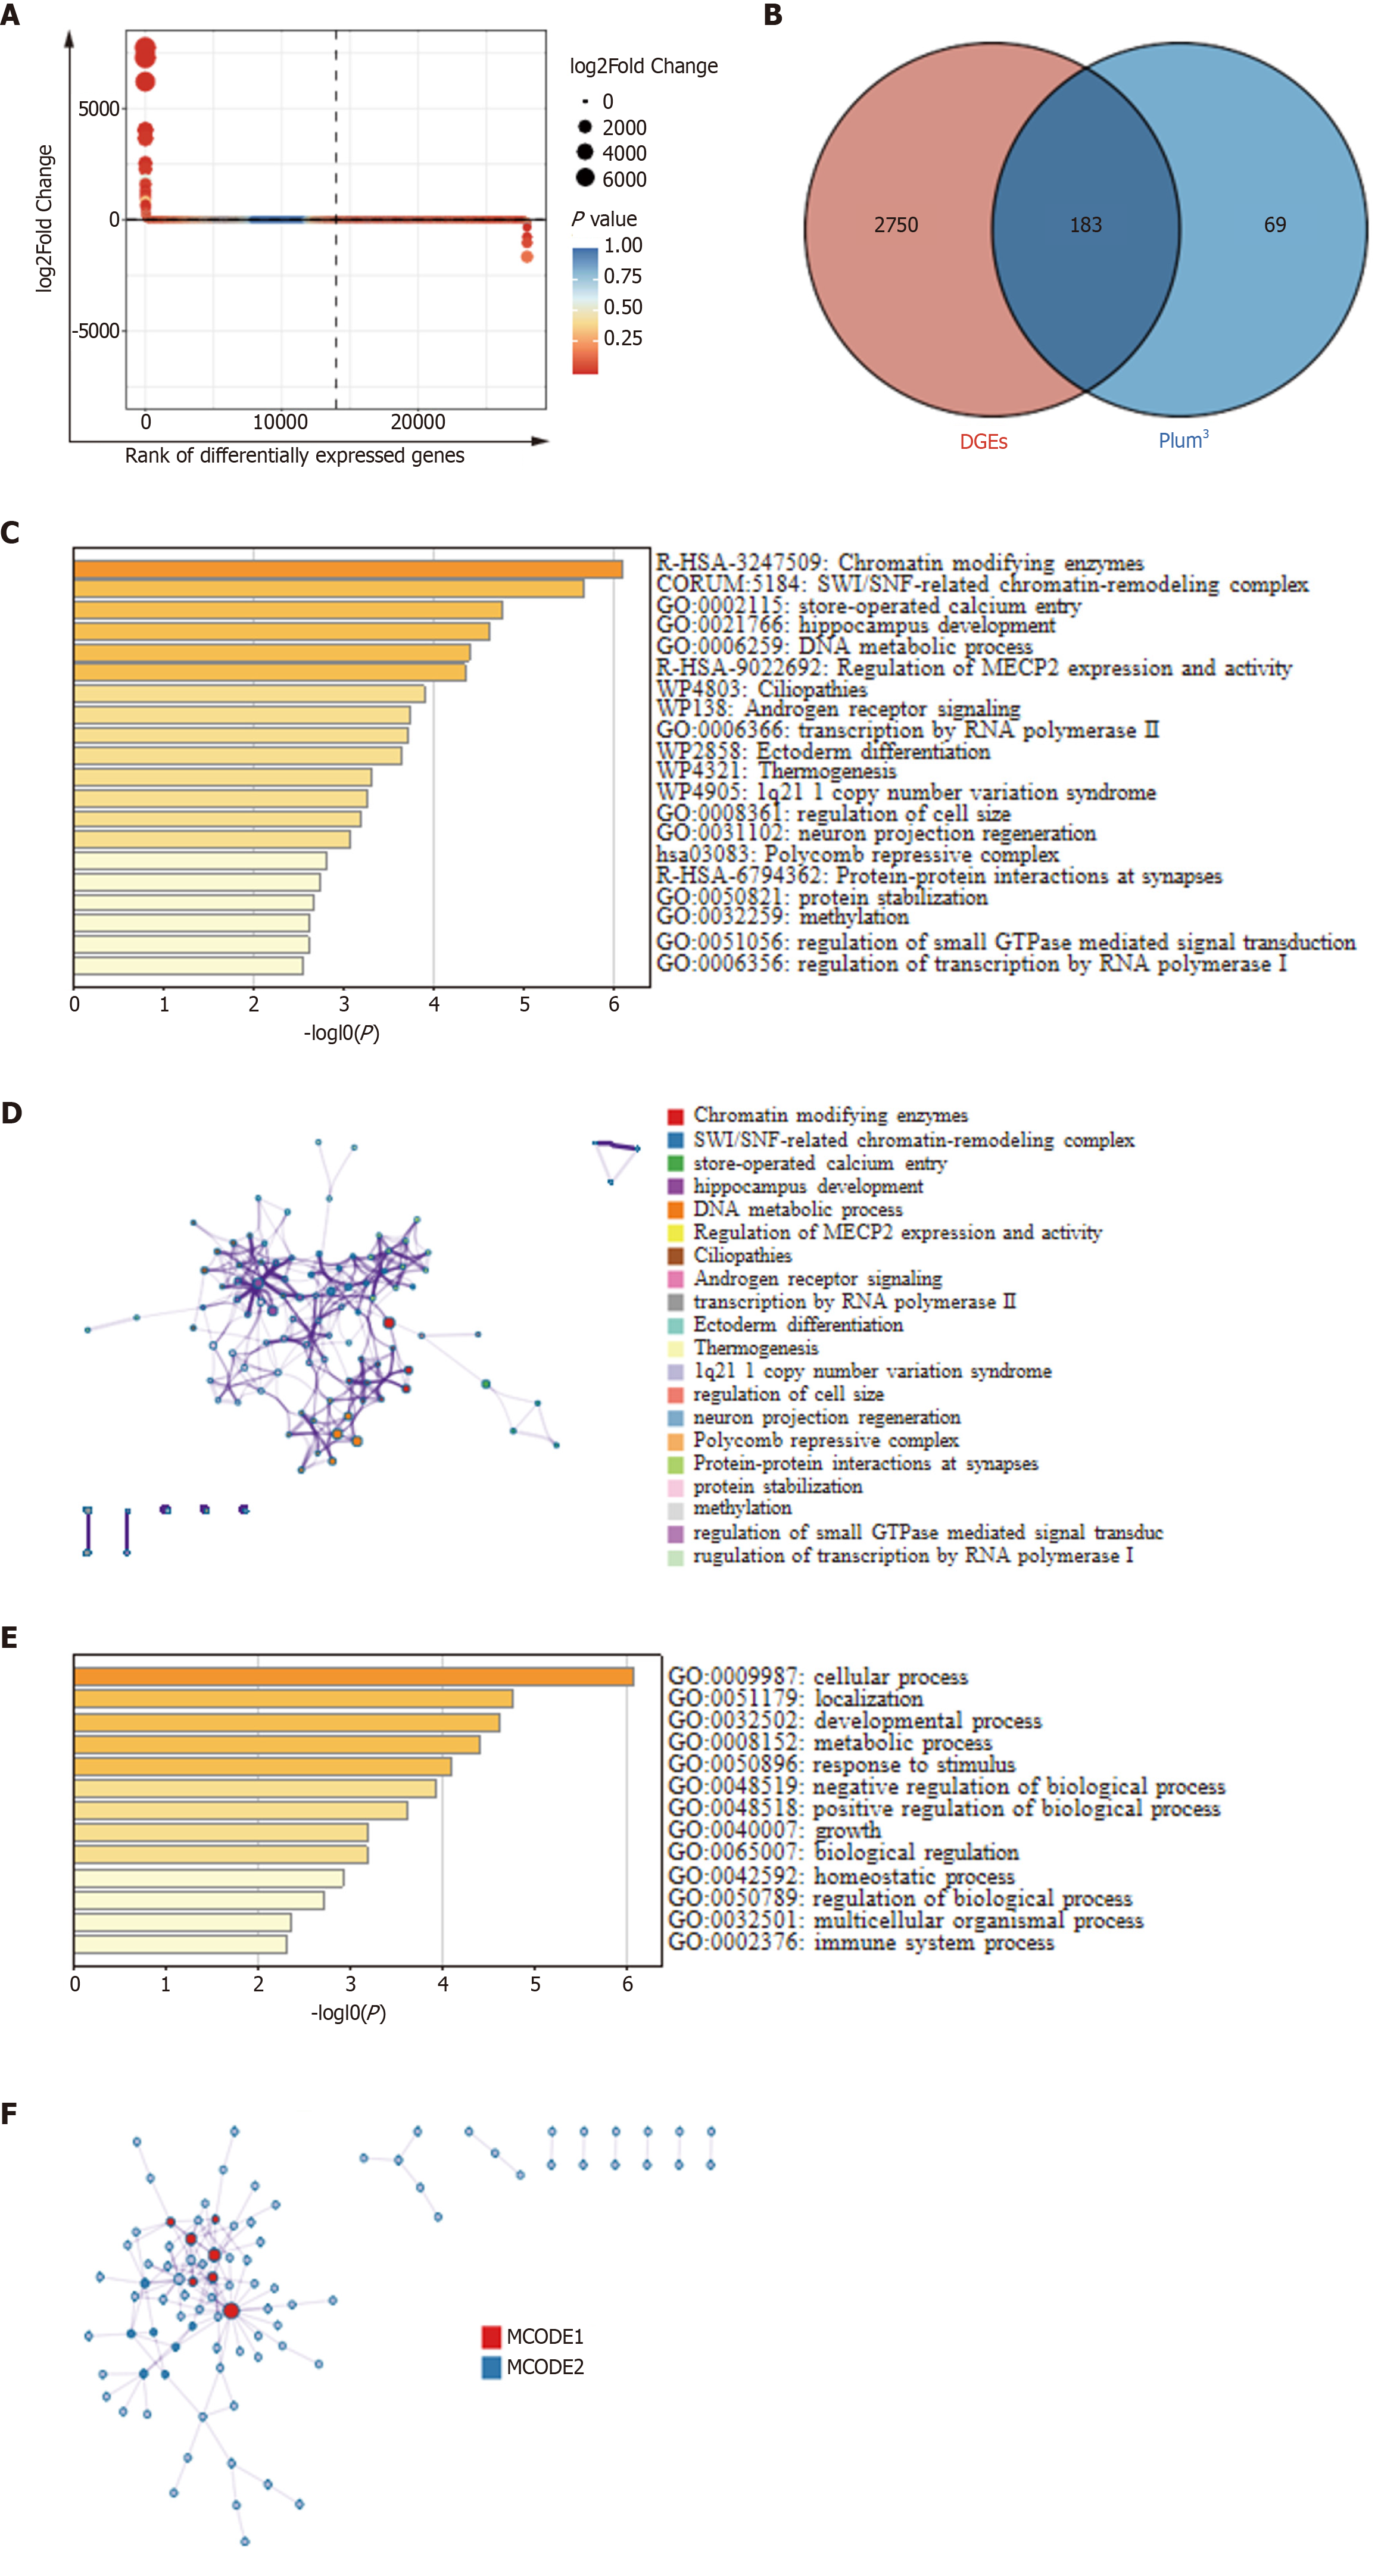
Figure 3 Gene annotation and enrichment analysis.
A: Differentially expressed genes (DEGs) analysis between diabetic foot ulcer group and control group; B: Venn diagram illustrated the intersection among DEGs and the plum3 module, and a total of 183 candidate genes were obtained for subsequent analysis. In this diagram, red denotes DEGs, and blue signifies plum3; C: Metascape bar graph for viewing top nonredundant enrichment clusters, one per cluster, using a discrete color scale to represent statistical significance; D: Network of enriched terms, colored by cluster ID, where nodes that share the same cluster ID are typically close to each other; E: Top-level Gene Ontology biological processes; F: Protein-protein interaction network and molecular complex detection components identified in the gene lists. DGEs: Differentially expressed genes; MECP2: Methyl CpG binding protein 2; GTPase: Guanosine triphosphatase; MCODE: Molecular complex detection.
Figure 4 Immune cell infiltration and correlation analysis in decapping scavenger enzyme and diabetic foot ulcer.
A: Venn diagram illustrated the intersection among differentially expressed genes, the plum3 module, and N7-methylguanosine (m7G)-related genes, identifying decapping scavenger enzyme (DCPS) as a key candidate gene within the m7G-diabetic foot ulcer (DFU) category. In this diagram, red denotes differentially expressed genes, blue signifies plum3, and yellow indicates genes from the m7G; B: Differences in DCPS gene expression between DFU and control groups within the training set; C: Differences in DCPS gene expression between DFU and control groups in the validation set GSE7014; D: Receiver operating characteristic curve for DCPS in GSE134431; E: Receiver operating characteristic curve of DCPS in GSE7014; F-H: Stacked bar chart of the immune cell, the correlation matrix of immune cell proportions and the box plot of the DCPS related immune cell proportions in data set GSE134431; I-K: Stacked bar chart of the immune cell, the correlation matrix of immune cell proportions and the box plot of the DCPS related immune cell proportions in data set GSE7014. m7G: N7-methylguanosine; DCPS: Decapping scavenger enzyme; DGEs: Differentially expressed genes; DFU: Diabetic foot ulcer; NK cell: Natural killer cell.
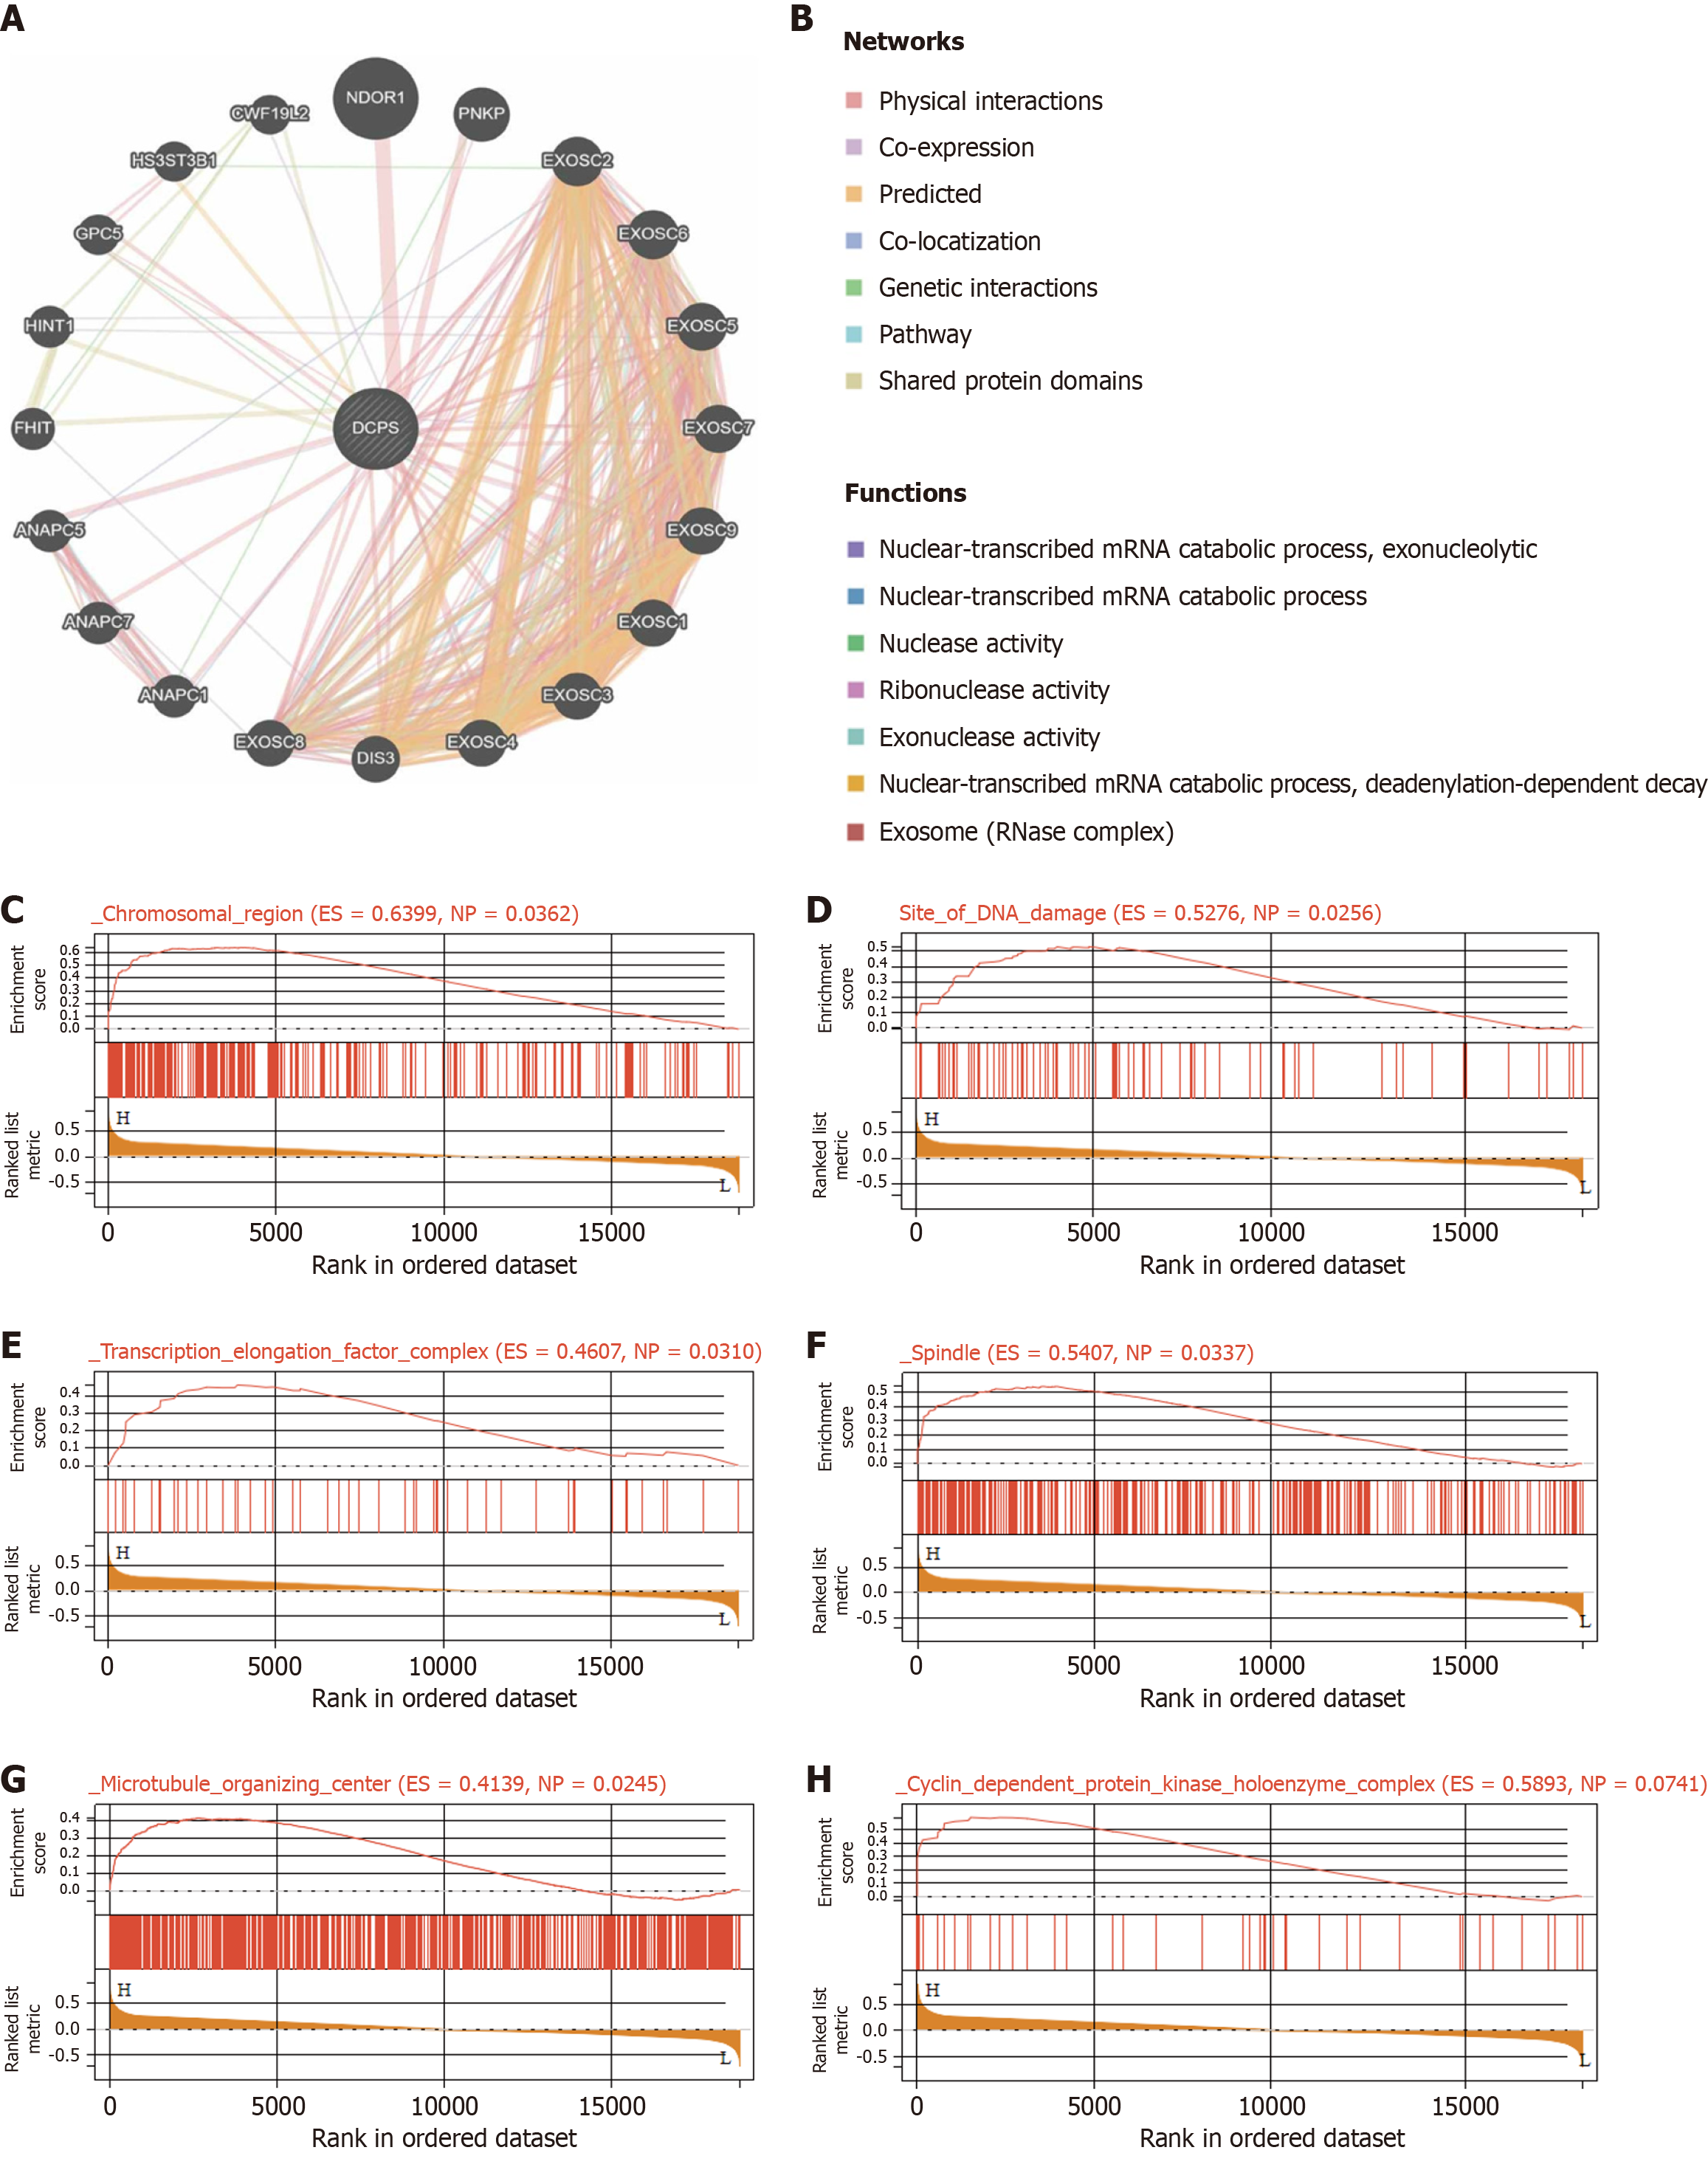
Figure 5 Analysis of decapping scavenger enzyme related genes and functions.
A and B: Coexpressed genes of decapping scavenger enzyme were analyzed by Gene MANIA; C-H: Enrichment maps from genomic gene set enrichment analysis enrichment analysis in diabetic foot ulcer. RNase: Ribonuclease; ES: Enrichment score; NP: Nominal P value.
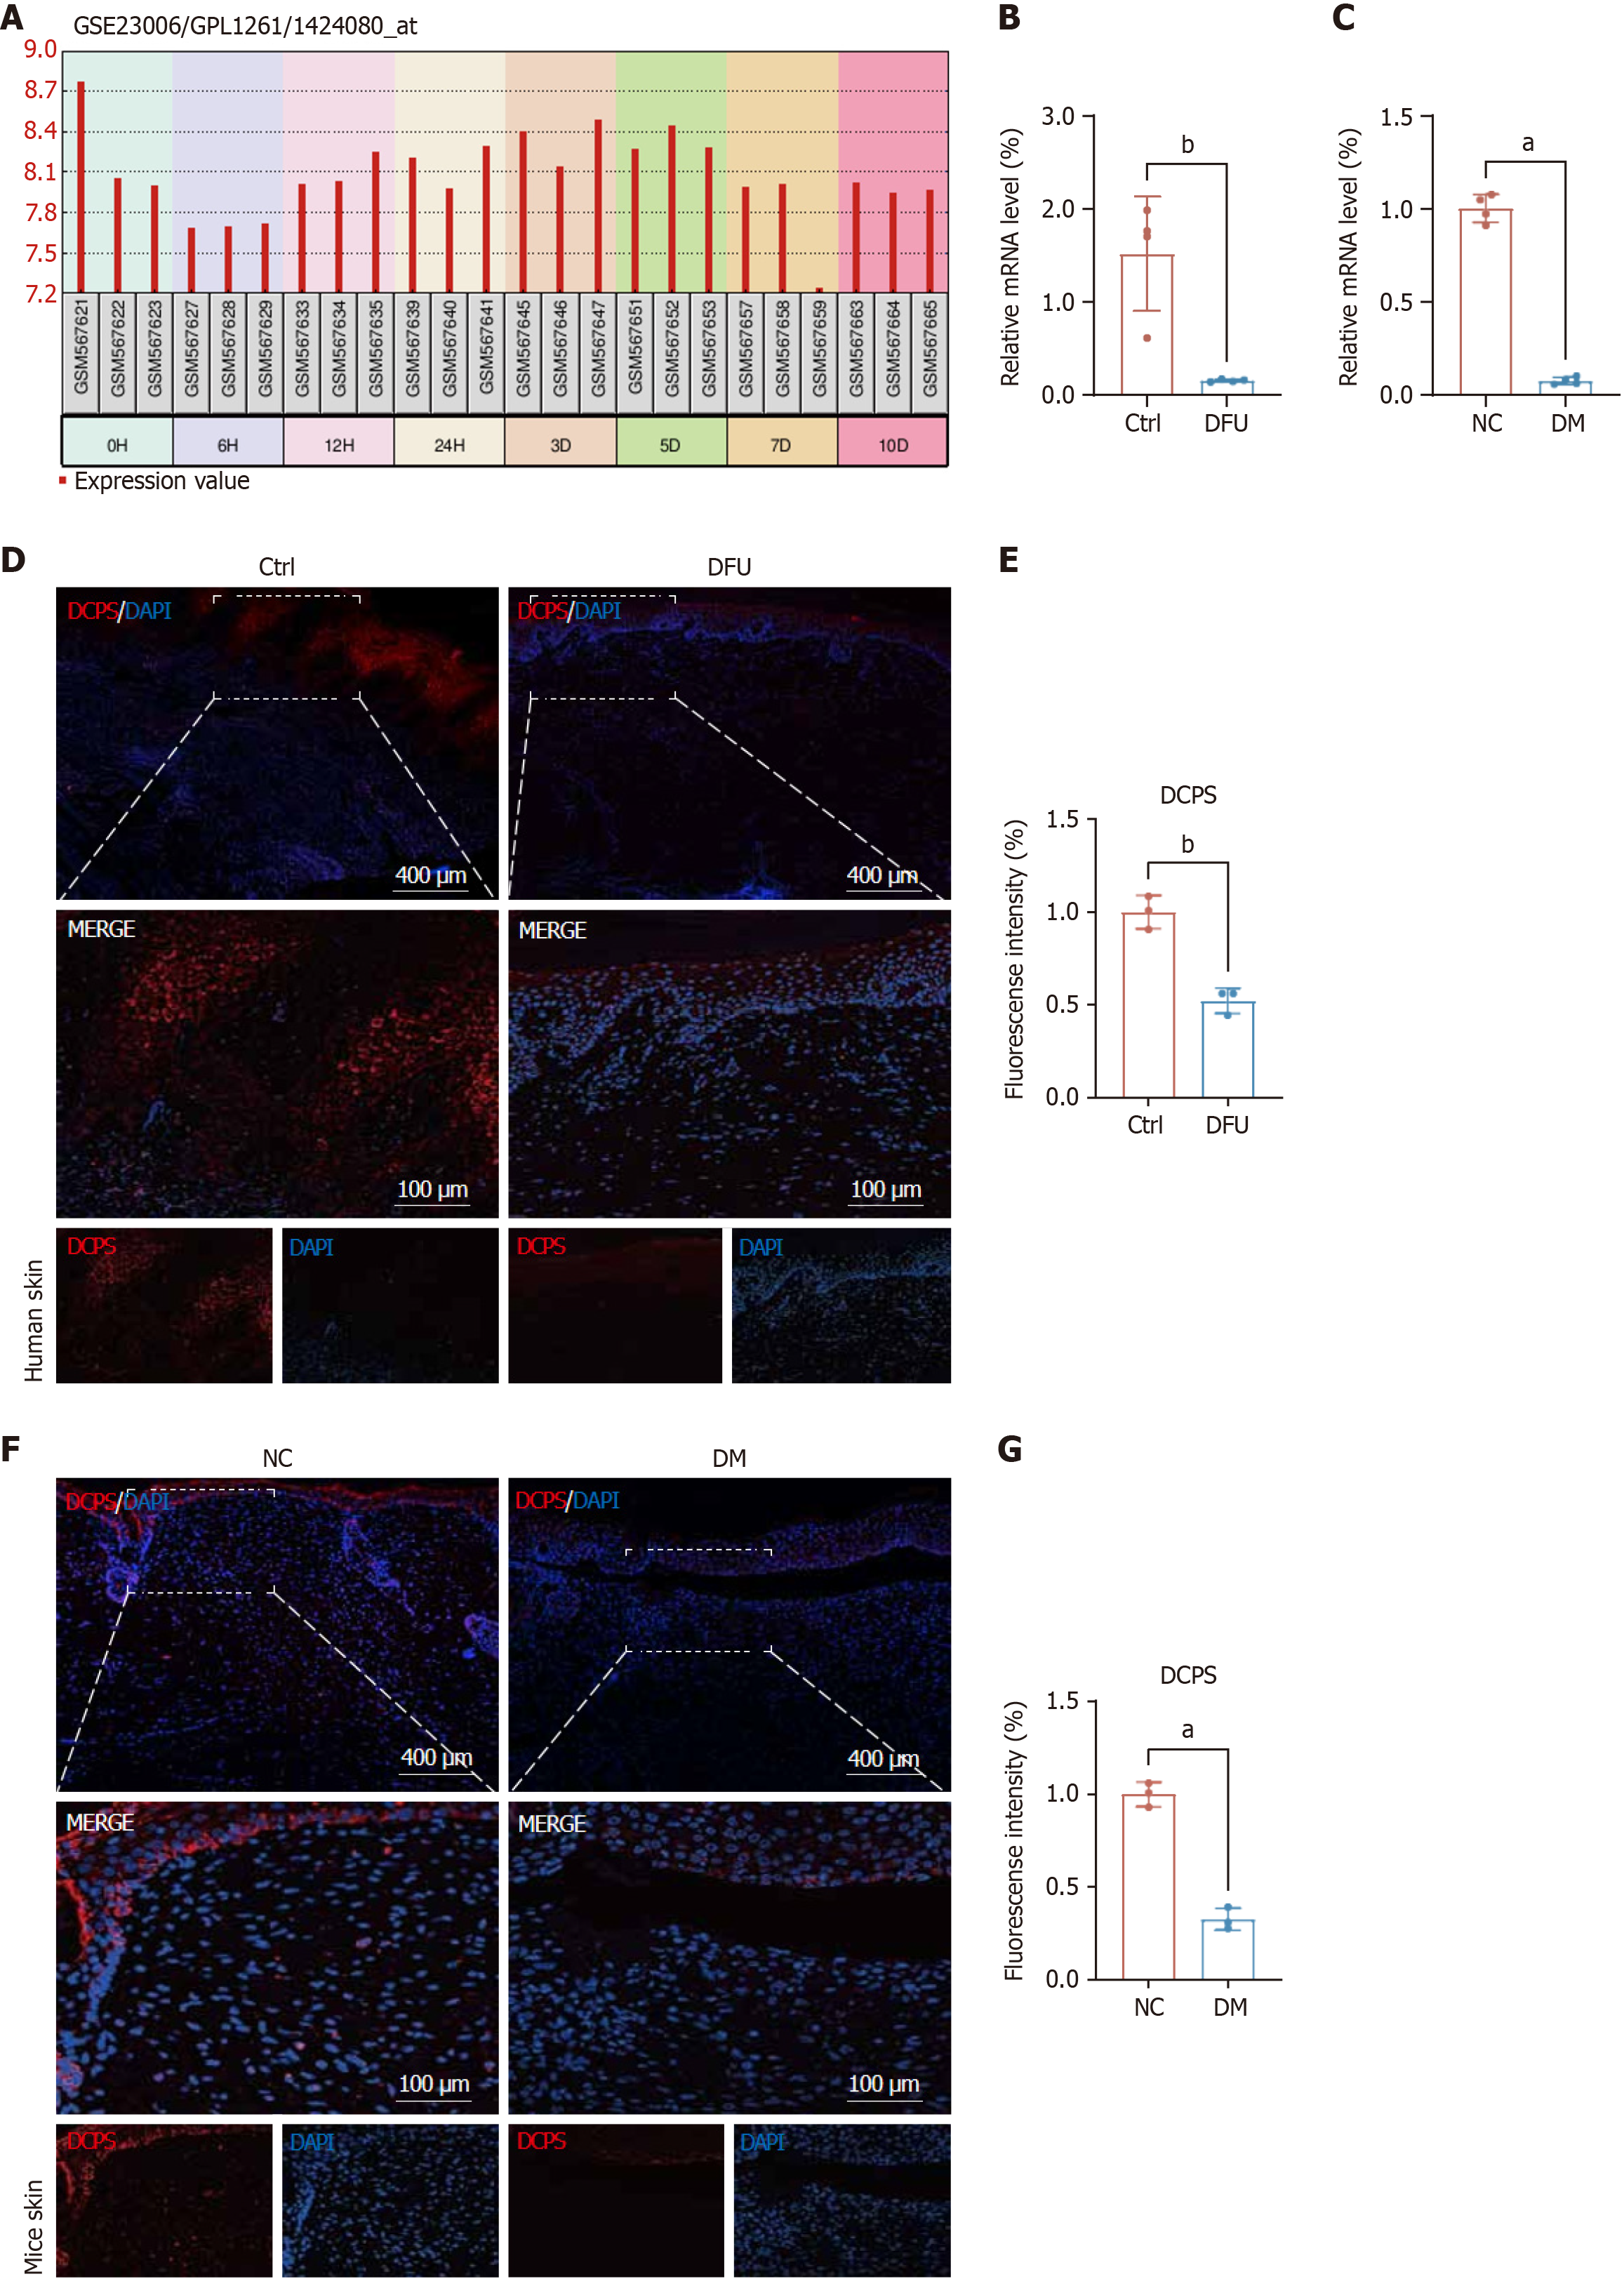
Figure 6 Validation of decapping scavenger enzyme expression in skin wounds.
A: Decapping scavenger enzyme (DCPS) mRNA expression decreased significantly at 6 hours post-injury and gradually recovered during wound healing; B and C: DCPS expression was reduced in skin tissues of both diabetic foot ulcer patients and diabetic mice at the RNA level, n = 3; D and E: Immunofluorescence analysis revealed reduced DCPS (red) expression in human diabetic skin tissues, n = 3 (scale bar: 400 μm); F and G: Immunofluorescence revealed reduced DCPS (red) expression in diabetic mouse skin tissues, n = 3 (scale bar: 400 μm). Statistical analyses were performed using GraphPad Prism 8. The results were expressed as mean ± SD. DFU: Diabetic foot ulcer; DCPS: Decapping scavenger enzyme; DM: Diabetes mellitus; NC: Negative control. aP < 0.001, and bP < 0.01.
Figure 7 Assessment of normal epidermal keratinocyte function following decapping scavenger enzyme knockdown in vitro.
Cells were treated with 30 mmol/L glucose for 48 hours before being exposed to siDCPS [small interfering RNA targeting decapping scavenger enzyme (DCPS)] for 24 hours. A: Dot blot assay showed downregulation of N7-methylguanosine under diabetic condition; B: Efficient DCPS knockdown by small interfering RNA (n = 4). Evaluate cell cycle distribution changes induced by DCPS knockdown; C and D: DCPS knockdown induced significant G2 phase arrest in cell cycle, n = 3; E-G: DCPS knockdown reduced cyclin-dependent kinase 6 and cyclin D1 protein expression, n = 3; H and I: DCPS knockdown compromises RNA stability of cyclin D1 and cyclin-dependent kinase 6 transcripts. Assess the impact of DCPS knockdown on cellular proliferation; J and K: 5-ethynyl-2’-deoxyuridine staining and statistical analyses in normal epidermal keratinocytes (NHEKs), n = 4 (scale bar: 100 μm); L and M: DCPS knockdown attenuated cellular proliferation in flow cytometry assays, n = 3; N and O: DCPS knockdown enhanced apoptosis in flow cytometry, n = 3. DCPS knockdown inhibits NHEK migration; P and Q: Transwell assays were conducted for evaluation of NHEK migration, n = 3 (scale bar: 100 μm); R-U: Cell scratch assays were observed in living cells at 0, 12, 24 and 48 hours, n = 3 (scale bar: 200 μm). The results were expressed as mean ± SD. NC: Negative control; HG: High glucose; m7G: N7-methylguanosine; siDCPS: Small interfering RNA targeting decapping scavenger enzyme; RMSD: Root mean square deviation; CDK6: Cyclin-dependent kinase 6; 7-AAD: 7-Aminoactinomycin D. aP < 0.001, bP < 0.01, and cP < 0.05.
- Citation: Xiao FG, Yang Z, Yu SY, Li Q, Huang PC, Huang GB, Li XG, Ran JL, Rui SL, Deng WQ. N7-methylguanosine-related gene decapping scavenger enzymes as a novel biomarker regulating epithelial cell function in diabetic foot ulcers. World J Diabetes 2025; 16(11): 109455
- URL: https://www.wjgnet.com/1948-9358/full/v16/i11/109455.htm
- DOI: https://dx.doi.org/10.4239/wjd.v16.i11.109455


