©The Author(s) 2025.
World J Diabetes. Oct 15, 2025; 16(10): 110631
Published online Oct 15, 2025. doi: 10.4239/wjd.v16.i10.110631
Published online Oct 15, 2025. doi: 10.4239/wjd.v16.i10.110631
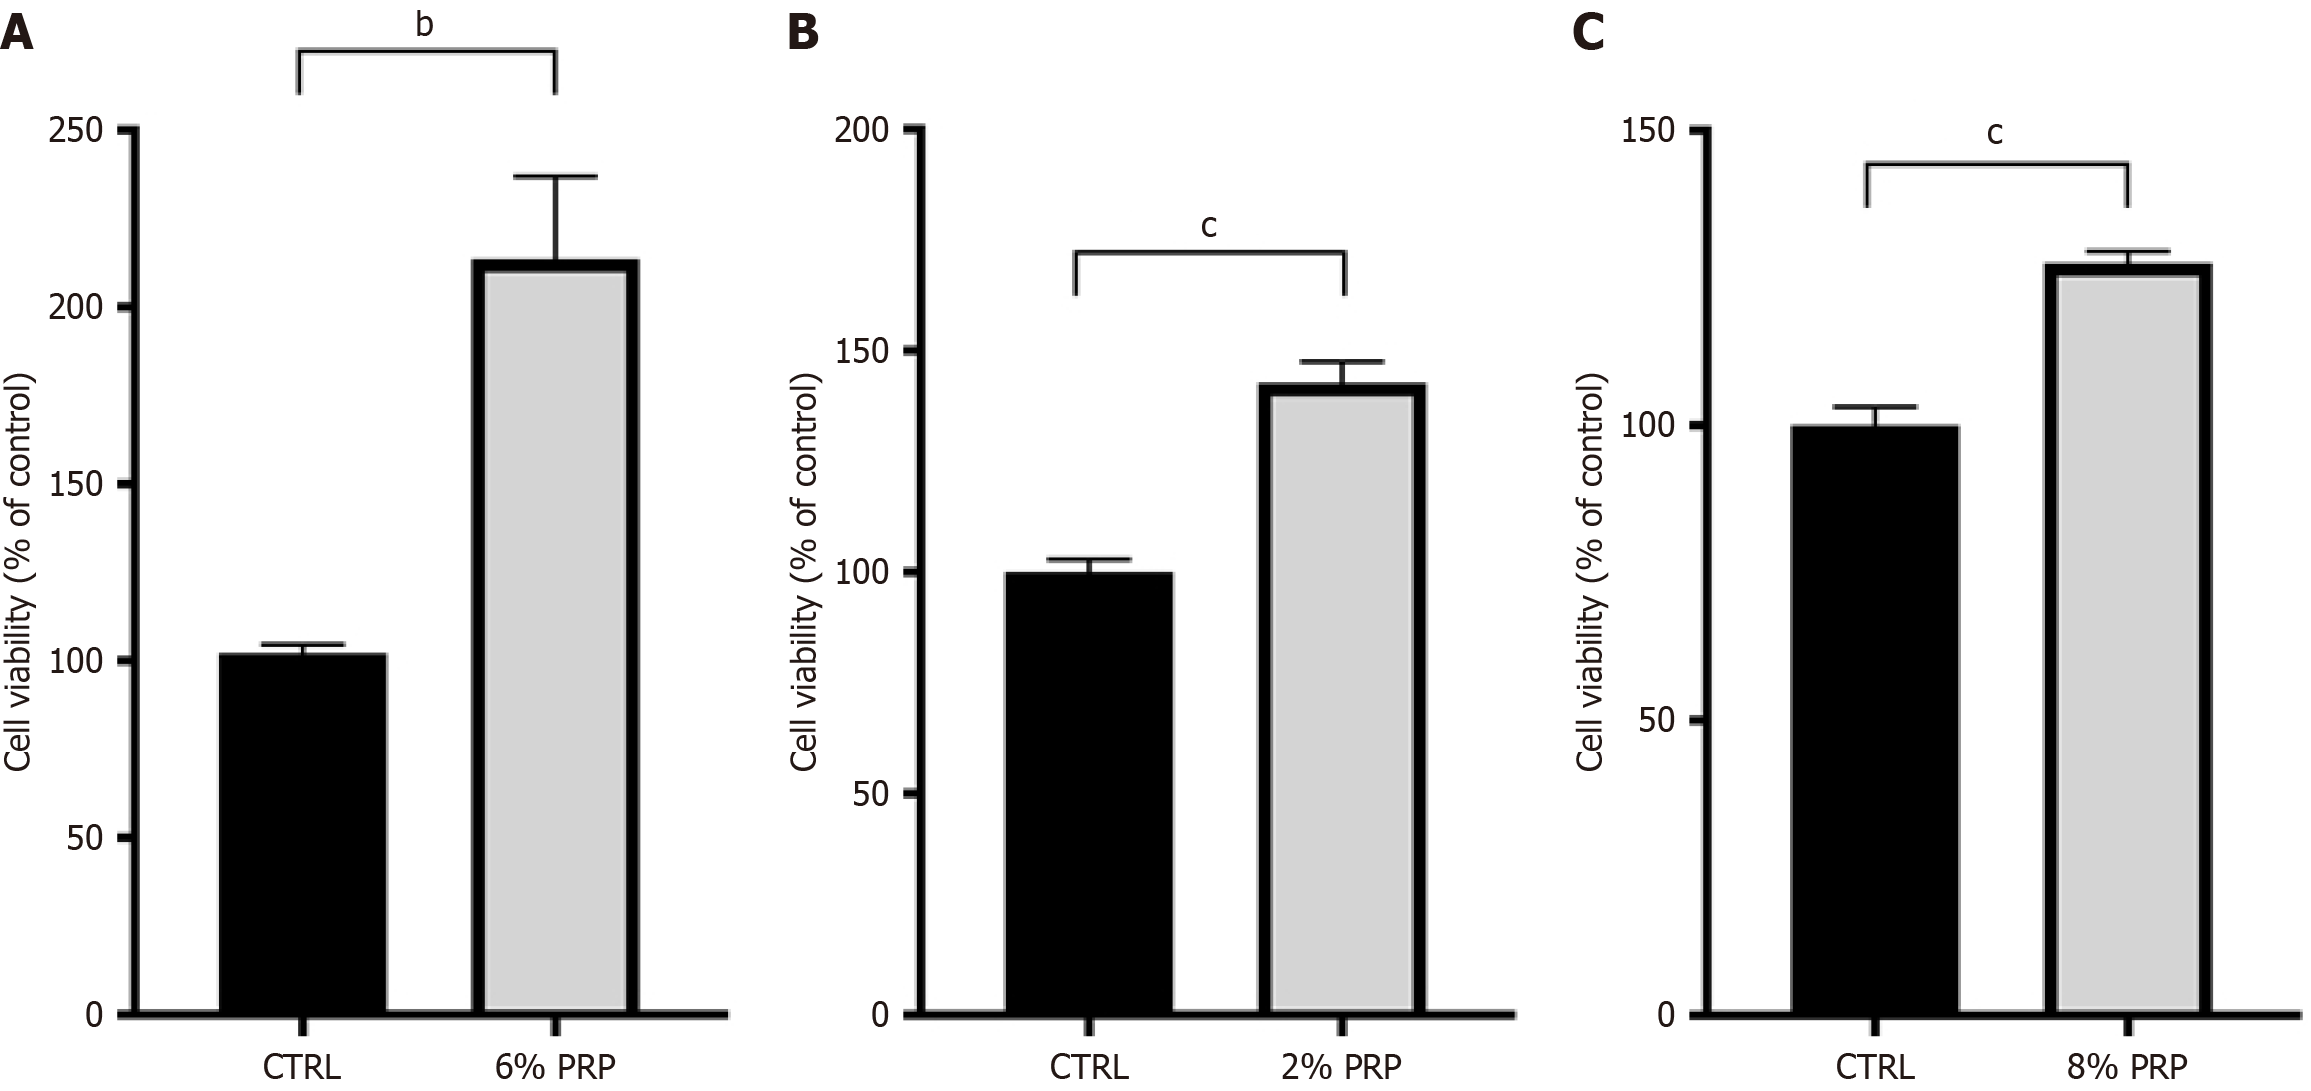
Figure 1 Screening of the optimal concentration of platelet-rich plasma for promoting the proliferation of human umbilical vein endothelial cells, human dermal fibroblasts, and human immortalized keratinocytes.
A: Viability of human umbilical vein endothelial cells; B: Viability of human dermal fibroblasts; C: Viability of human immortalized keratinocytes. Significant differences in experimental data were analyzed using conventional one-way analysis of variance. All assays were performed in triplicate. bP < 0.01 vs the control (CTRL) group; cP < 0.001 vs CTRL group. PRP: Platelet-rich plasma.
Figure 2 Platelet-rich plasma promotes the proliferation of various cells under high-glucose conditions.
A: Viability of human umbilical vein endothelial cells; B: Human dermal fibroblasts; C: Human immortalized keratinocytes. Significant differences in experimental data were analyzed using t tests, and all assays were performed in triplicate. bP < 0.01 vs the control (CTRL); cP < 0.001 vs CTRL group. PRP: Platelet-rich plasma; CTRL: The control group.
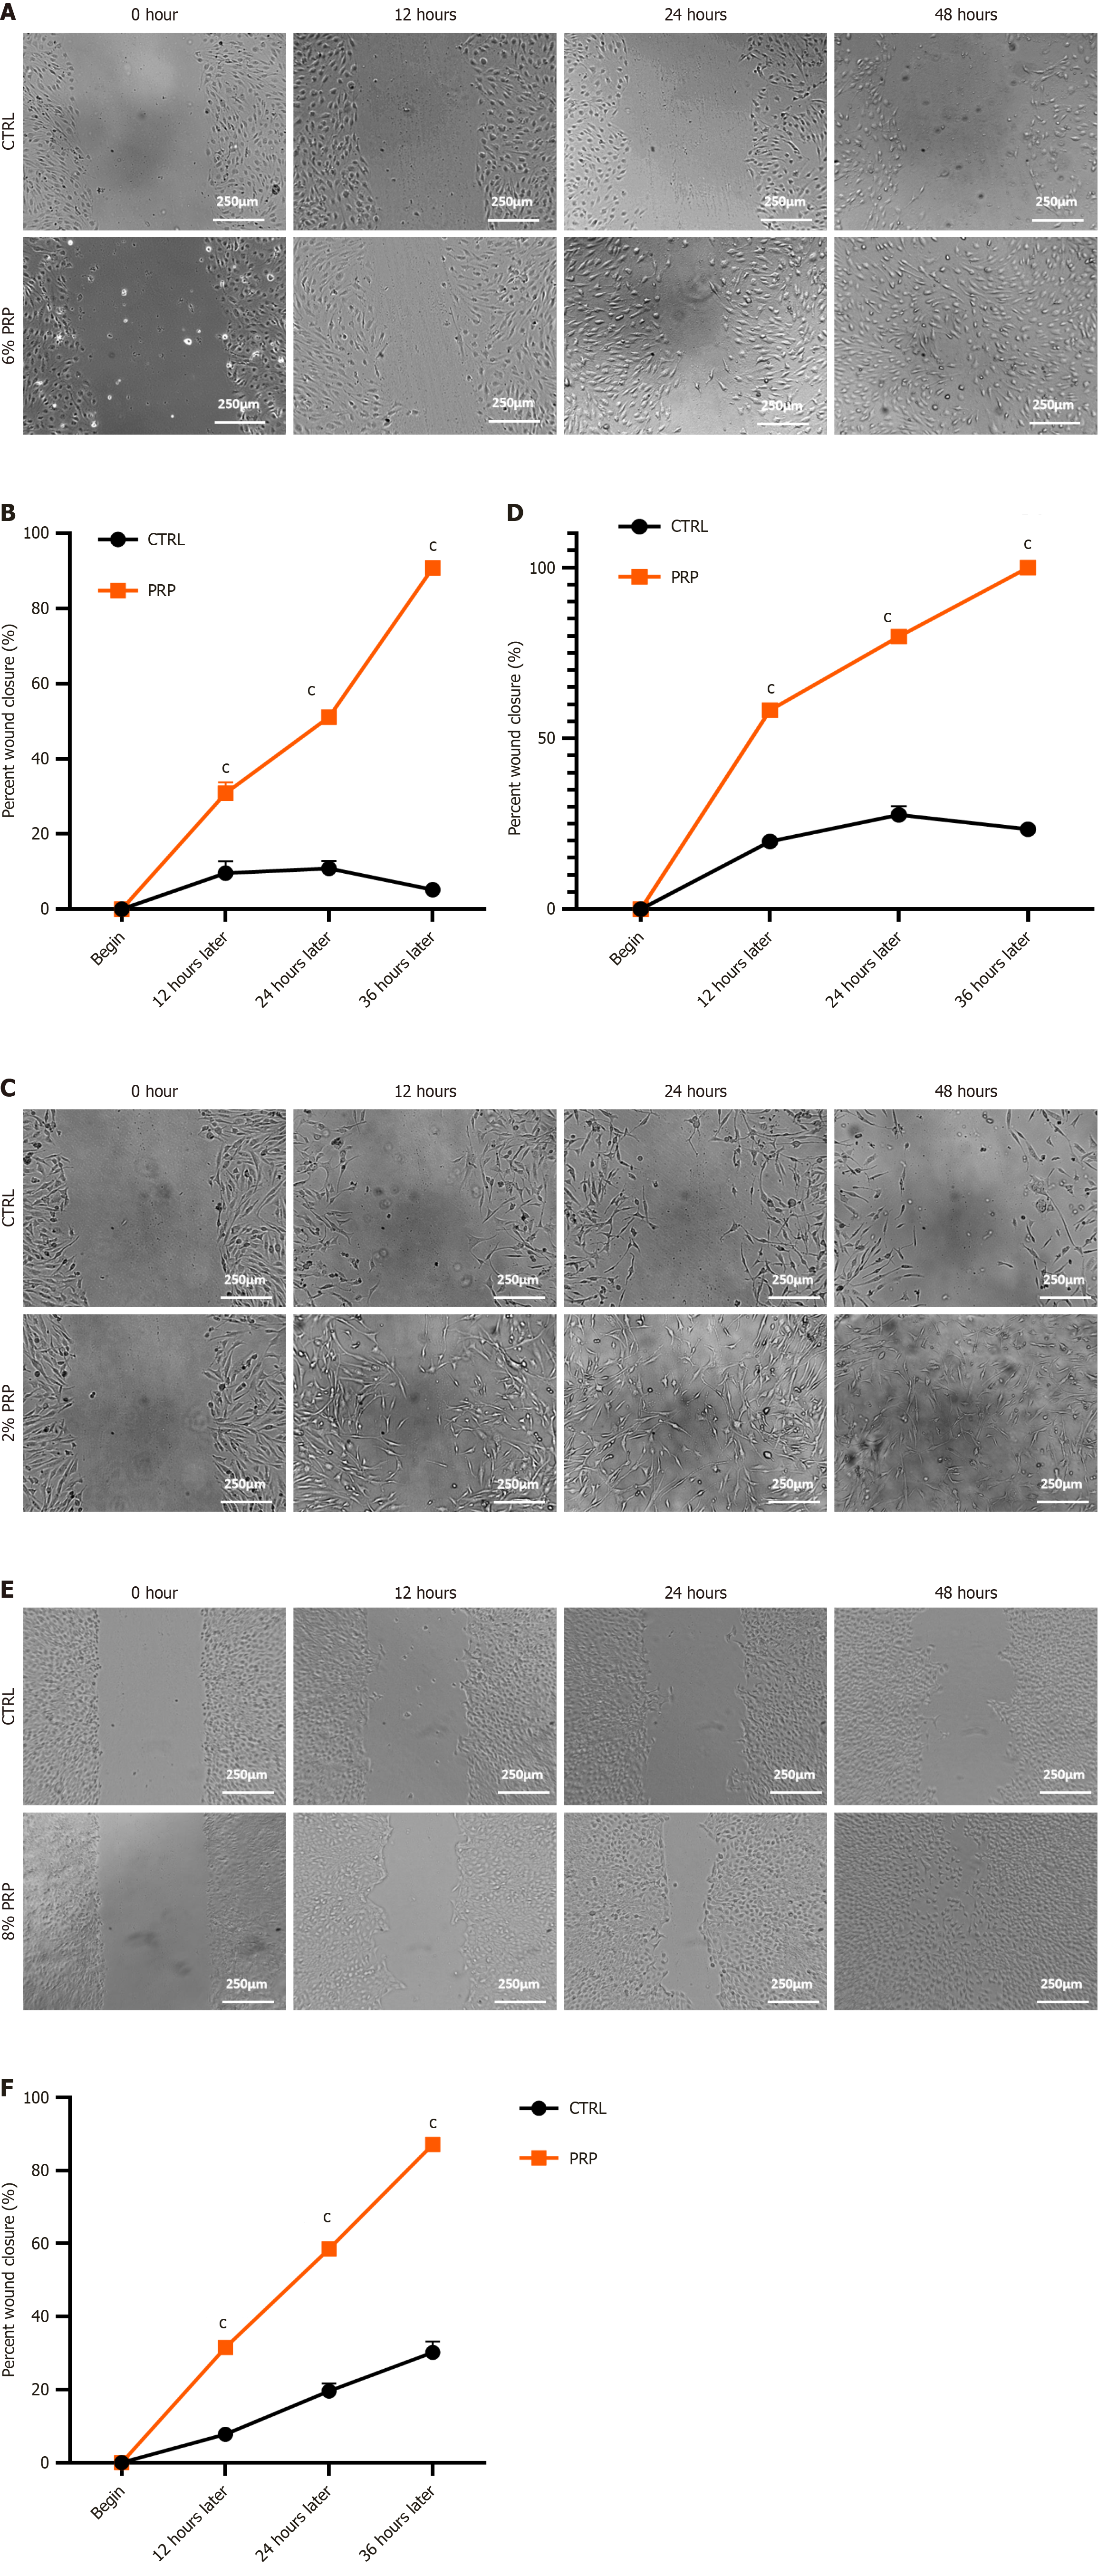
Figure 3 Cell migration assay.
A: Migration status of human umbilical vein endothelial cells (HUVECs) in the control and platelet-rich plasma (PRP)-treated groups under high-glucose conditions; B: Statistical analysis of migration data of HUVECs in the control and PRP-treated groups under high-glucose conditions; C: Migration status of human dermal fibroblasts (HSFs) in the control and PRP-treated groups under high-glucose conditions; D: Statistical analysis of migration data of HSFs in the control and PRP-treated groups under high-glucose conditions; E: Migration status of human immortalized keratinocytes (HaCaTs) in the control and PRP-treated groups under high-glucose conditions; F: Statistical analysis of migration data of HaCaTs in the control and PRP-treated groups under high-glucose conditions. Significant differences in experimental data were analyzed using two-way analysis of variance, and all assays were performed in triplicate. cP < 0.001 vs the control group. The magnification of the inverted microscope was 100 ×. CTRL: The control group; PRP: Platelet-rich plasma.
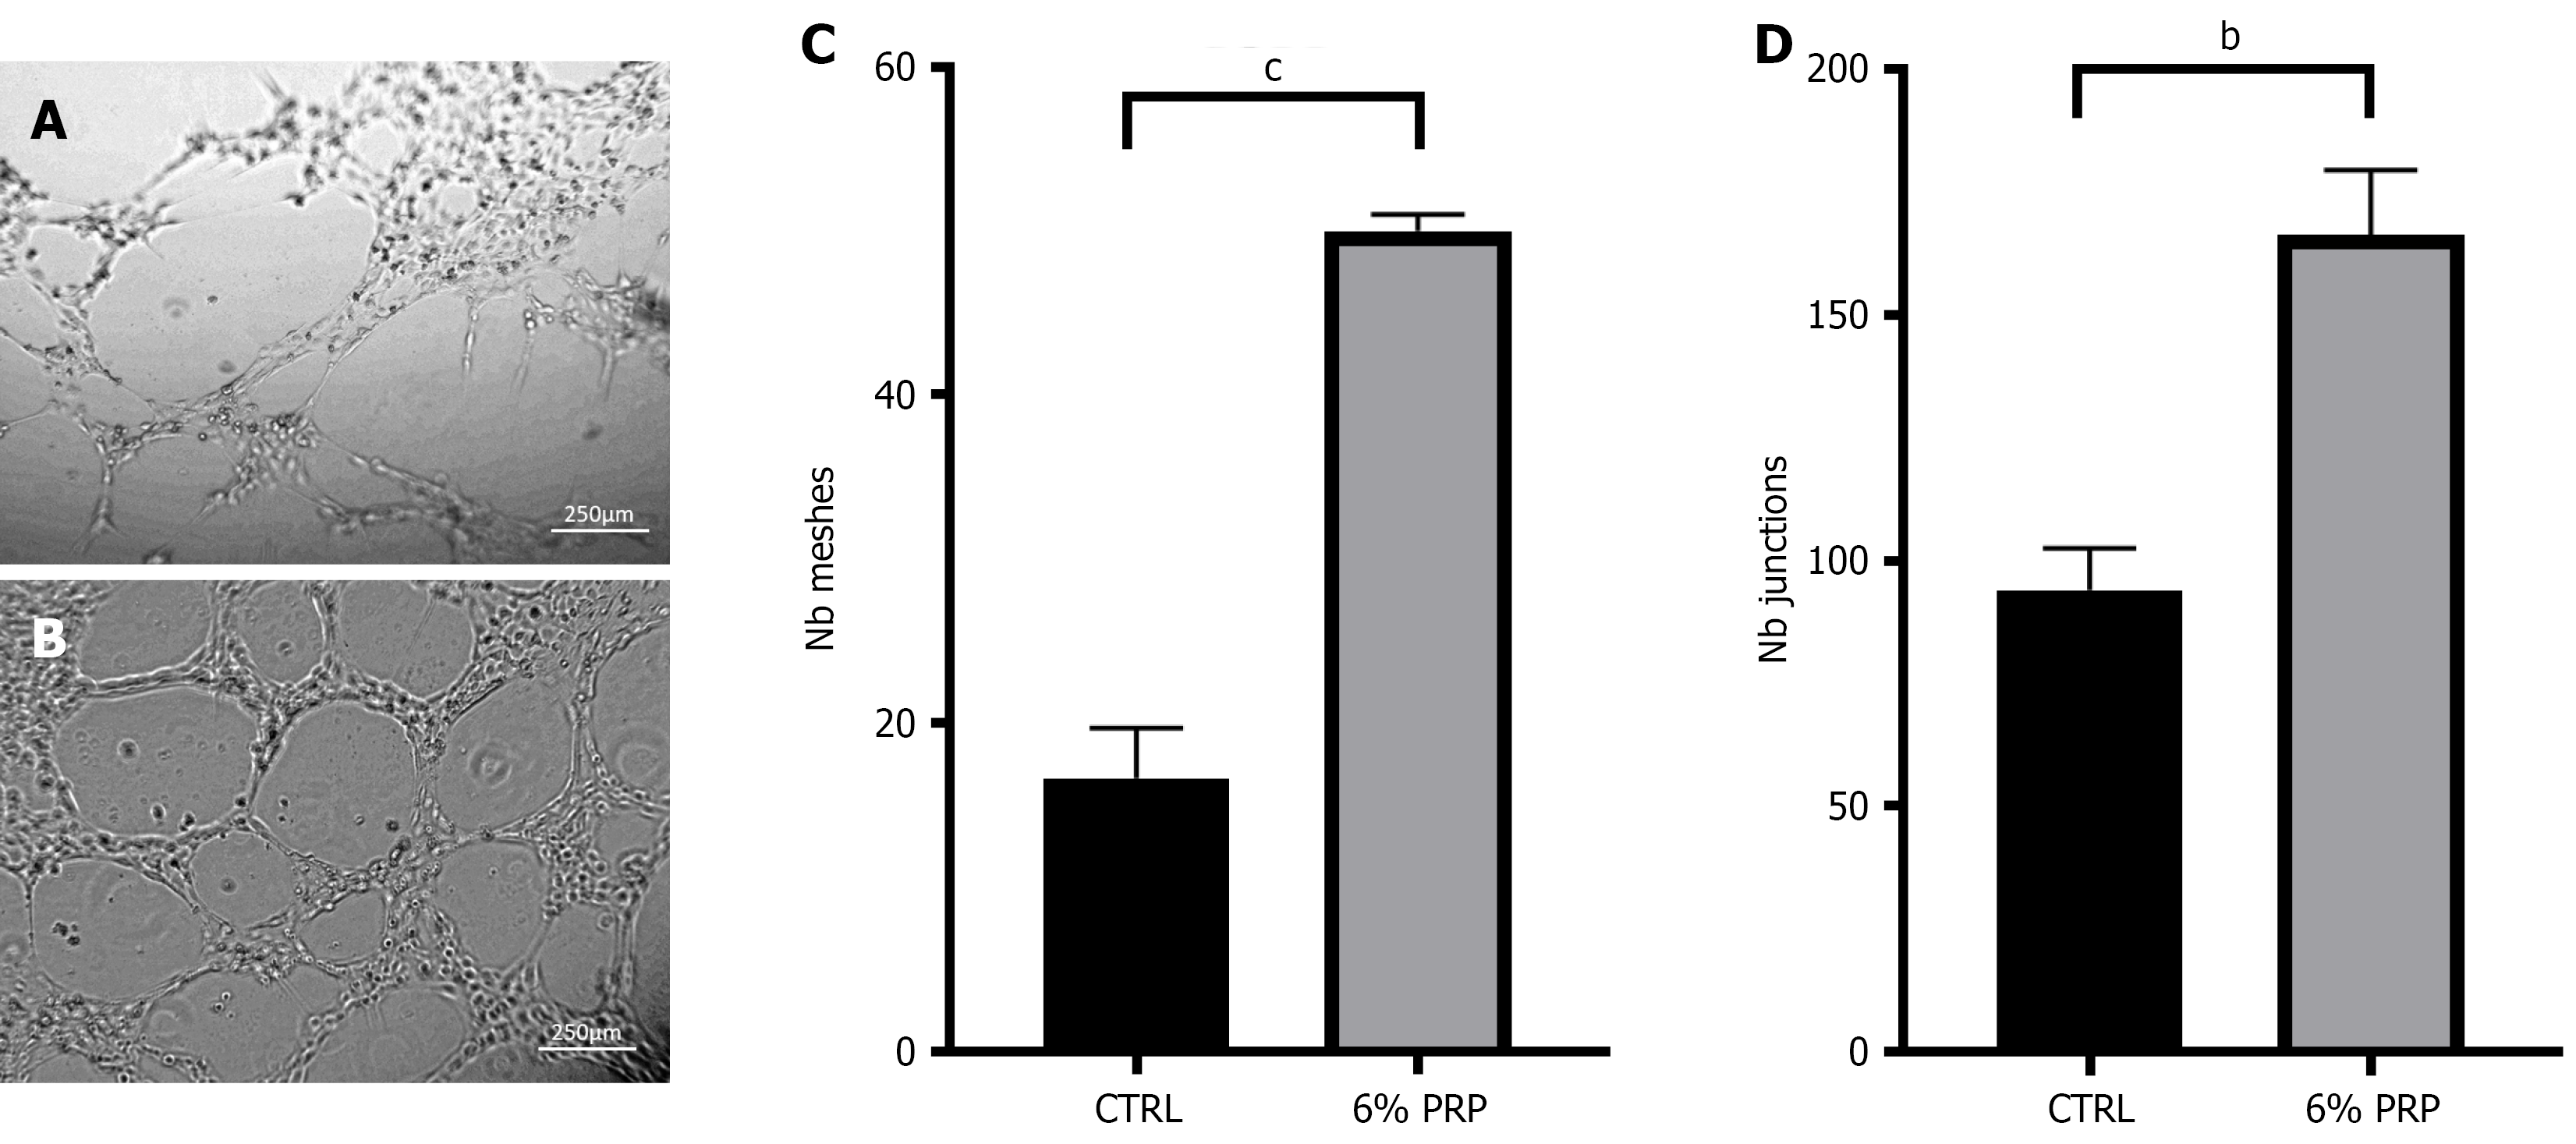
Figure 4 Tube formation assay of human umbilical vein endothelial cells.
A and B: Observation of tube formation in the (A) control group and (B) platelet-rich plasma (PRP)-treated group of human umbilical vein endothelial cells; C: Analysis of mesh number in the control and PRP-treated groups; D: Analysis of node number in the control and PRP-treated groups. Significant differences in experimental data were analyzed using t tests, and all assays were performed in triplicate. bP < 0.01 vs the control (CTRL); cP < 0.001 vs the CTRL group. The magnification of the inverted microscope was 100 ×. CTRL: The control group; PRP: Platelet-rich plasma.
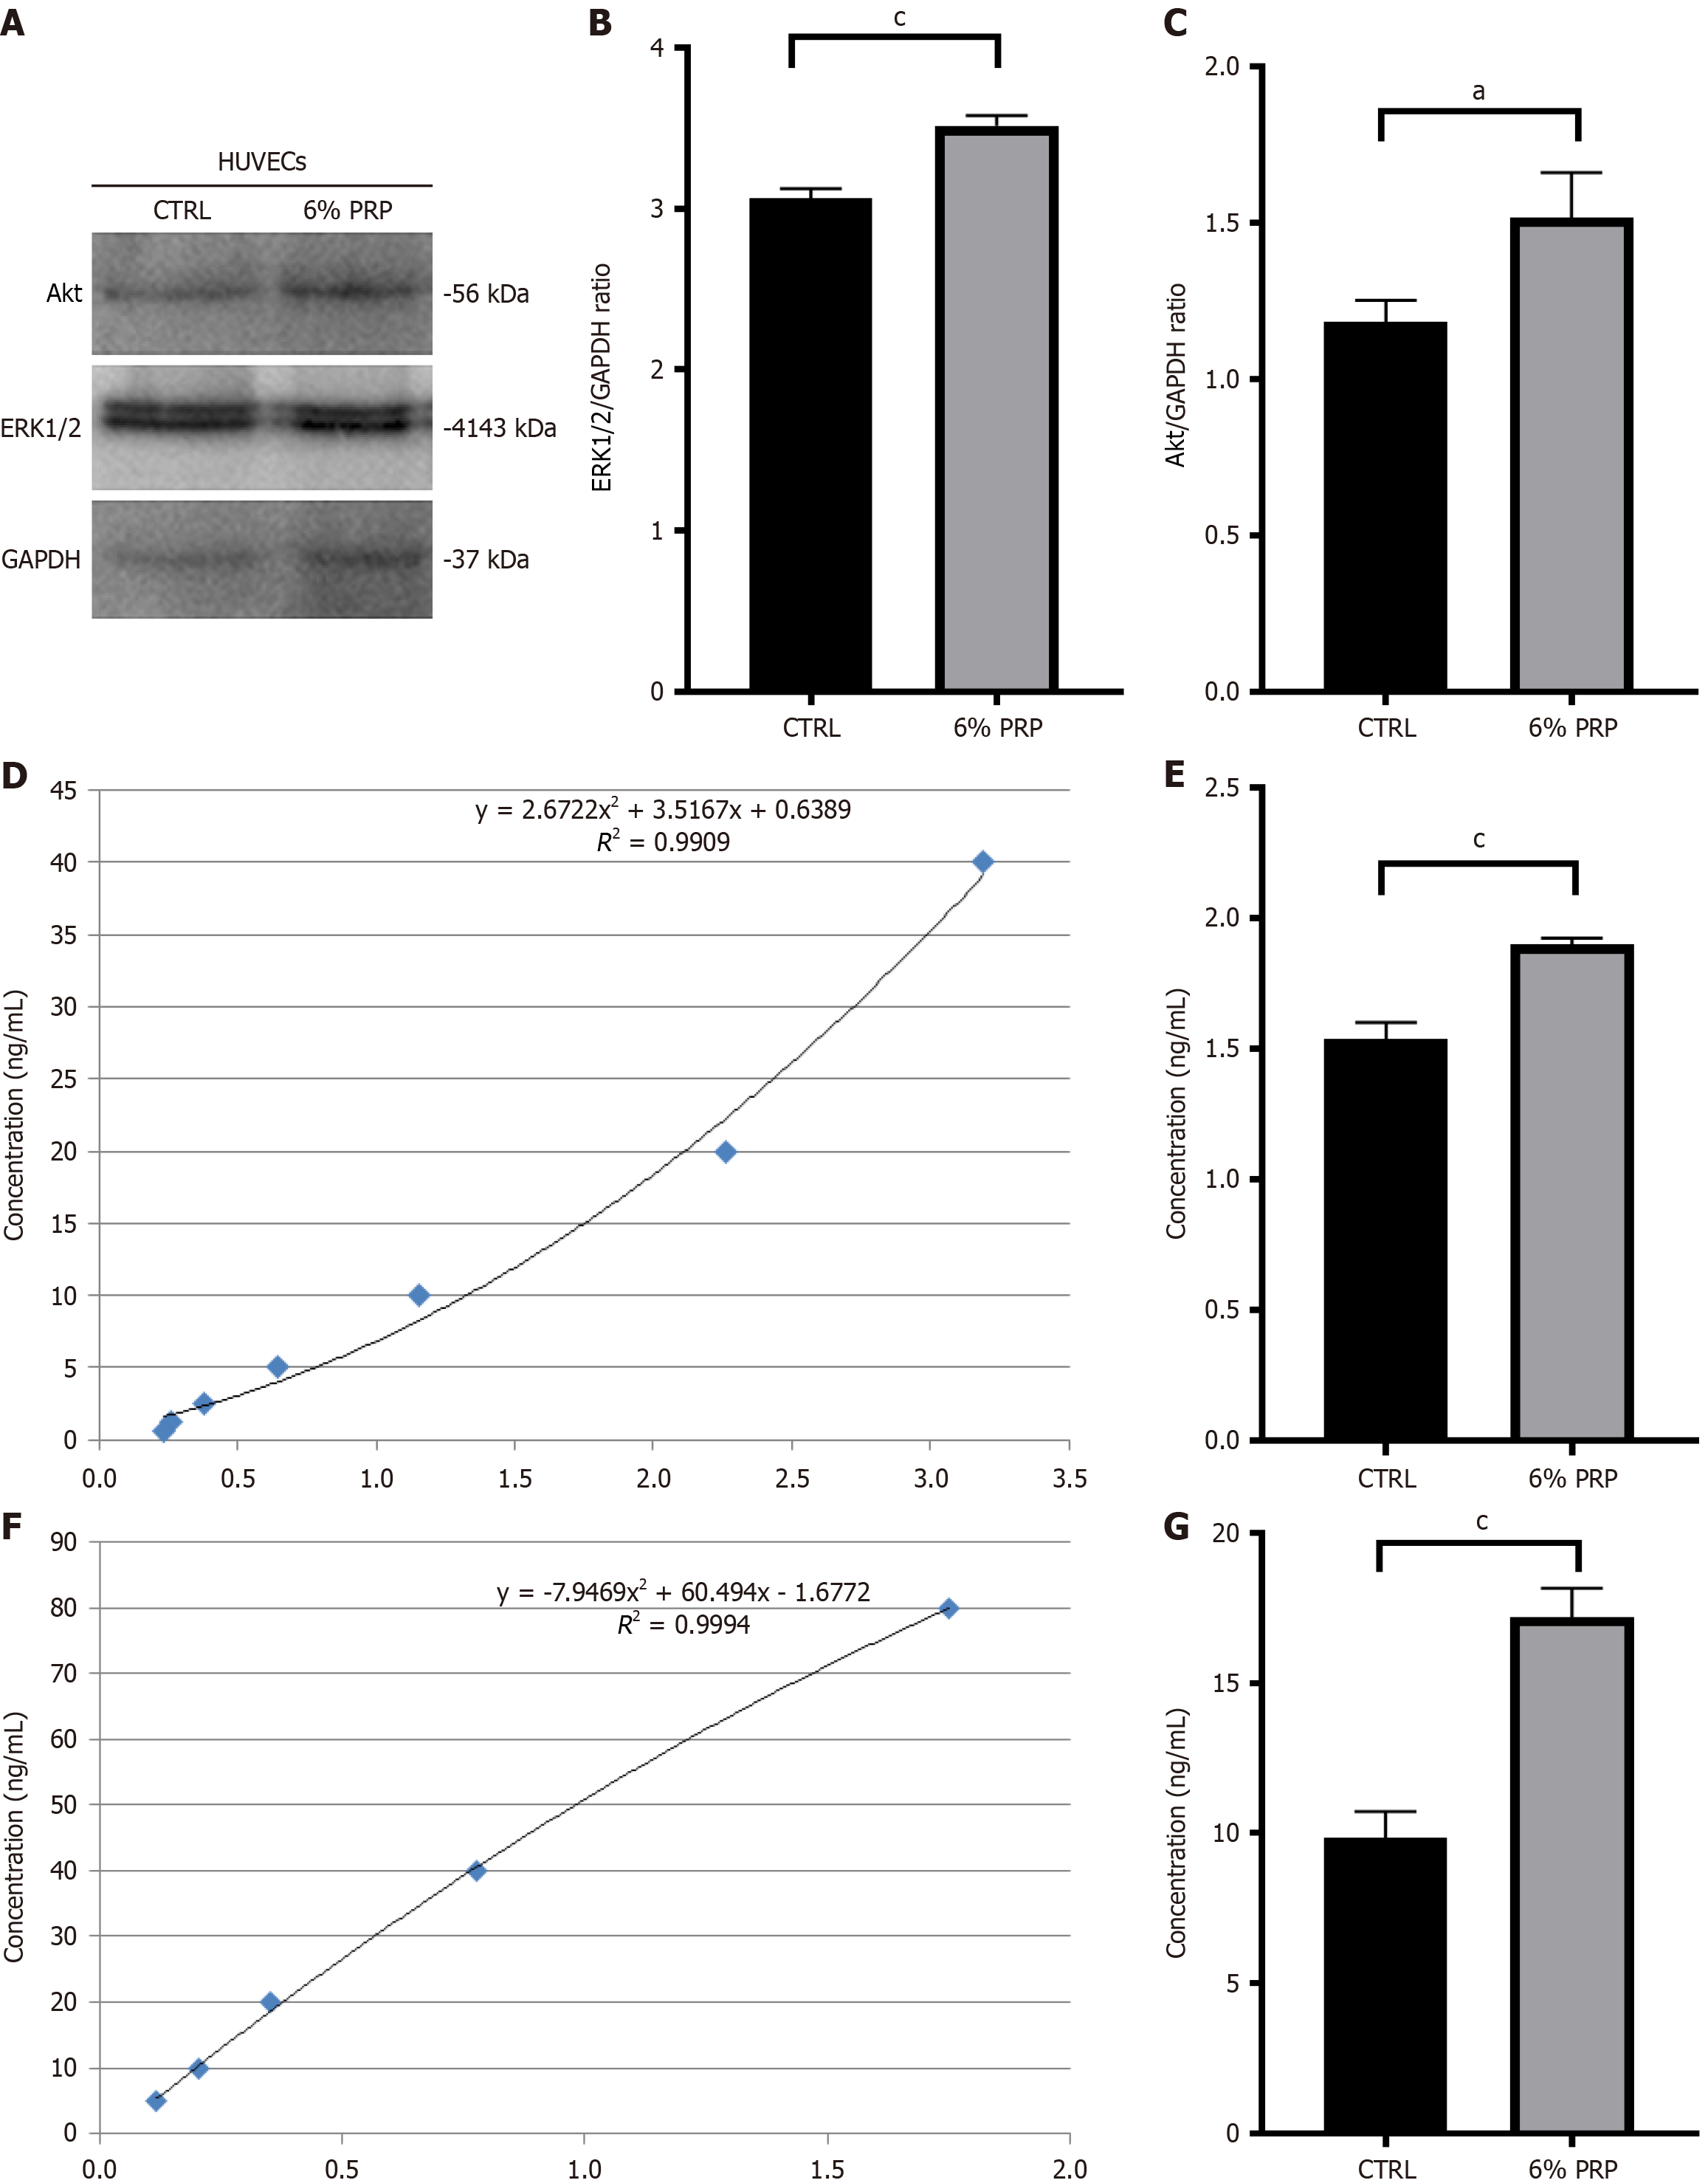
Figure 5 Validation of the vascular endothelial growth factor receptor signaling pathway in human umbilical vein endothelial cells.
A: Visualization of the relative expression levels of Ak strain transforming (Akt) and extracellular regulated protein kinases 1/2 (ERK1/2) in human umbilical vein endothelial cells (HUVECs) in each treatment group; B: Statistical analysis of the relative expression levels of ERK1/2 in HUVECs in each treatment group; C: Statistical analysis of the relative expression levels of Akt in HUVECs in each treatment group; D: Standard curve of vascular endothelial growth factor receptor (VEGFR2); E: Analysis of VEGFR2 expression levels in HUVECs in each treatment group; F: Standard curve of p38; G: Analysis of p38 expression levels in HUVECs in each treatment group. Significant differences in experimental data were analyzed using t tests, and all assays were performed in triplicate. aP < 0.05 vs the control (CTRL) group; cP < 0.001 vs the CTRL group. Akt: Ak strain transforming; ERK1/2: Extracellular regulated protein kinases 1/2; HUVECs: Human umbilical vein endothelial cells; PRP: Platelet-rich plasma; CTRL: The control group.
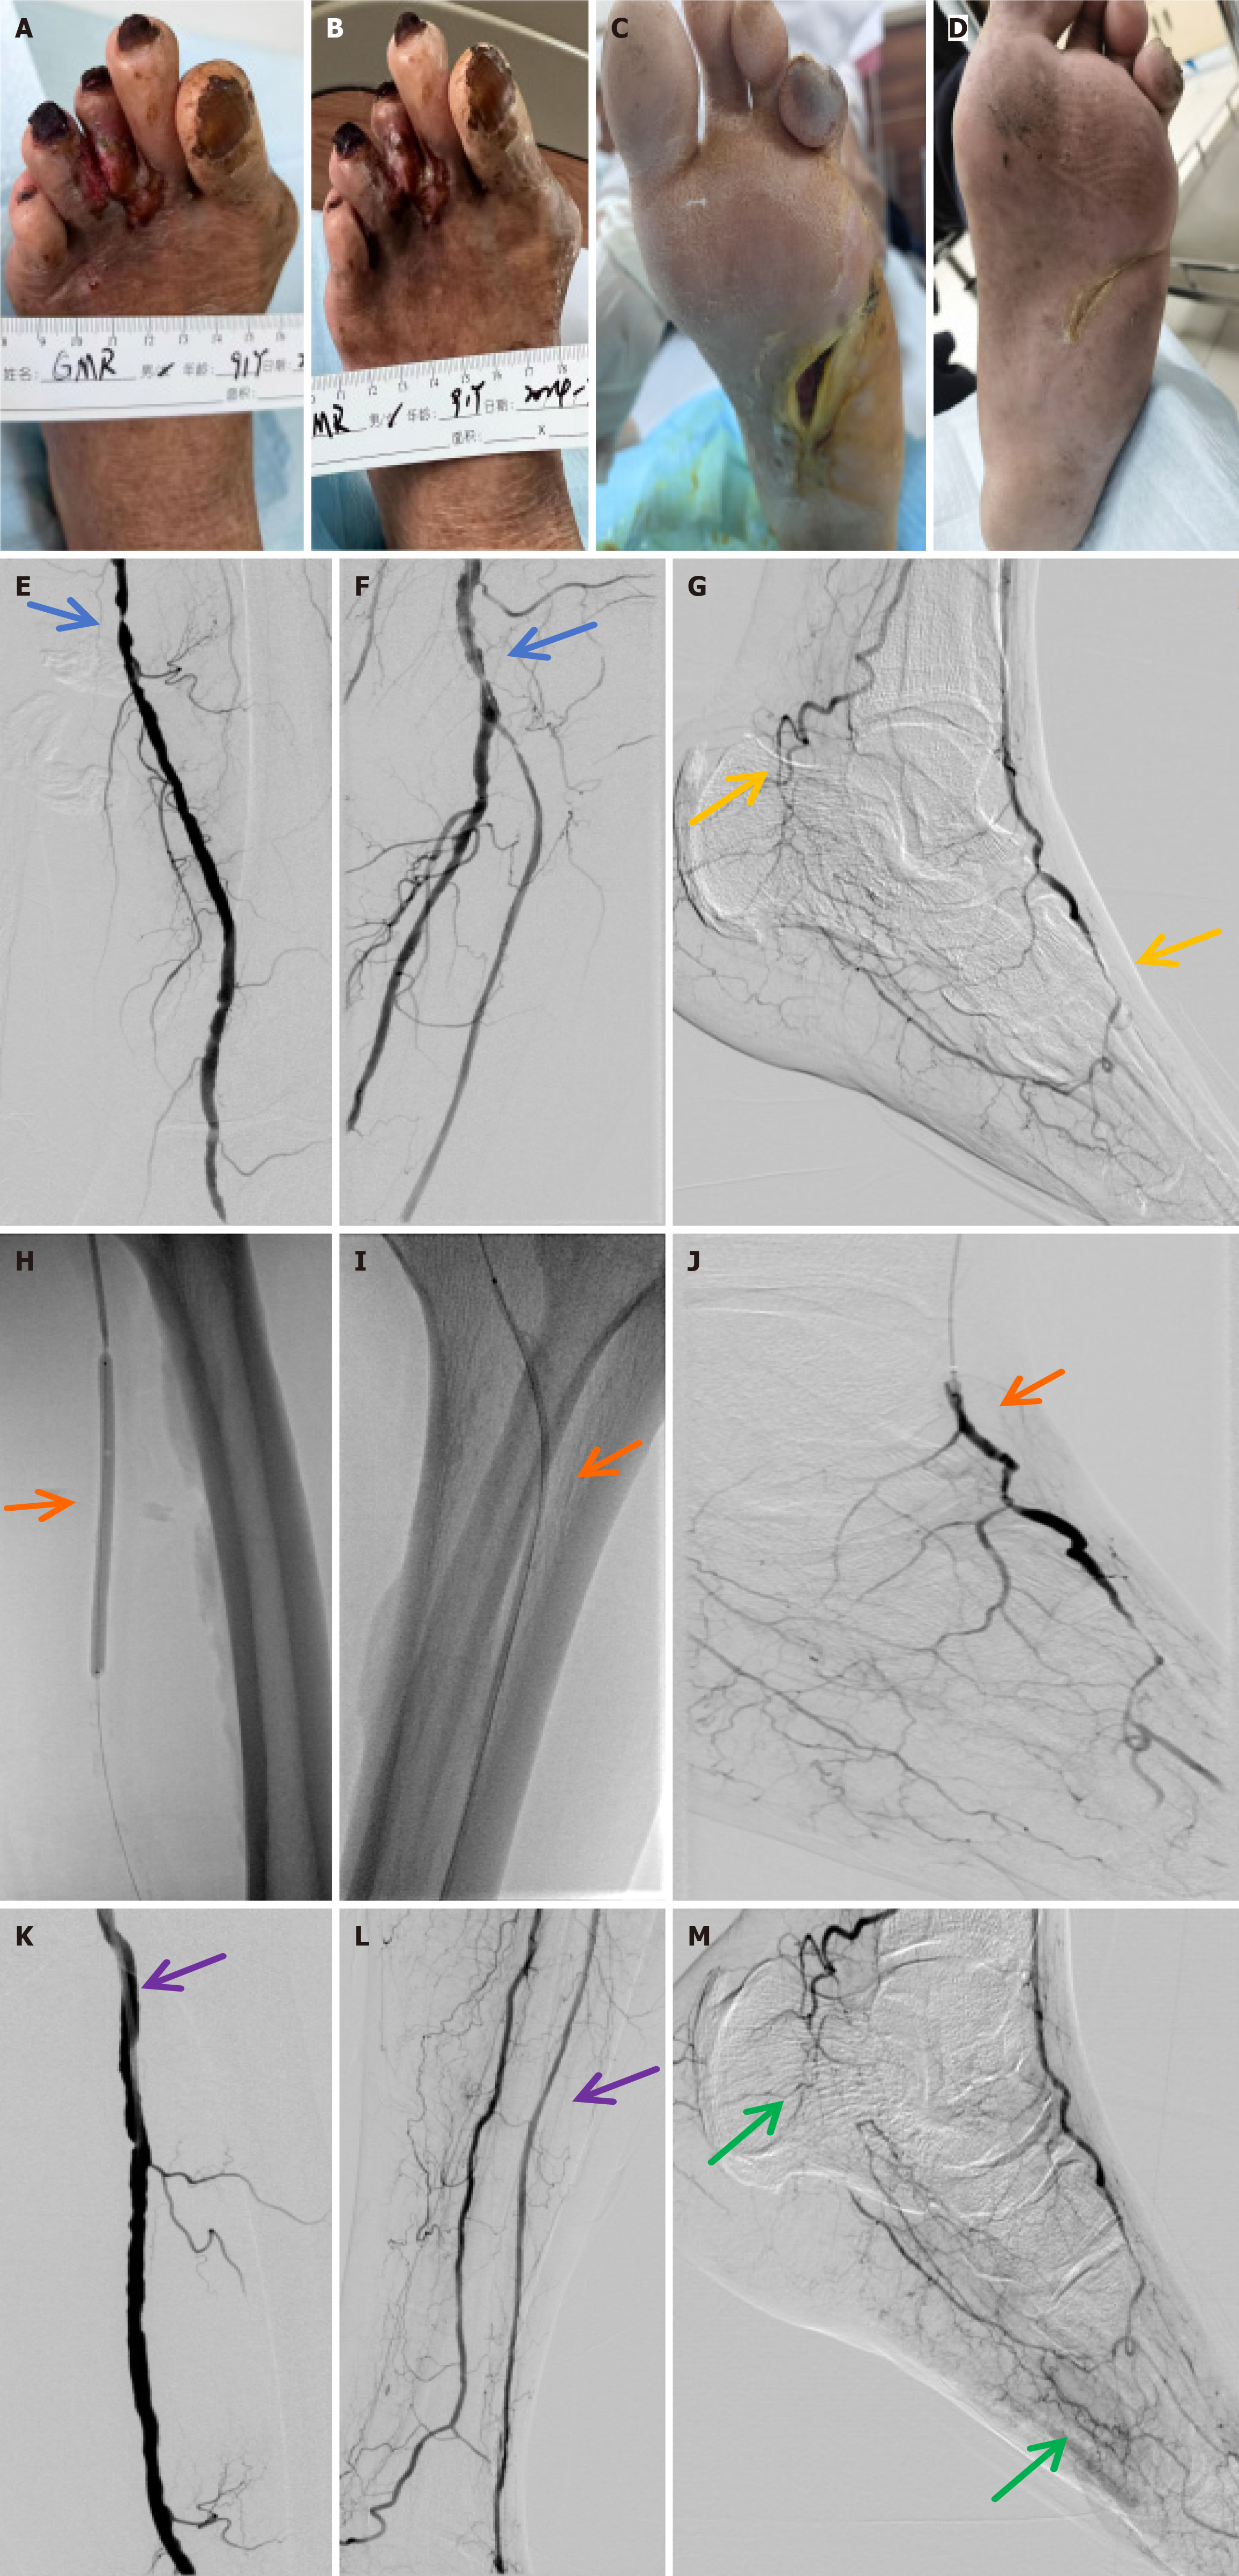
Figure 6 Diabetic foot ulcer repair.
Diabetic foot ulcers of patients in each group before and after treatment (blue arrows indicate lower extremity vascular stenosis, yellow arrows indicate lack of microcirculation in the foot, orange arrows indicate balloon dilatation and opening of blood vessels, purple arrows indicate revascularization of lower extremity vessels, and green arrows indicate establishment of microcirculation in the foot). A and B: Platelet-rich plasma (PRP) + endovascular angioplasty group before treatment (A), and PRP + endovascular angioplasty 1 month after treatment (B); C and D: PRP + endovascular angioplasty group before treatment (C), and PRP + endovascular angioplasty 1 month after treatment (D); E-G: PRP + endovascular angioplasty group before endovascular angioplasty under digital subtraction angiography (DSA); H-J: PRP + endovascular angioplasty group during endovascular angioplasty under DSA; K-M: PRP + endovascular angioplasty group 1 month after endovascular angioplasty under DSA.
- Citation: Huang C, Liu HZ, Liang JB, Zhao W, Wang YS, Ruan LF, Zhuang WZ, Li YS, Wang Q, Tang YK. In vitro and clinical evaluation of platelet-rich plasma combined with angioplasty in diabetic foot treatment. World J Diabetes 2025; 16(10): 110631
- URL: https://www.wjgnet.com/1948-9358/full/v16/i10/110631.htm
- DOI: https://dx.doi.org/10.4239/wjd.v16.i10.110631


