©The Author(s) 2025.
World J Diabetes. Oct 15, 2025; 16(10): 110406
Published online Oct 15, 2025. doi: 10.4239/wjd.v16.i10.110406
Published online Oct 15, 2025. doi: 10.4239/wjd.v16.i10.110406
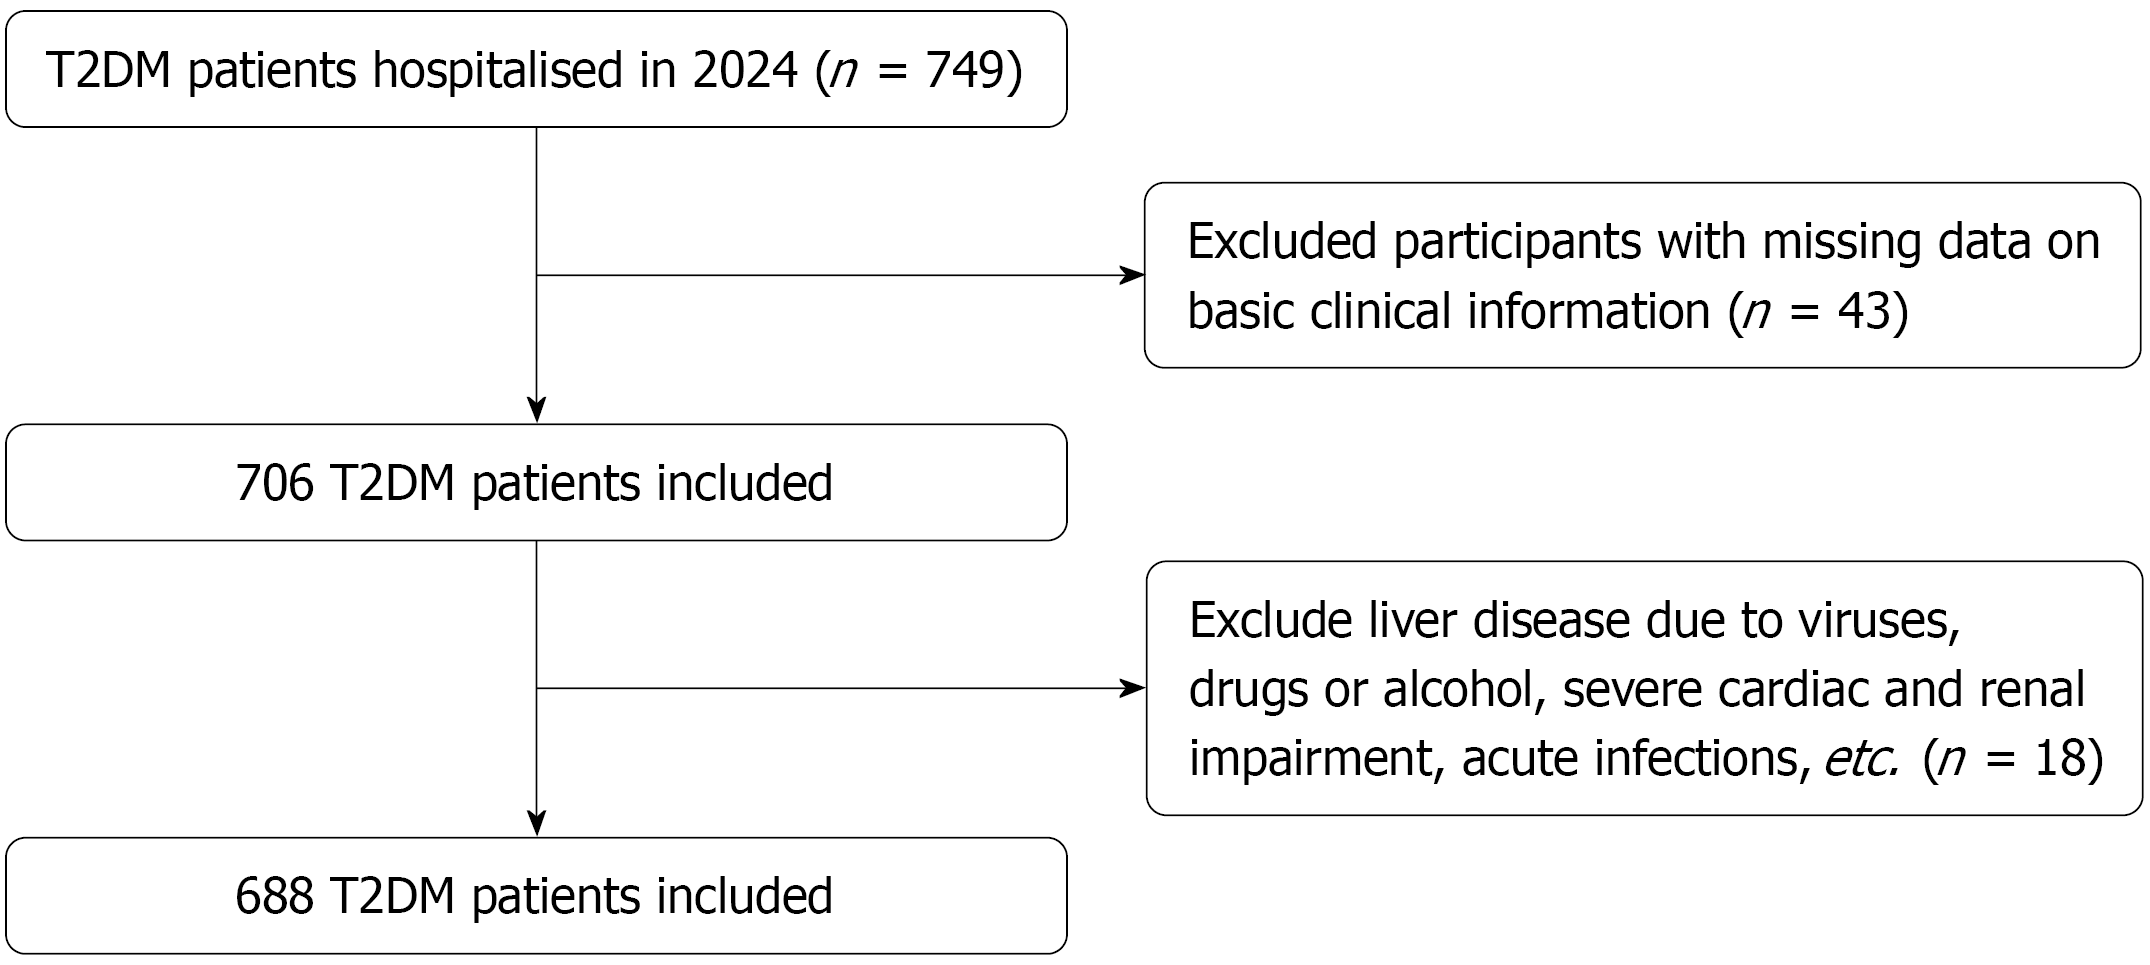
Figure 1 Flowchart of the population included in our study.
T2DM: Type 2 diabetes mellitus.
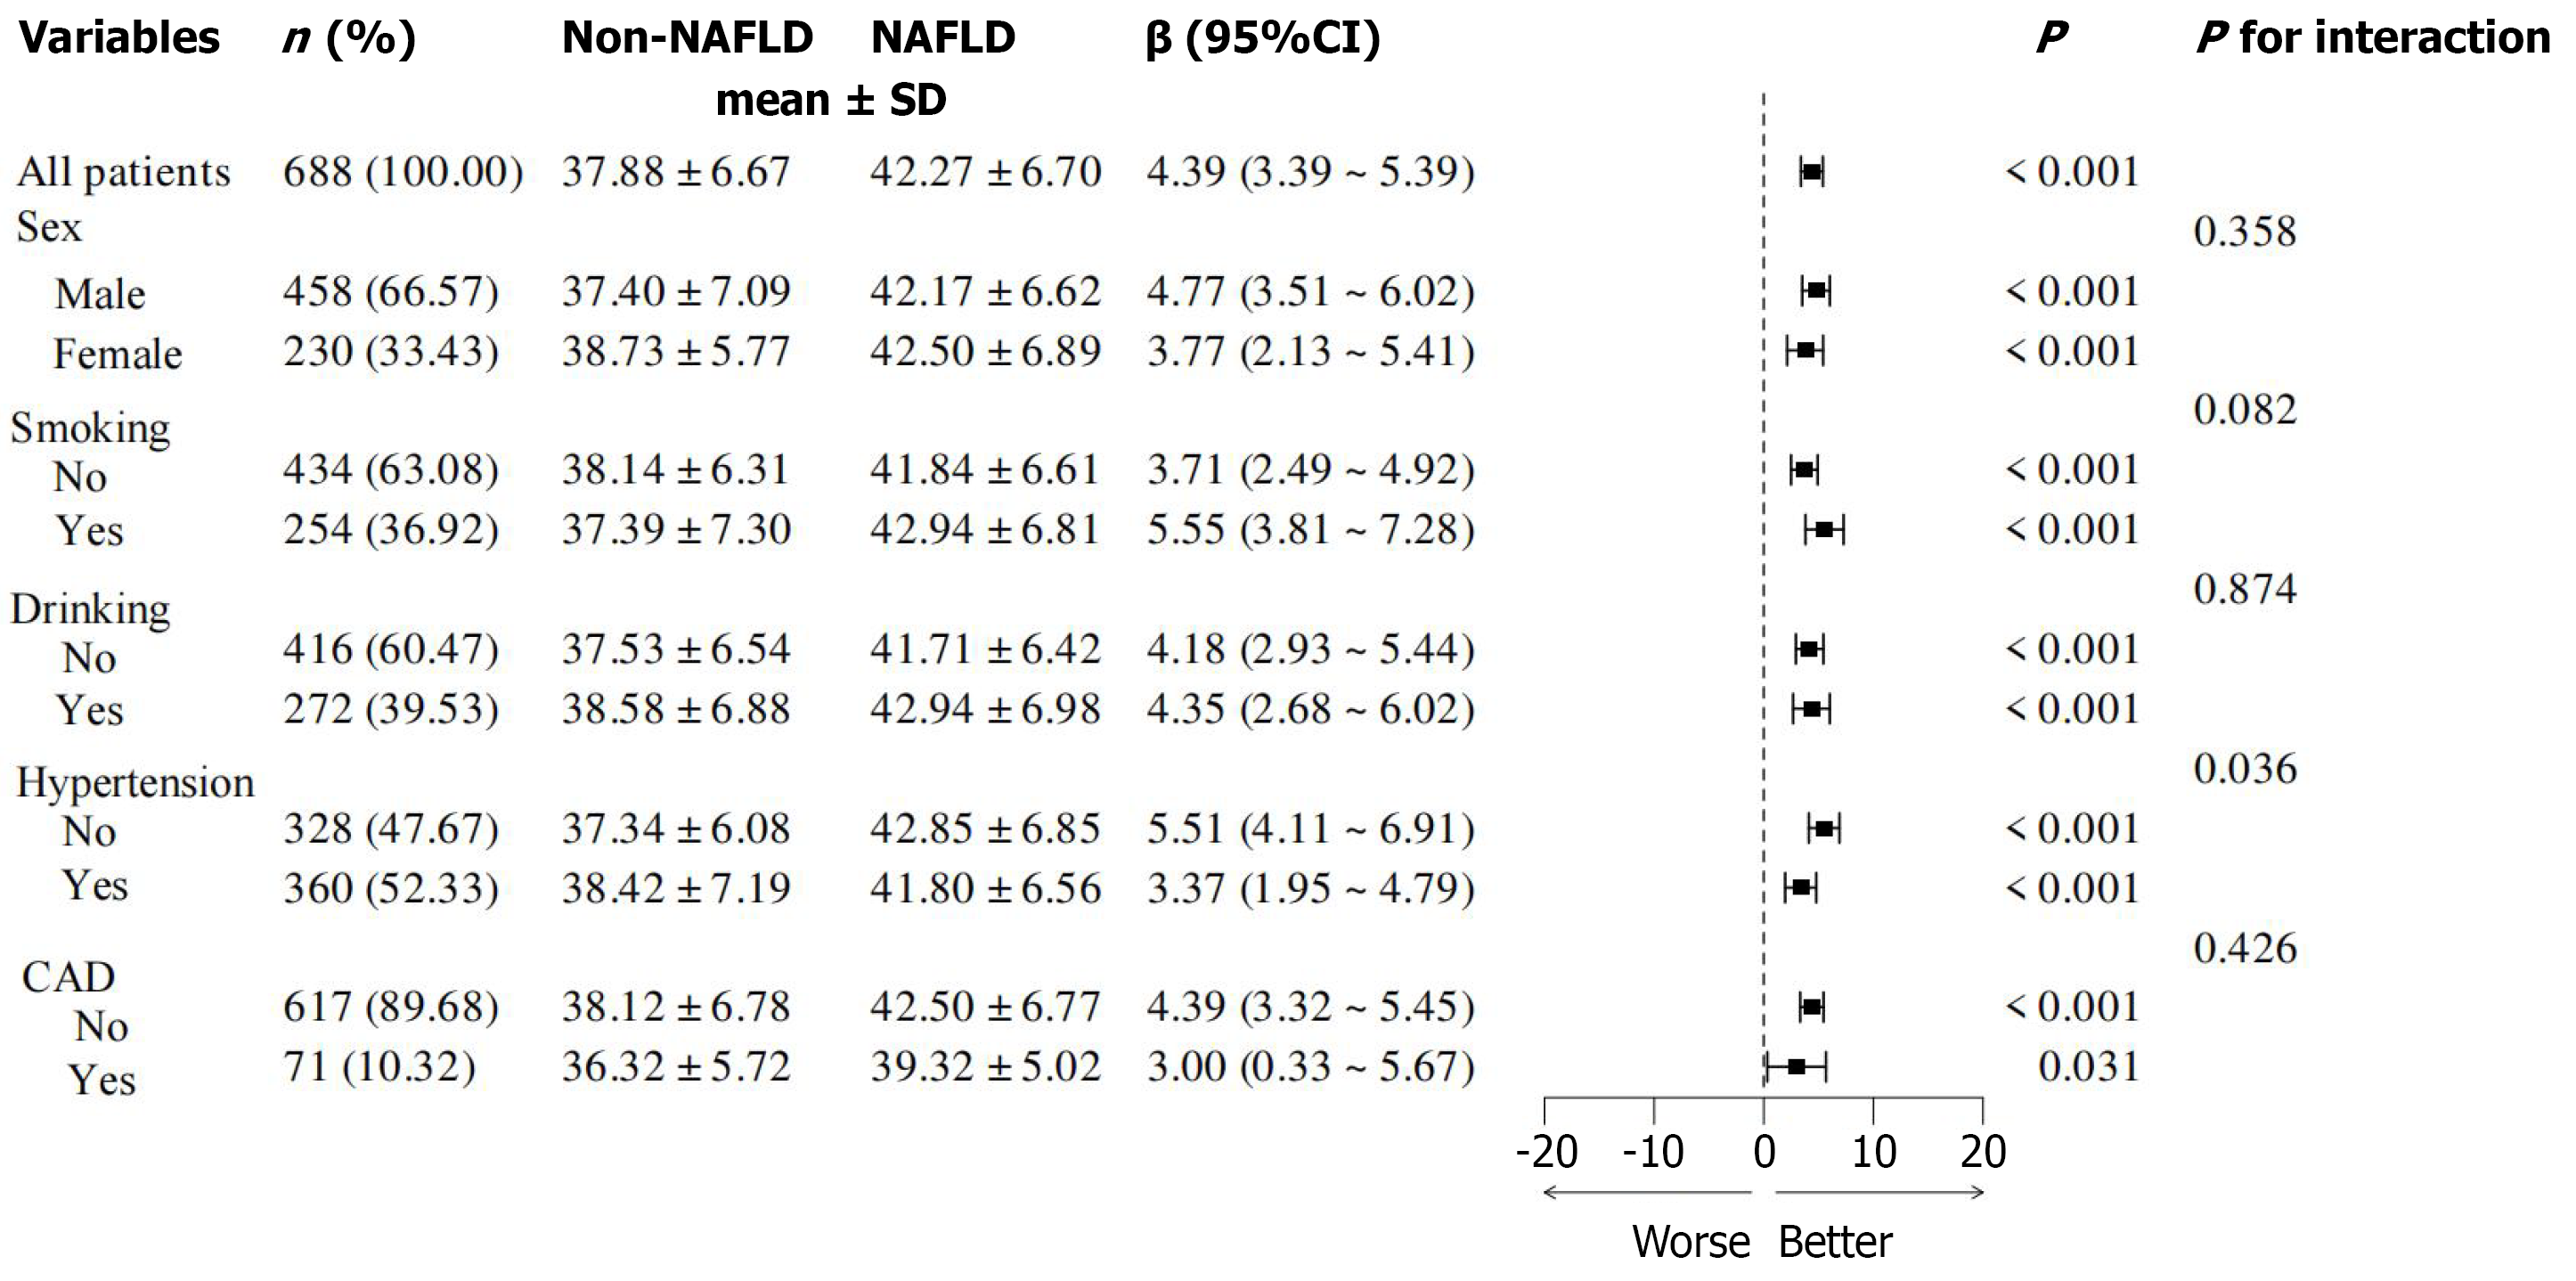
Figure 2 A forest plot of subgroup analyses of factors affecting metabolic dysfunction-associated steatotic liver disease in patients with type 2 diabetes mellitus.
CAD: Coronary artery disease; NAFLD: Non-alcoholic fatty liver disease; CI: Confidence interval.
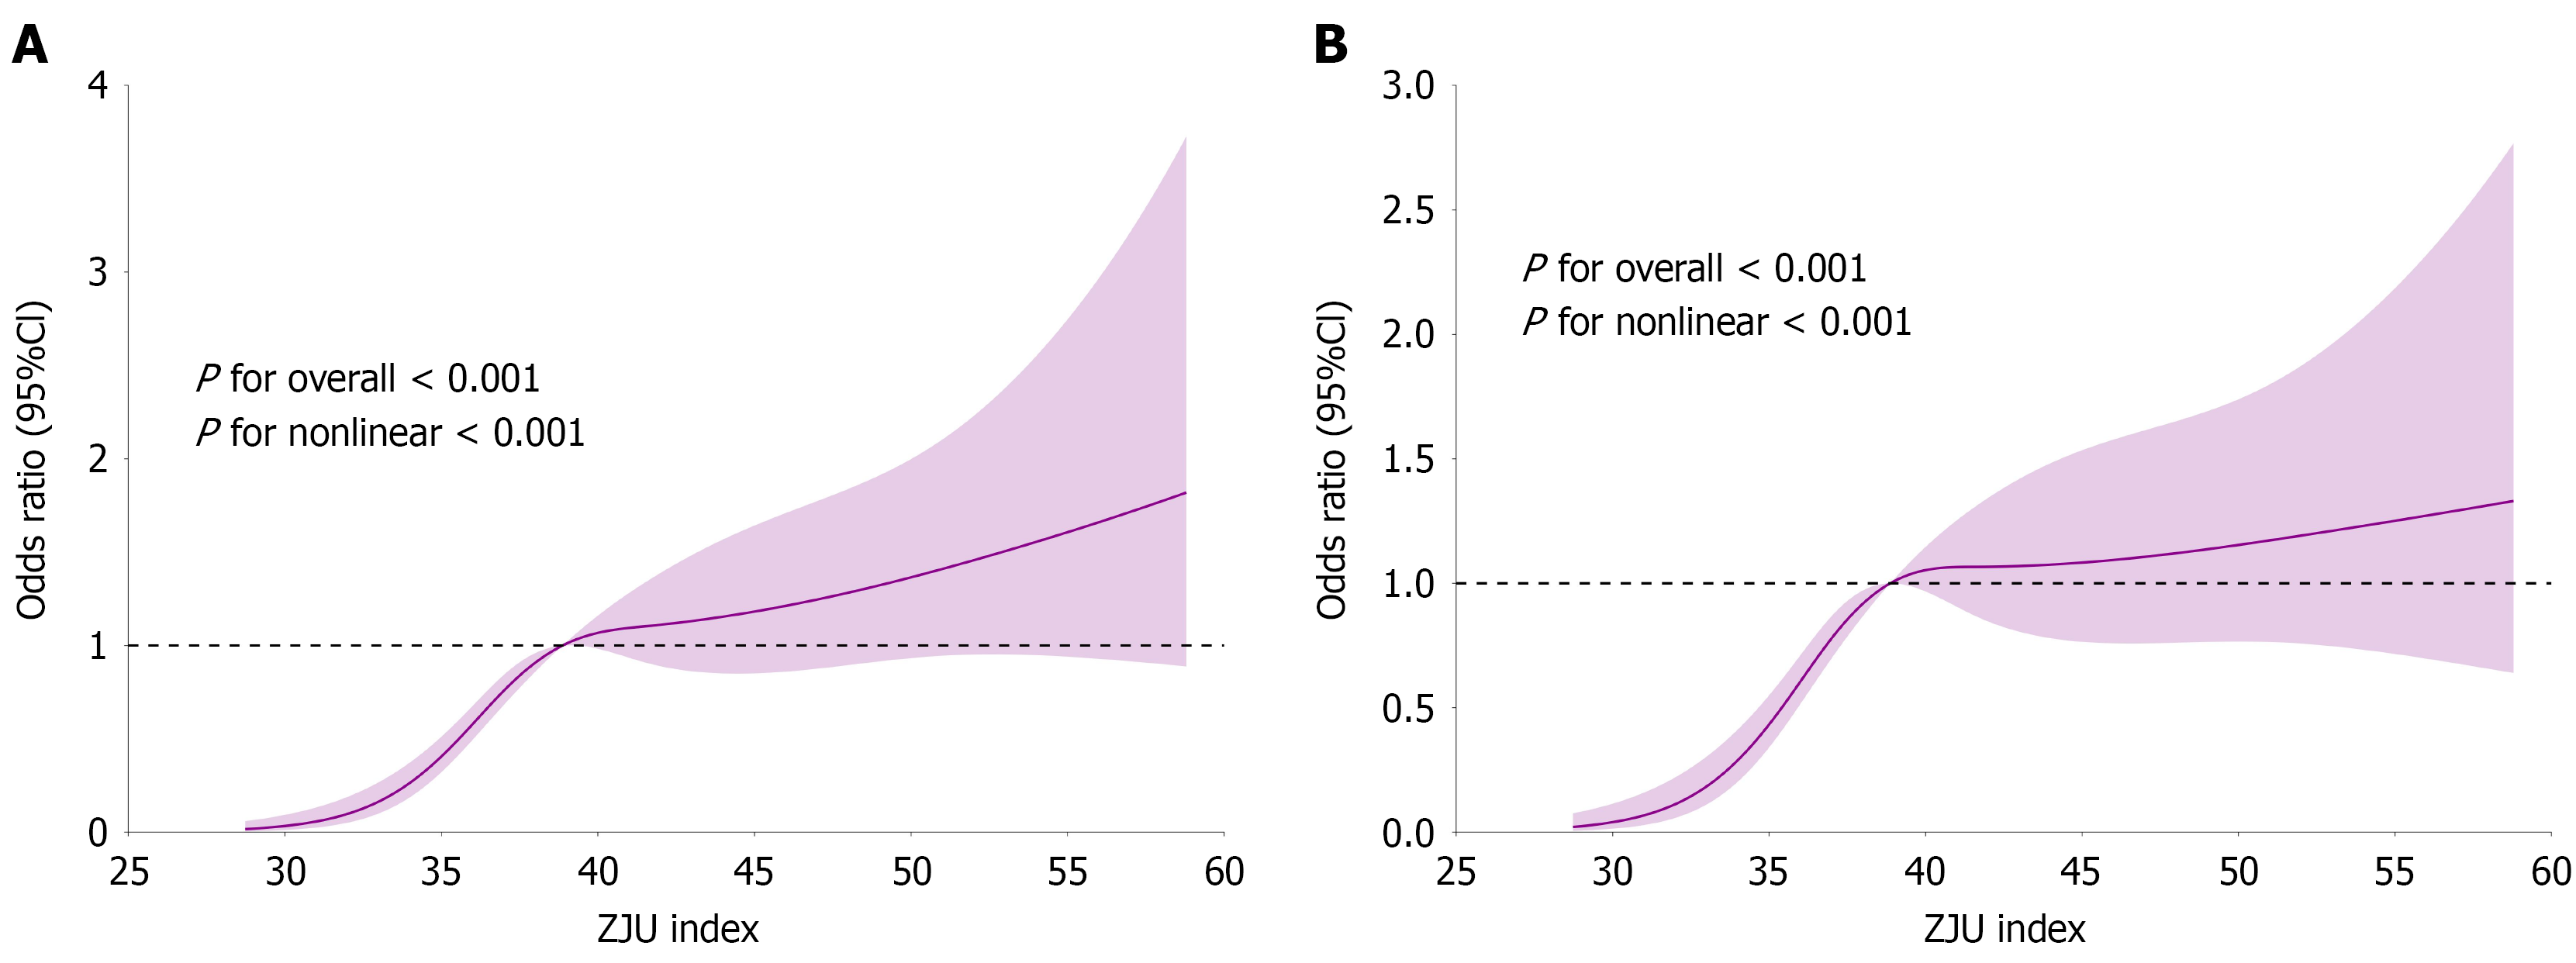
Figure 3 Results of non-linear correlation analysis between Zhejiang University index and metabolic dysfunction-associated steatotic liver disease in type 2 diabetes mellitus patients.
A: Unadjusted; B: Adjusted for sex, smoking, alcohol consumption, hypertension, coronary artery disease, age, systolic blood pressure, diastolic blood pressure, white blood cell count, blood urea nitrogen, uric acid, total cholesterol, high-density lipoprotein cholesterol, and low-density lipoprotein cholesterol. CI: Confidence interval; ZJU: Zhejiang University.
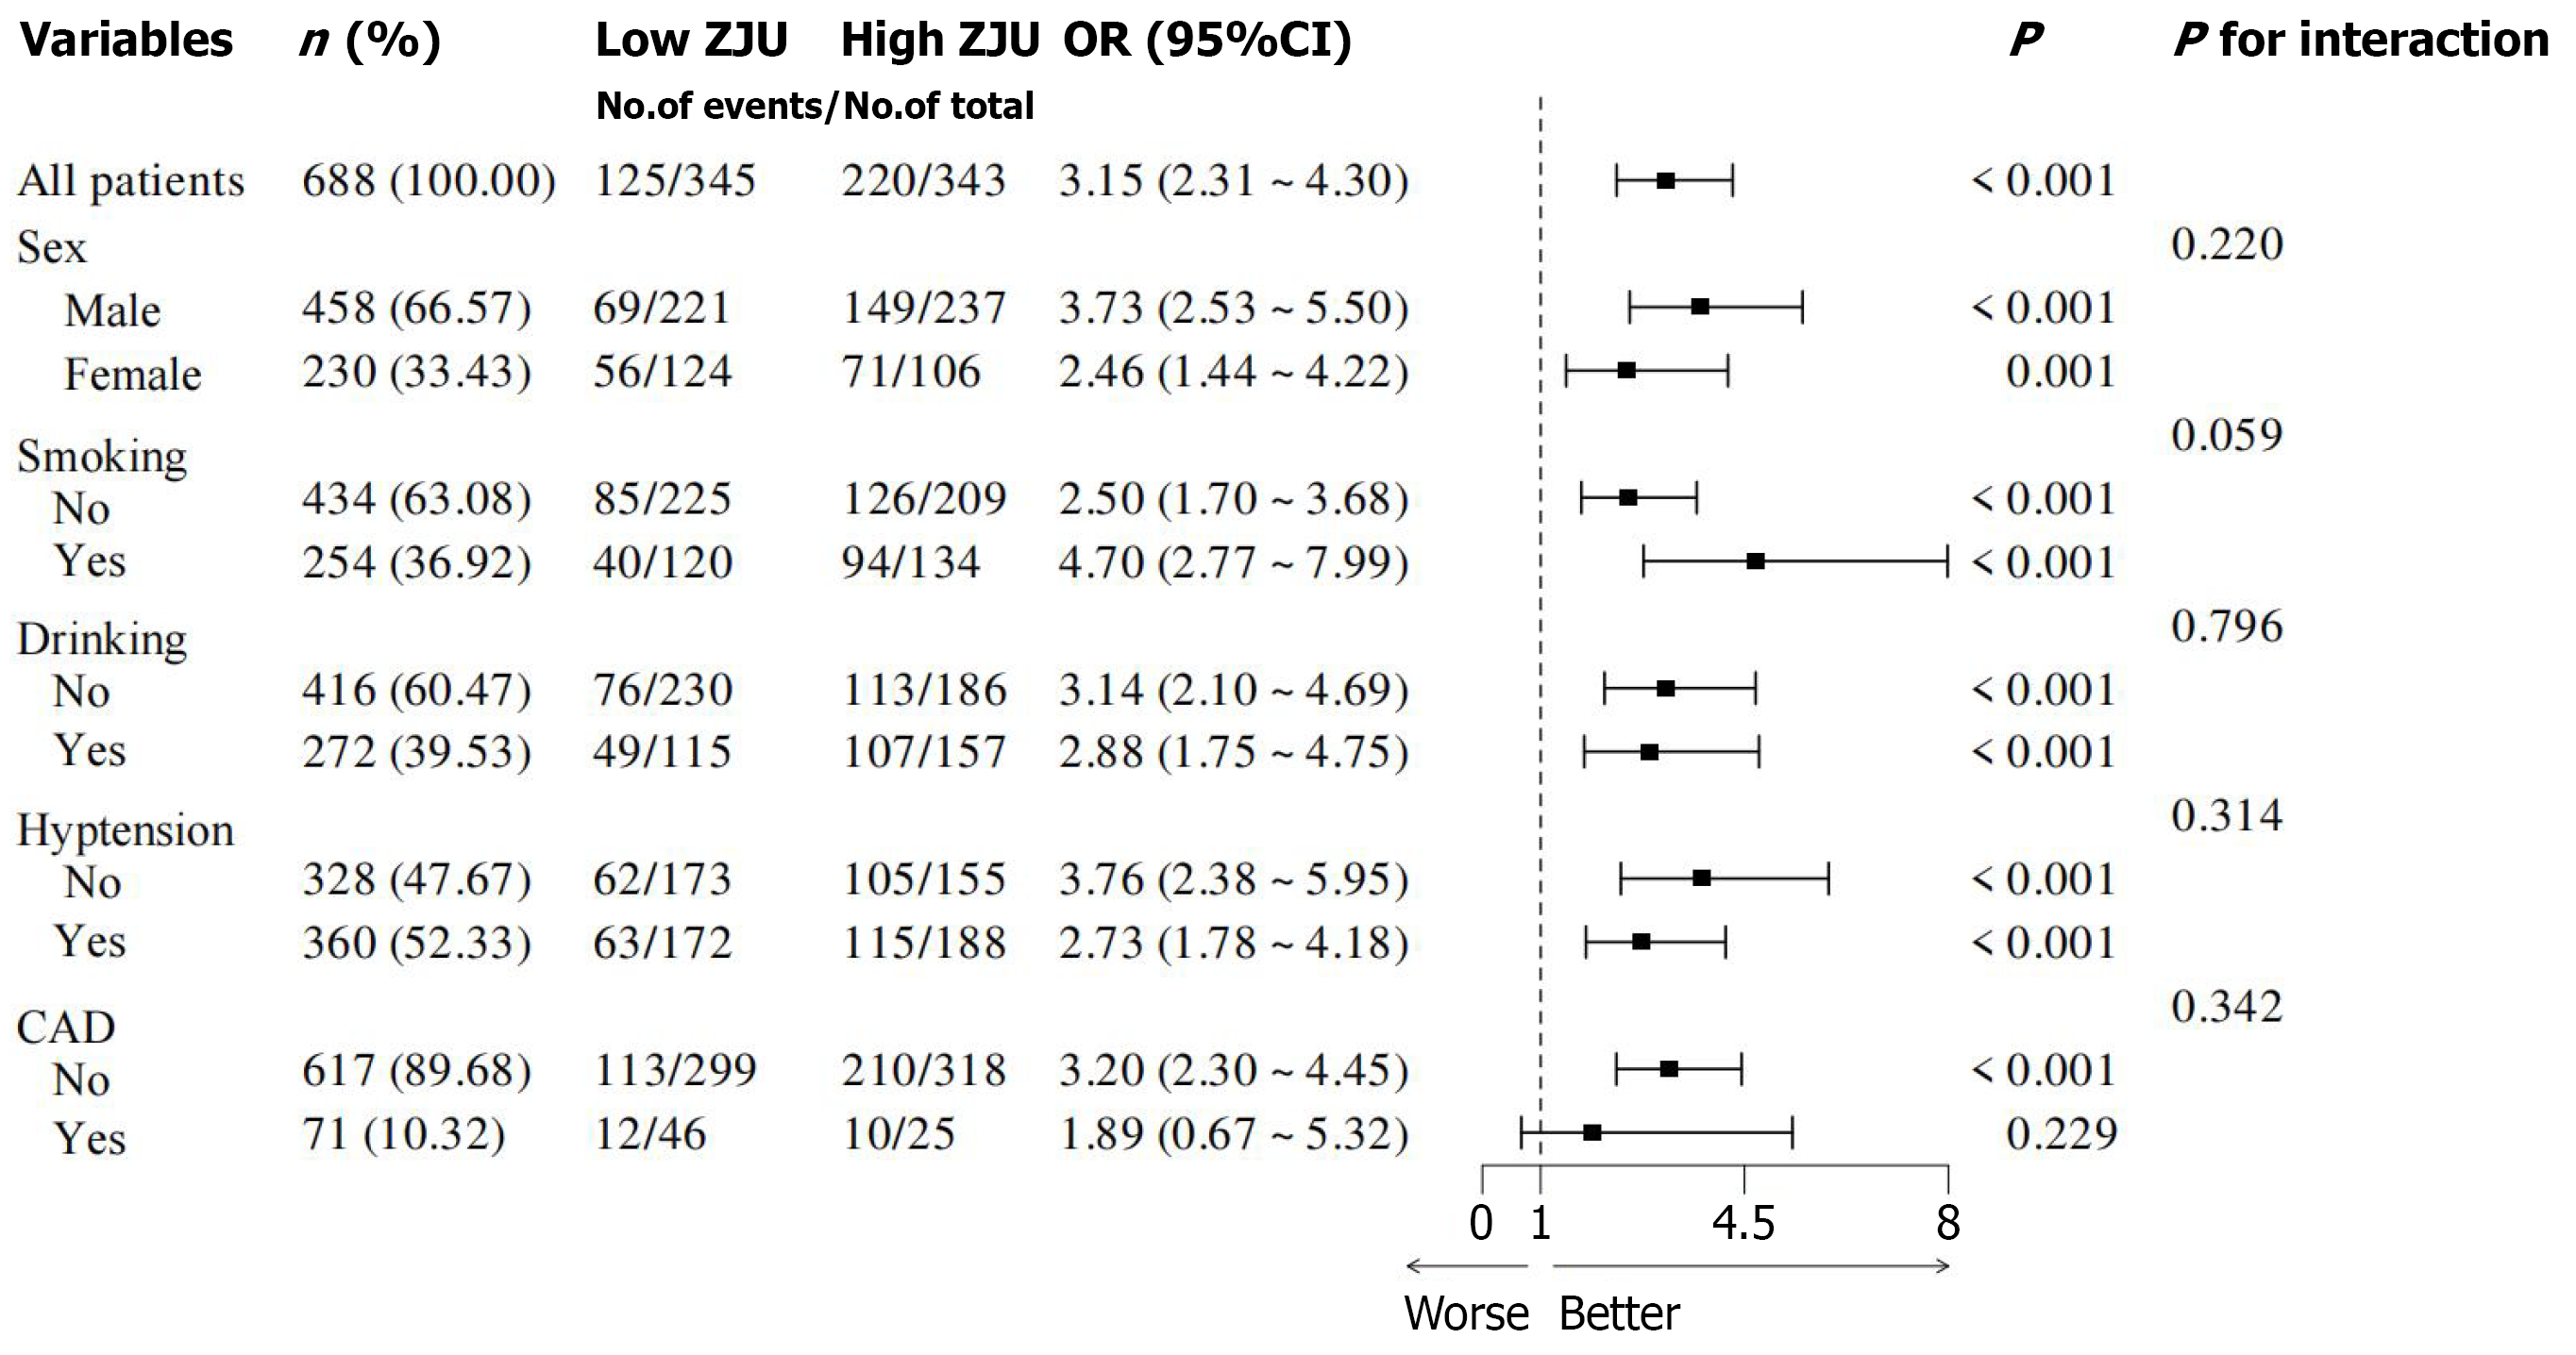
Figure 4 A forest plot of subgroup analyses of factors affecting Zhejiang University index in patients with type 2 diabetes mellitus.
ZJU: Zhejiang University; OR: Odds ratio; CI: Confidence interval; CAD: Coronary artery disease.
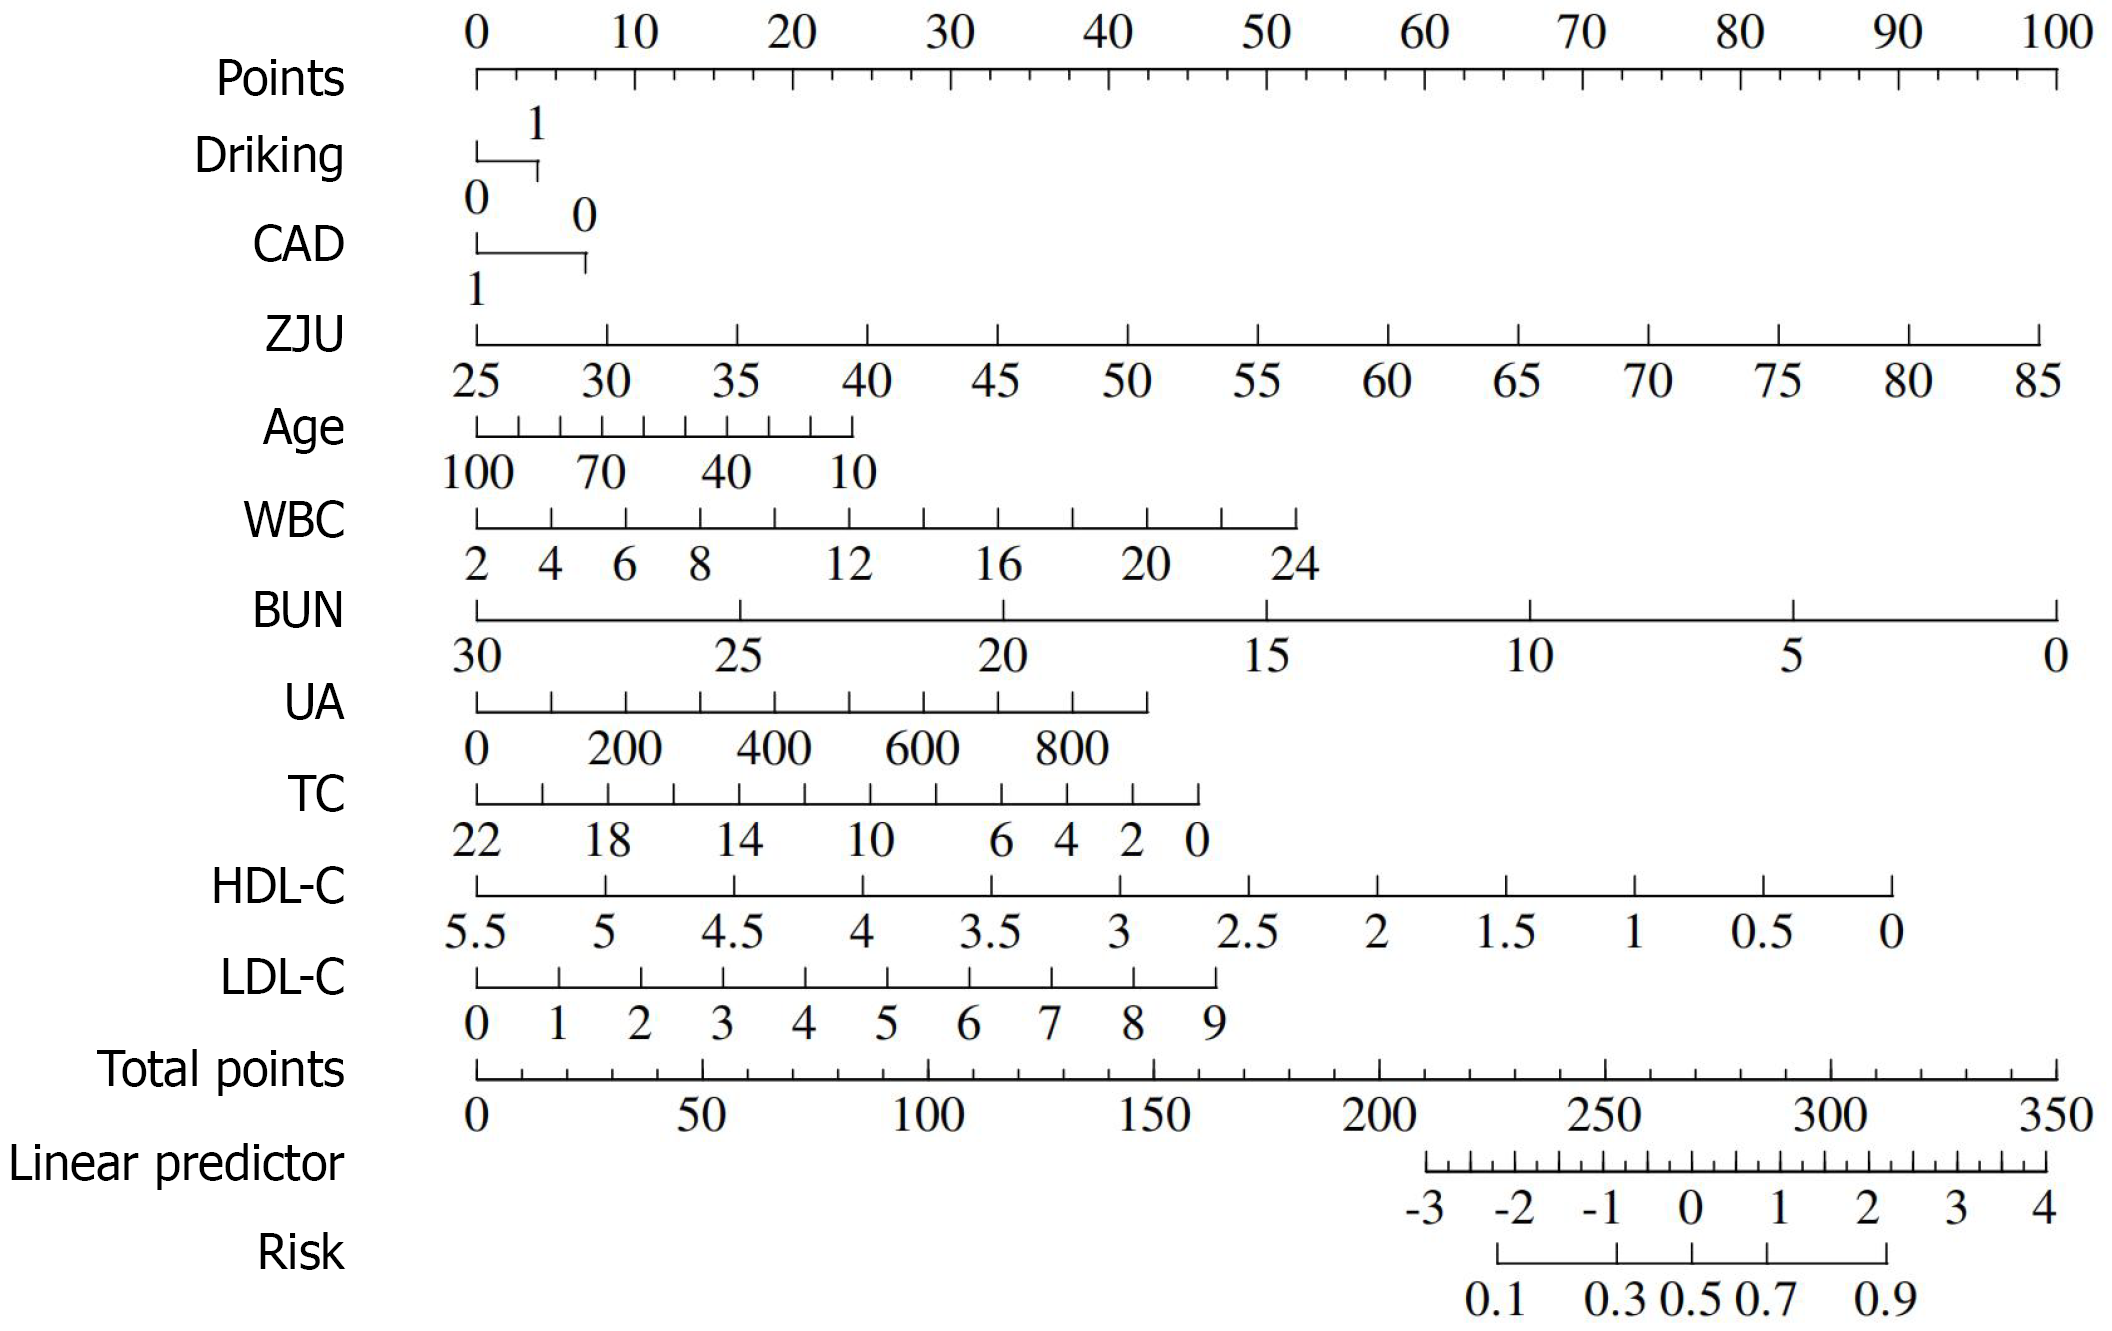
Figure 5 Predicting a new nomogram for metabolic dysfunction-associated steatotic liver disease.
CAD: Coronary artery disease; ZJU: Zhejiang University; WBC: White blood cell count; BUN: Blood urea nitrogen; UA: Uric acid; TC: Total cholesterol; HDL-C: High-density lipoprotein cholesterol; LDL-C: Low-density lipoprotein cholesterol.
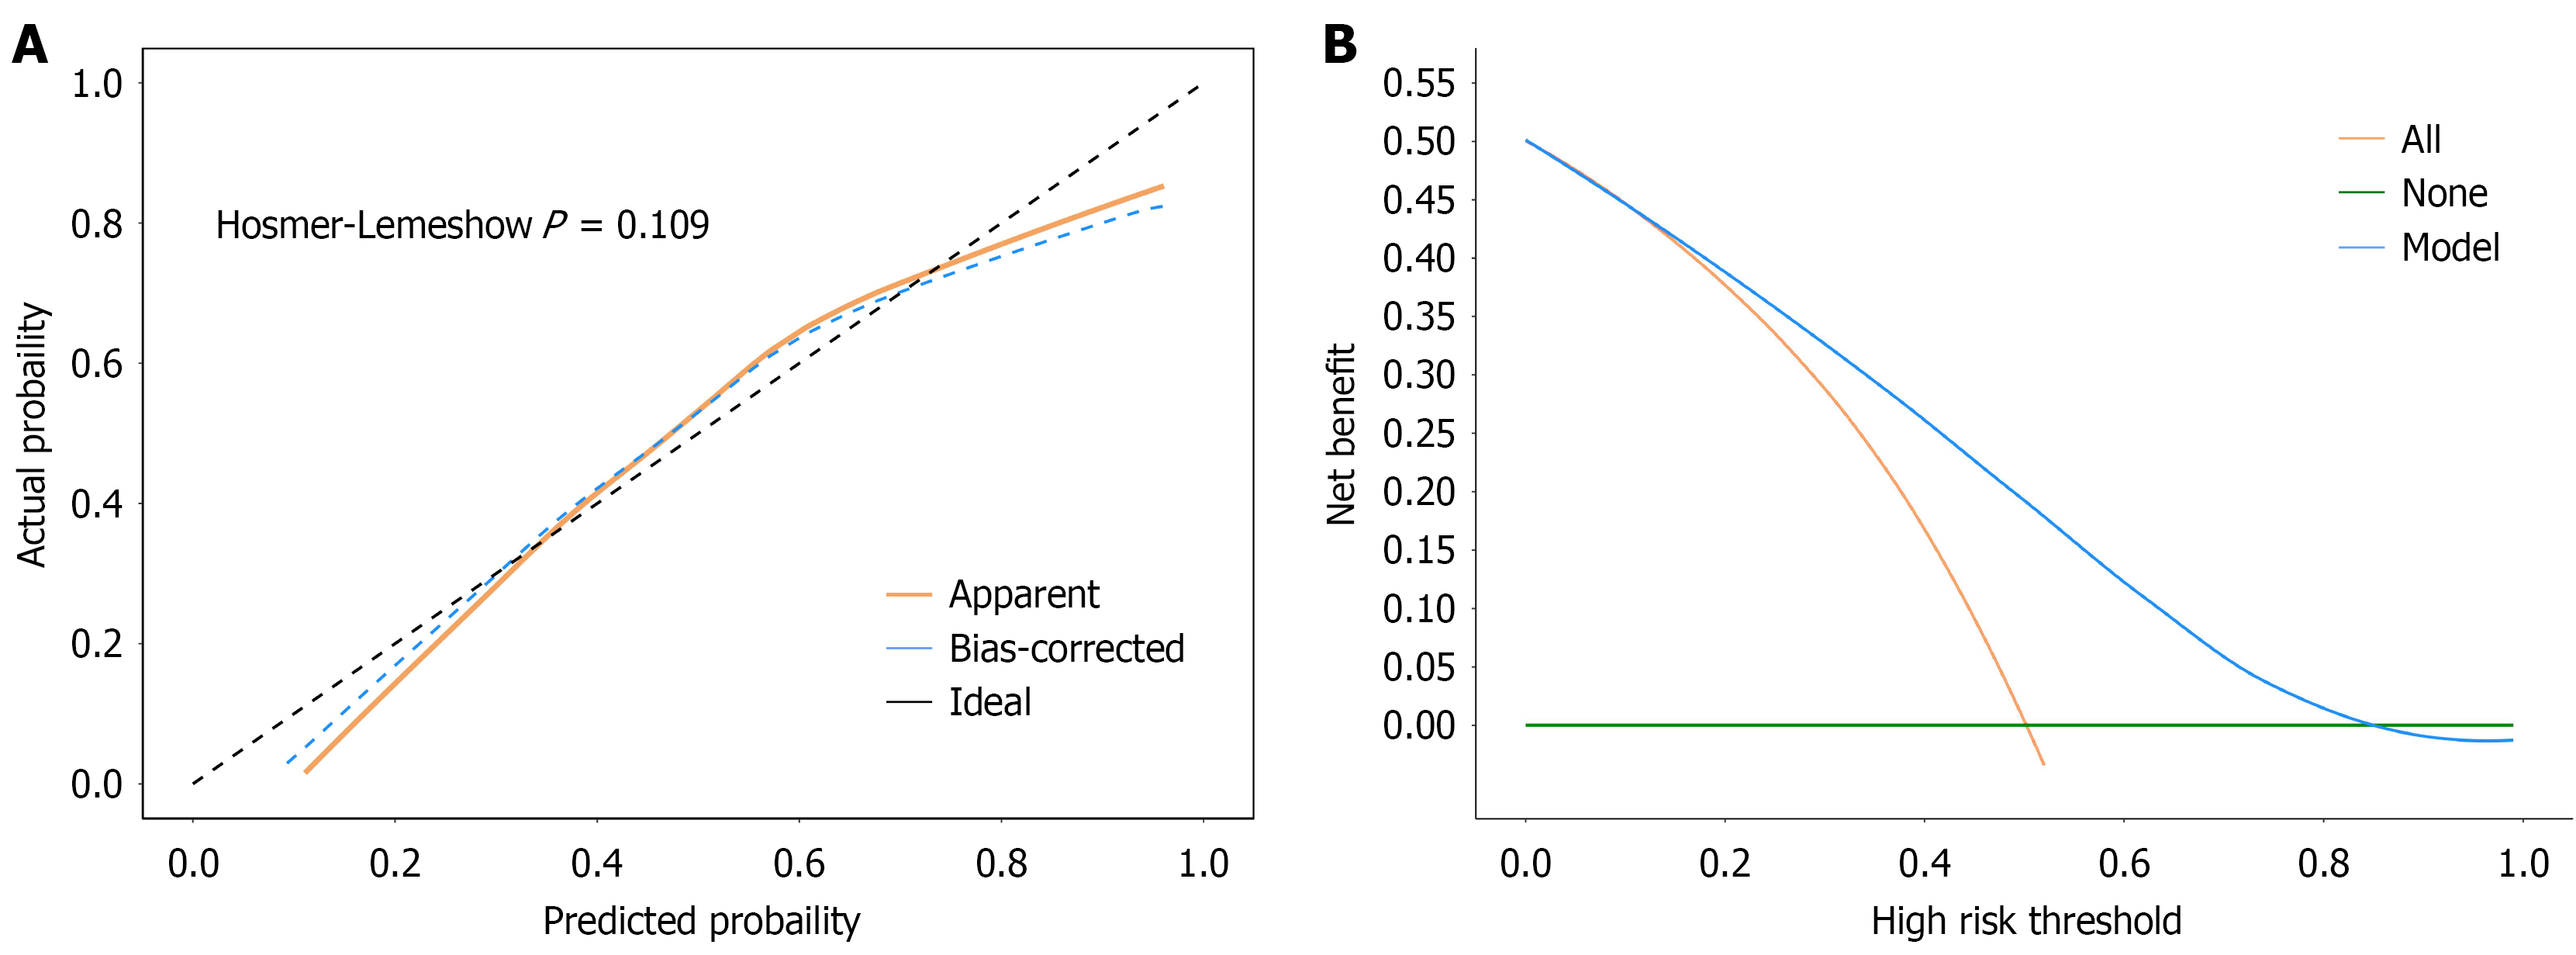
Figure 6 Calibration curves and decision curve analysis of nomogram.
A: Calibration curves; B: Decision curve analysis.
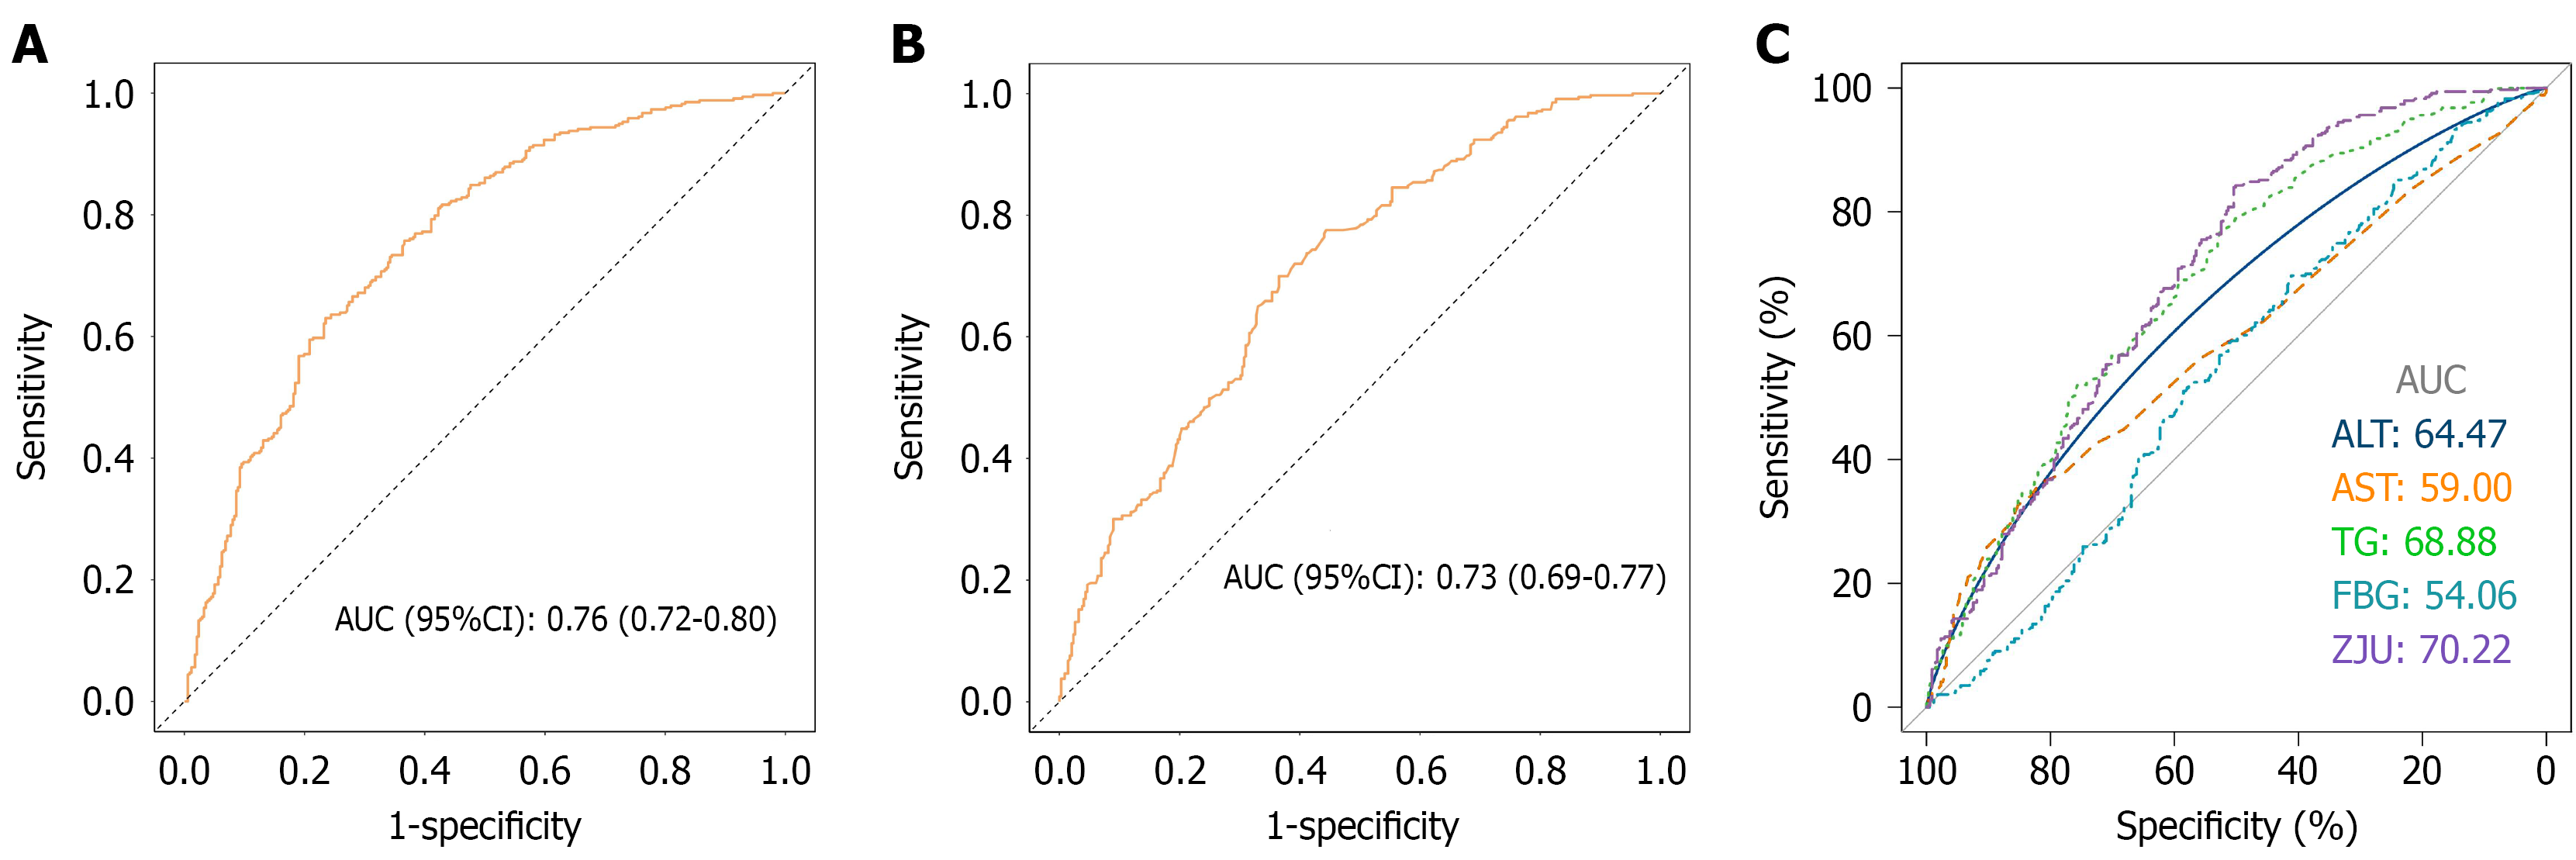
Figure 7 Predicting receiver operating characteristic curves for metabolic dysfunction-associated steatotic liver disease based on Zhejiang University index in type 2 diabetes mellitus patients.
A: Receiver operating characteristic (ROC) curve for the final multivariate model; B: ROC curves for bootstrapping cross-validation; C: ROC curves for comparisons between different indicators. AUC: Area under curve; CI: Confidence interval; ALT: Alanine aminotransferase; AST: Aspartate transaminase; TG: Triglyceride; FBG: Fasting blood glucose; ZJU: Zhejiang University.
- Citation: Tao XY, Pan TR, Zhong X, Pan XY. Association between Zhejiang University index and metabolic dysfunction-associated steatotic liver disease in patients with type 2 diabetes mellitus. World J Diabetes 2025; 16(10): 110406
- URL: https://www.wjgnet.com/1948-9358/full/v16/i10/110406.htm
- DOI: https://dx.doi.org/10.4239/wjd.v16.i10.110406


