Published online Apr 15, 2024. doi: 10.4251/wjgo.v16.i4.1213
Peer-review started: October 8, 2023
First decision: January 12, 2024
Revised: January 18, 2024
Accepted: February 23, 2024
Article in press: February 23, 2024
Published online: April 15, 2024
Processing time: 185 Days and 22.5 Hours
Portal vein thrombosis (PVT), a complication of liver cirrhosis, is a major public health concern. PVT prediction is the most effective method for PVT diagnosis and treatment.
To develop and validate a nomogram and network calculator based on clinical indicators to predict PVT in patients with cirrhosis.
Patients with cirrhosis hospitalized between January 2016 and December 2021 at the First Hospital of Lanzhou University were screened and 643 patients with cirrhosis who met the eligibility criteria were retrieved. Following a 1:1 propensity score matching 572 patients with cirrhosis were screened, and relevant clinical data were collected. PVT risk factors were identified using the least absolute shrinkage and selection operator (LASSO) and multivariate logistic regression analysis. Variance inflation factors and correlation matrix plots were used to analyze multicollinearity among the variables. A nomogram was constructed to predict the probability of PVT based on independent risk factors for PVT, and its predictive performance was verified using a receiver operating characteristic curve (ROC), calibration curves, and decision curve analysis (DCA). Finally, a network calculator was constructed based on the nomograms.
This study enrolled 286 cirrhosis patients with PVT and 286 without PVT. LASSO analysis revealed 13 variables as strongly associated with PVT occurrence. Multivariate logistic regression analysis revealed nine indicators as independent PVT risk factors, including etiology, ascites, gastroesophageal varices, platelet count, D-dimer, portal vein diameter, portal vein velocity, aspartate transaminase to neutrophil ratio index, and platelet-to-lymphocyte ratio. LASSO and correlation matrix plot results revealed no significant multicollinearity or correlation among the variables. A nomogram was constructed based on the screened independent risk factors. The nomogram had excellent predictive performance, with an area under the ROC curve of 0.821 and 0.829 in the training and testing groups, respectively. Calibration curves and DCA revealed its good clinical performance. Finally, the optimal cutoff value for the total nomogram score was 0.513. The sensitivity and specificity of the optimal cutoff values were 0.822 and 0.706, respectively.
A nomogram for predicting PVT occurrence was successfully developed and validated, and a network calculator was constructed. This can enable clinicians to rapidly and easily identify high PVT risk groups.
Core Tip: A nomogram to predict the probability of portal vein thrombosis (PVT) occurrence was successfully developed and validated and further constructed a network calculator. This can help clinicians to quickly and easily identify people at high risk for PVT in cirrhosis and early prevention.
- Citation: Nie GL, Yan J, Li Y, Zhang HL, Xie DN, Zhu XW, Li X. Predictive model for non-malignant portal vein thrombosis associated with cirrhosis based on inflammatory biomarkers. World J Gastrointest Oncol 2024; 16(4): 1213-1226
- URL: https://www.wjgnet.com/1948-5204/full/v16/i4/1213.htm
- DOI: https://dx.doi.org/10.4251/wjgo.v16.i4.1213
The incidence of non-malignant portal vein thrombosis (PVT) in patients with liver cirrhosis is approximately 5%-20%[1] which is more than seven times higher than that in the general population[2]. With the development of liver disease, the incidence of PVT increased gradually. The incidence of PVT in patients with compensated liver cirrhosis is 0.6%-16%, and that in patients with chronic end-stage liver disease is 8%-25%[3,4]. PVT in cirrhosis is gradually being recognized as a complication of cirrhosis and is receiving increasing attention.
PVT is usually asymptomatic in patients with cirrhosis and detected only during incidental imaging studies. In contrast, PVT formation can be complicated by elevated portal vein pressure and increased risk of rupture of esophagogastric fundic varices, ascites, and mesenteric and intestinal stasis[5,6]. Therefore, there is an urgent need for an early diagnosis of PVT development for early detection and treatment, thereby improving the prognosis of patients with cirrhosis.
In previous studies, inflammatory markers such as the systemic immune-inflammation index (SII), neutrophil-to-lymphocyte ratio (NLR), and platelet-to-lymphocyte ratio (PLR) have been reported to correlate with thrombus formation[7-9]. In addition, the gamma-glutamyl transpeptidase to lymphocyte count ratio (GLR)[10,11], prognostic nutritional index (PNI)[12], aspartate transaminase (AST) to neutrophil ratio index (ANRI)[13], albumin-bilirubin grading (ALBI)[14] and AST to lymphocyte ratio index (ALRI)[15] are receiving increasing attention in the diagnosis and prognosis of the disease.
Nomograms are graphical tools that visualize complex clinical metrics to aid clinicians in making medical decisions[16]. Currently nomogram are widely used in the diagnosis and prognosis of various diseases[17,18]. The aim of this study was to investigate the risk factors associated with the development of PVT in the natural course of cirrhosis, rather than in cirrhotic patients with invasive manipulation. To construct and validate a practical nomogram and network calculator for predicting the occurrence of PVT based on screened inflammatory markers and related indicators to help clinicians identify patients at risk of PVT at an early stage, thereby enabling early intervention and improving the prognosis of patients with PVT in cirrhosis.
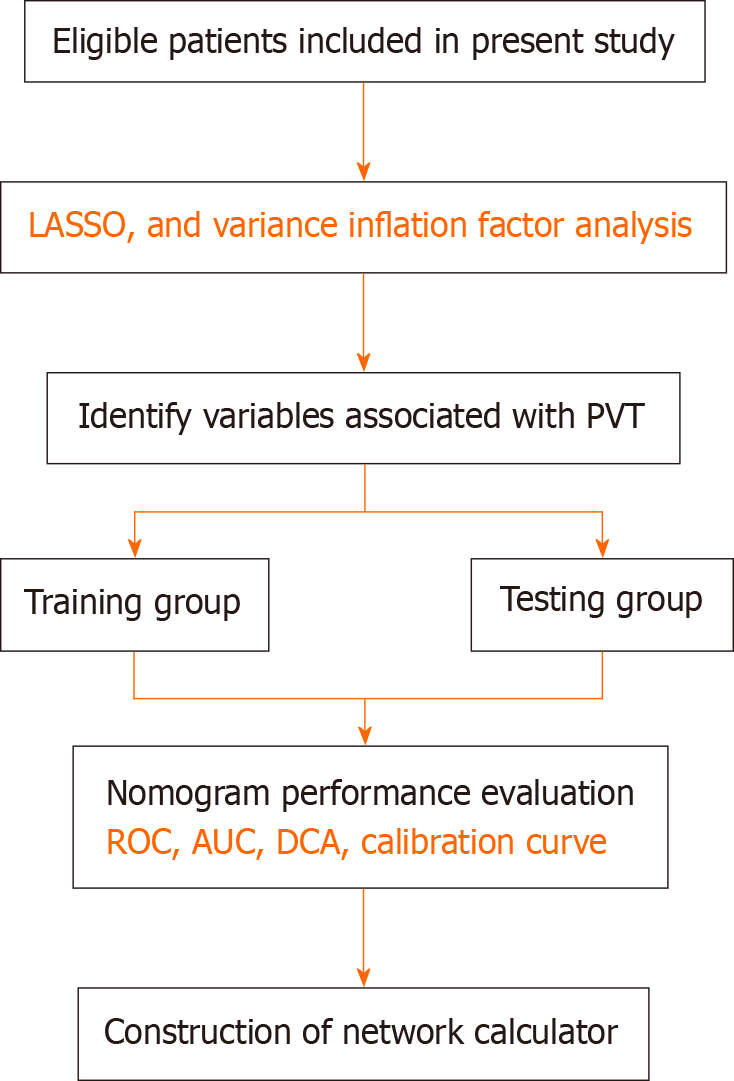
Patients with cirrhosis were hospitalized between January 2016 and December 2021 at the First Hospital of Lanzhou University. A total of 572 patients with liver cirrhosis were included in this study. The specific screening process is shown in Figure 1. The diagnosis of liver cirrhosis is based on pathological biopsy (not applicable to those with intractable ascites and coagulation dysfunction), imaging, clinical symptoms and signs, laboratory tests, medical history, and relevant complications (and consultation with relevant experts; indeterminate cases will be excluded). Diagnosis of PVT depends on the consensus regarding PVT in liver cirrhosis[1]. The following criteria were used to determine inclusion: (1) Age ≥ 18 and ≤ 80 years; (2) Patients with cirrhosis with complete clinical information confirmed by a combination of medical history, physical signs, laboratory tests, or liver pathology; (3) PVT was diagnostically confirmed based on one abdominal ultrasonography, computed tomography (CT), or magnetic resonance imaging (MRI). Patients with hepatic and extrahepatic malignancies, liver transplantation, splenectomy and periesophagogastric devascularization, transjugular intrahepatic portosystem stent-shunt, Budd-Chiari syndrome, noncirrhotic PVT, those requiring anticoagulation, and other severe diseases. All relevant clinical and laboratory data were collected at our hospital, and all serum indicators were collected at the time of the first diagnosis of PVT.
Data included demographic data, clinical laboratory test results, and ultrasonographic characteristics. Demographic data, including age, sex, and body mass index (BMI). Clinical laboratory tests included D-dimer (D-D), activated partial thromboplastin time (APTT), prothrombin activity (PTA), prothrombin time (PT), international normalized ratio (INR), prothrombin time (TT), AST, albumin (ALB), bilirubin, platelet count (PLT), white blood cell count, neutrophil count, lymphocyte count, monocyte count, ALBI, and Child-Turcotte-Pugh score. The ultrasonographic characteristics included portal vein diameter (PVD), splenic vein diameter (SVD), and portal vein velocity (PVV). The clinical characteristics included etiologies of liver disease, ascites, and gastroesophageal varices (GOV). Moreover, etiologies of cirrhosis include, autoimmune hepatitis, viral hepatitis and other. This study was approved by the Ethics Committee of the First Hospital of Lanzhou University (LDYYLL2021-286) and was conducted in accordance with the principles of the Declaration of Helsinki.
Inflammatory markers and associated scores were calculated as follows: SII, platelet count × neutrophil count/lymphocyte count (× 109/L). The NLR was calculated as the neutrophil count/lymphocyte count. The GLR was calculated as the gamma-glutamyl transpeptidase/lymphocyte count ratio. The PLR was calculated by dividing the platelet count by the lymphocyte count. The PNI was calculated as follows: serum albumin (g/L) + 5 × total peripheral blood lymphocytes (× 109/L). The ANRI was calculated as the AST to neutrophil count ratio. ALRI was calculated as the AST-to-lymphocyte count. ALBI was calculated as (log10 bilirubin × 0.66) + (-0.085 × ALB), and ALBI scores were classified into -the following three levels: ≤ -2.60 (level 1), > -2.60 and ≤ -1.39 (level 2), > -1.39 (level 3).
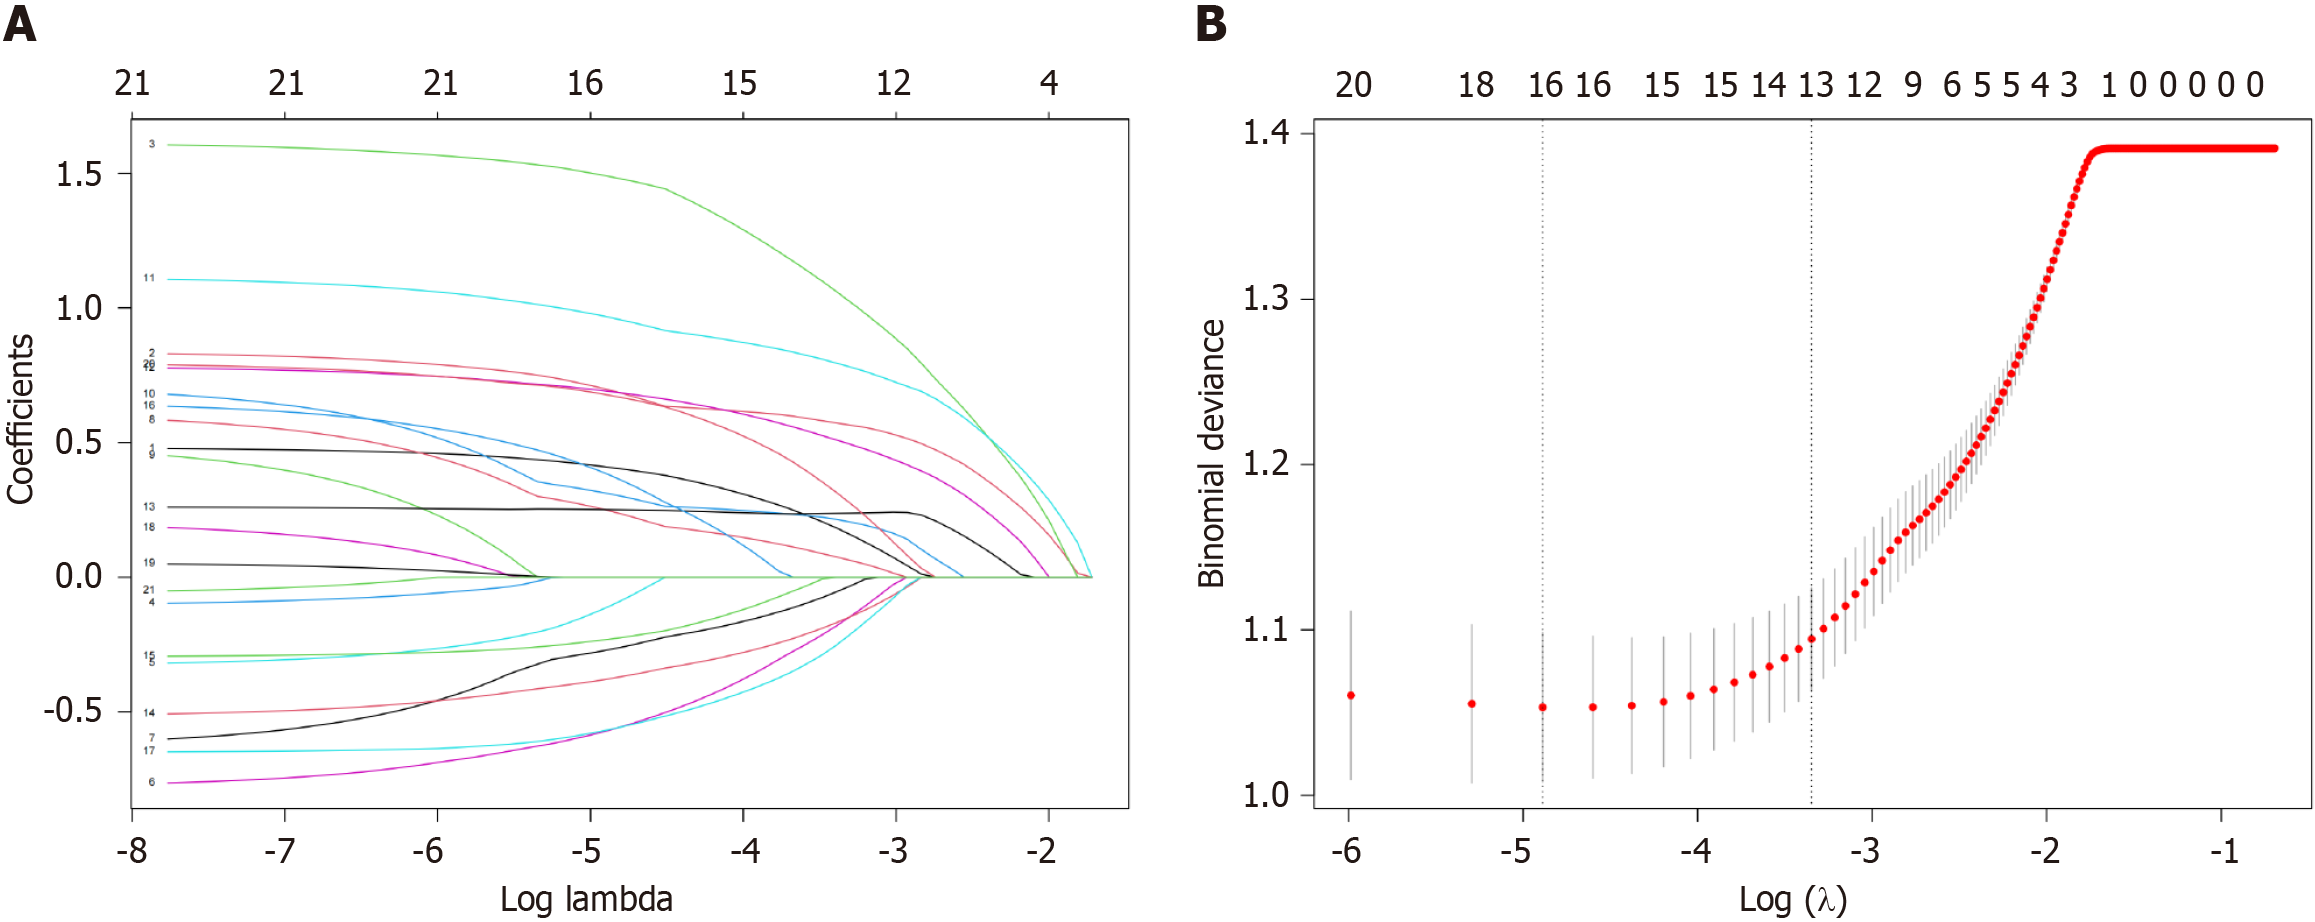
All variables were included in least absolute shrinkage and selection operator (LASSO) regression analyses. As the penalty increased, the estimates of the weaker variables converged to zero. Eventually, screening yielded 13 variables. Further, multivariate logistic regression analysis was used to screen for nine independent risk factors associated with PVT. Variance inflation factors (VIF) and correlation matrix plots were used to examine multicollinearity and correlation between variables.
R software (version 4.1.2) was used for the statistical analysis. Categorical variables were analyzed using the chi-squared test or Fisher's exact test. Quantitative variables are expressed as mean ± SD, and significance was determined using Student's t-test. Sex, age, and BMI were matched between the groups using propensity score matching (PSM). The total population was divided into training and testing groups in a ratio of 7:3. The training and testing groups were used for model construction and validation, respectively. Multivariate logistic regression analysis was used to determine the independent risk factors of PVT, and the discriminatory ability of the nomogram was measured by calculating the area under the receiver operating characteristic (AUROC). Calibration curves[19], decision curves, and ROC curves were used to assess the clinical value of the nomogram. Statistical significance was defined as a P-value < 0.05 (both sides).
Statistical analysis was performed using the CreateTableOne function in the R software TableOne package. The Regplot package constructs a nomogram based on independent risk factors and the DynNom package constructs a network calculator. The pROC package was used to plot ROC curves, and AUROC was used to evaluate nomogram discrimination and compare the AUROC with the nomogram for different variables. Calibration curves were plotted using the rms package decision curve analysis (DCA) and the rmda package. The mctest package was used for VIF analysis, and the corrplot package was used for correlation row matrix plotting.
After PSM (age, sex, and BMI), 286 patients with PVT and 286 without PVT were included in this study. The baseline characteristics of the enrolled patients are shown in Table 1. The laboratory test results, systemic inflammatory markers, and related indices of patients in the two groups are detailed in Table 2.
| Characteristics | non-PVT (n = 286) | PVT (n = 286) | P value |
| Age [mean (SD)] | 52.60 (11.61) | 52.87 (12.02) | 0.783 |
| Sex, n (%) | |||
| Male | 161 (56.30) | 163 (57.00) | 0.933 |
| Female | 125 (43.70) | 123 (43.00) | |
| BMI [mean (SD)] | 22.71 (3.28) | 22.70 (3.02) | 0.952 |
| Etiology, n (%) | |||
| AIH | 40 (14.00) | 20 (7.00) | 0.001 |
| Hepatitis | 200 (69.90) | 189 (66.10) | |
| Others | 46 (16.10) | 77 (26.90) | |
| Ascites, n (%) | |||
| No | 154 (53.80) | 60 (21.00) | < 0.001 |
| Yes | 132 (46.20) | 226 (79.00) | |
| GOV, n (%) | |||
| No | 73 (25.50) | 7 (2.40) | < 0.001 |
| Yes | 213 (74.50) | 279 (97.60) | |
| ALBI grade, n (%) | |||
| 1 | 95 (33.20) | 53 (18.50) | < 0.001 |
| 2 | 163 (57.00) | 192 (67.10) | |
| 3 | 28 (9.80) | 41 (14.30) | |
| CTP, n (%) | |||
| A | 106 (37.10) | 58 (20.30) | < 0.001 |
| B | 136 (47.60) | 145 (50.70) | |
| C | 44 (15.40) | 83 (29.00) |
| Characteristics [mean (SD)] | non-PVT (n = 286) | PVT (n = 286) | P value |
| PLT | 78.93 (48.65) | 70.31 (60.19) | 0.06 |
| ALB | 38.50 (6.87) | 35.87 (6.21) | < 0.001 |
| PT | 14.80 (3.52) | 16.41 (6.53) | < 0.001 |
| PTA | 71.29 (20.97) | 63.24 (15.56) | < 0.001 |
| INR | 1.30 (0.32) | 1.42 (0.45) | < 0.001 |
| D-D | 1.84 (2.75) | 3.75 (5.42) | < 0.001 |
| PVD | 12.86 (2.34) | 14.89 (3.34) | < 0.001 |
| SVD | 8.64 (2.90) | 10.43 (3.50) | < 0.001 |
| PVV | 21.08 (5.34) | 19.86 (6.19) | 0.012 |
| GLR | 102.36 (189.29) | 78.97 (97.41) | 0.064 |
| SII | 258.89 (285.64) | 298.02 (473.51) | 0.232 |
| ANRI | 40.18 (70.91) | 27.31 (46.83) | 0.011 |
| PNI | 43.51 (7.67) | 39.47 (6.60) | < 0.001 |
| NLR | 3.42 (3.23) | 4.04 (3.21) | 0.022 |
| PLR | 92.75 (74.60) | 110.43 (77.54) | 0.006 |
| ALRI | 107.63 (256.37) | 77.70 (66.09) | 0.056 |
All patients formed a cohort to explore the PVT-related risk factors. LASSO regression analysis was used to penalize the absolute values of the coefficients (Figure 2). The LASSO results showed that 13 variables were strongly associated with the occurrence of PVT (Supplementary Table 1). Based on the results of the multivariate logistic analysis, 9 variables were identified, including etiology, ascites, GOV, PLT, D-D, PVD, PVV, ANRI, and PLR. We also performed univariate logistic regression analyses of the 13 variables of interest for further comparison (Table 3). Furthermore, VIF and correlation matrix plots (Figure 3) revealed no significant multicollinearity between the variables. Subsequently, nine independent risk factors for PVT were included in the multivariate logistic regression model.
| Characteristics | Univariate analysis | Multivariate analysis | ||||
| OR | CI | P value | OR | CI | P value | |
| Etiology | ||||||
| AIH | Reference | Reference | ||||
| Hepatitis | 1.890 | 1.066-3.350 | 0.029 | 1.772 | 0.869-3.613 | 0.115 |
| Others | 3.348 | 1.749-6.408 | 0.000 | 2.893 | 1.309-6.395 | 0.009 |
| Ascites | ||||||
| No | Reference | Reference | ||||
| Yes | 4.394 | 3.043-6.346 | 0.000 | 2.007 | 1.27-3.174 | 0.003 |
| GOV | ||||||
| No | Reference | Reference | ||||
| Yes | 13.660 | 6.165-30.266 | 0.000 | 5.844 | 2.385-14.321 | 0.000 |
| ANRI | ||||||
| < 48 | Reference | Reference | ||||
| ≥ 48 | 0.418 | 0.257-0.677 | 0.000 | 0.457 | 0.249-0.839 | 0.011 |
| INR | ||||||
| < 1.27 | Reference | Reference | ||||
| ≥ 1.27 | 2.646 | 1.887-3.710 | 0.000 | 1.389 | 0.722-2.672 | 0.326 |
| PLR | ||||||
| ≤ 68.06 | Reference | Reference | ||||
| > 68.06 | 1.846 | 1.305-2.610 | 0.001 | 2.308 | 1.474-3.615 | 0.000 |
| ALB, g/L | ||||||
| < 43 | Reference | Reference | ||||
| ≥ 43 | 0.292 | 0.185-0.460 | 0.000 | 0.700 | 0.387-1.269 | 0.240 |
| D-D, μg/mL | ||||||
| ≤ 2.52 | Reference | Reference | ||||
| > 2.52 | 4.860 | 3.345-7.059 | 0.000 | 2.795 | 1.805-4.33 | 0.000 |
| PLT, × 109/L | ||||||
| < 85 | Reference | Reference | ||||
| ≥ 85 | 0.420 | 0.286-0.615 | 0.000 | 0.520 | 0.306-0.884 | 0.016 |
| PT, s | ||||||
| < 14.4 | Reference | Reference | ||||
| ≥ 14.4 | 2.458 | 1.755-3.442 | 0.000 | 1.279 | 0.67-2.441 | 0.456 |
| PVD, mm | ||||||
| < 14.5 | Reference | Reference | ||||
| ≥ 14.5 | 3.613 | 2.509-5.202 | 0.000 | 2.110 | 1.345-3.31 | 0.001 |
| PVV, cm/s | ||||||
| < 20.05 | Reference | Reference | ||||
| ≥ 20.05 | 0.515 | 0.369-0.718 | 0.000 | 0.640 | 0.424-0.965 | 0.033 |
| SVD, mm | ||||||
| < 8 | Reference | Reference | ||||
| ≥ 8 | 3.680 | 2.511-5.394 | 0.000 | 1.281 | 0.772-2.128 | 0.338 |
Determine the optimal cut-off value of the continuity variable based on the ROC curve and the actual value of the laboratory test. The optimal cutoff values for PLT, D-D, PVV, PVD, ANRI, and PLR were 85, 2.52, 14.5, 20.05, 48, and 68.06, respectively.
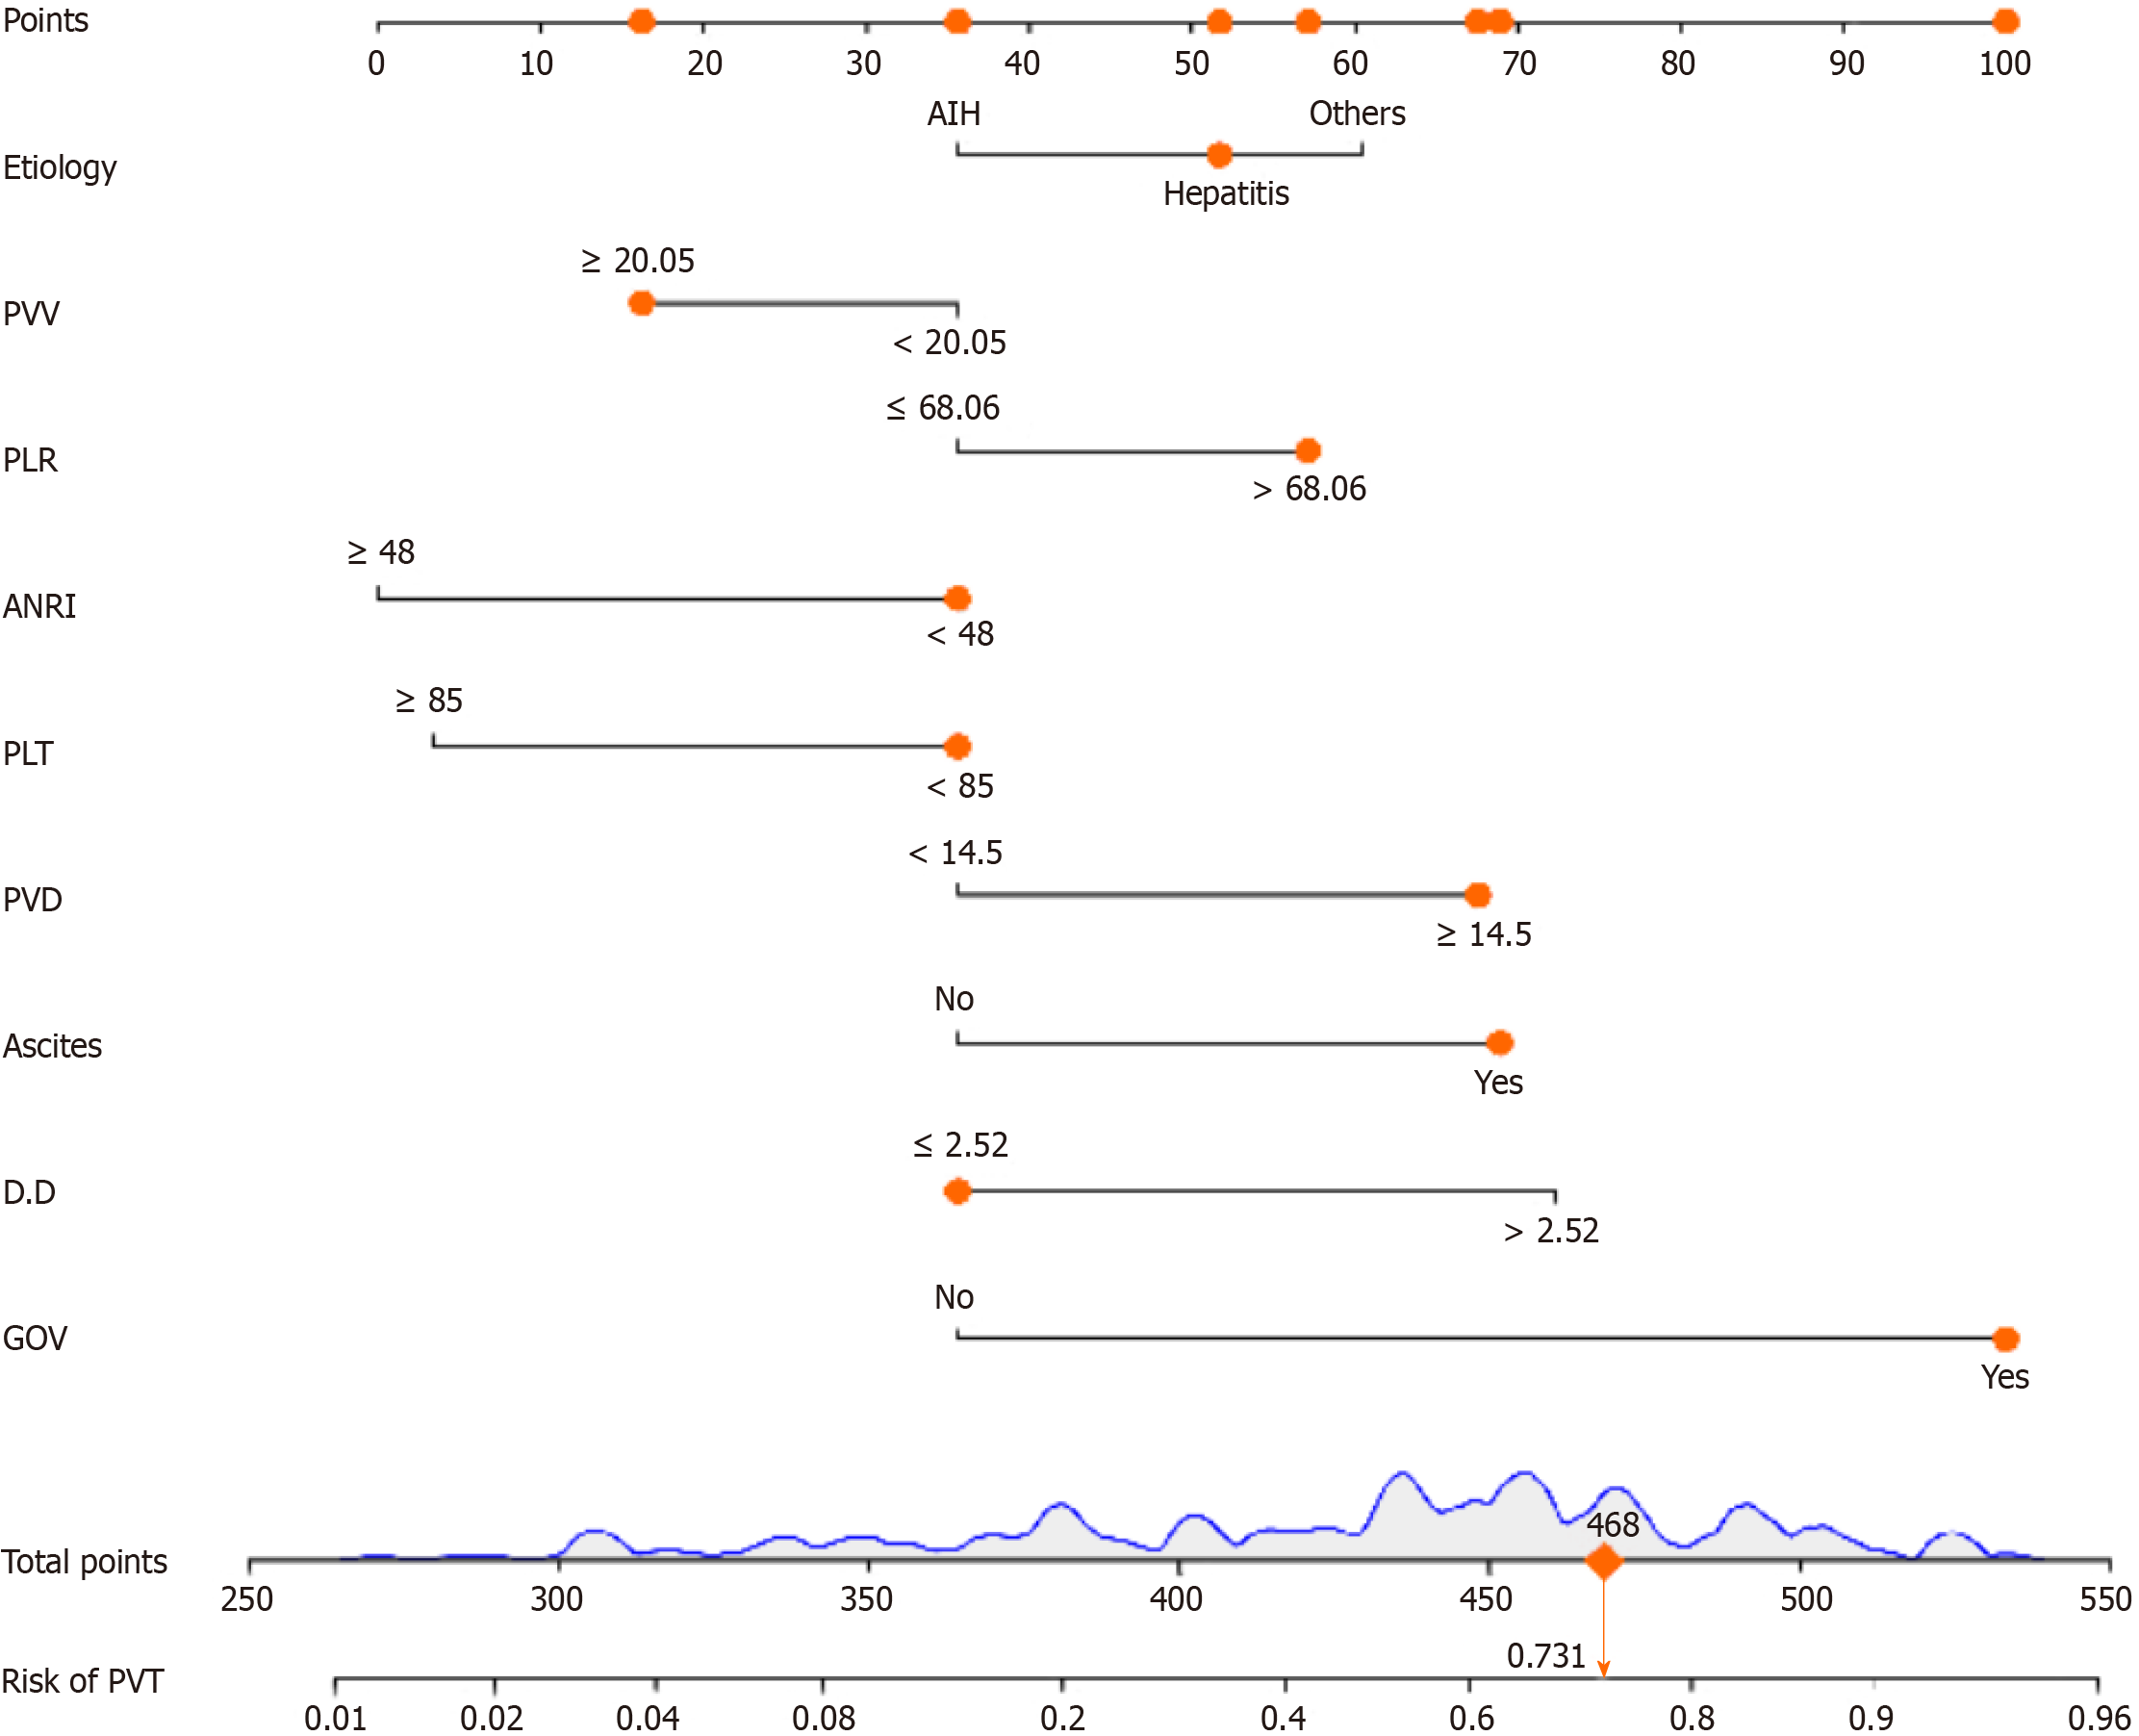
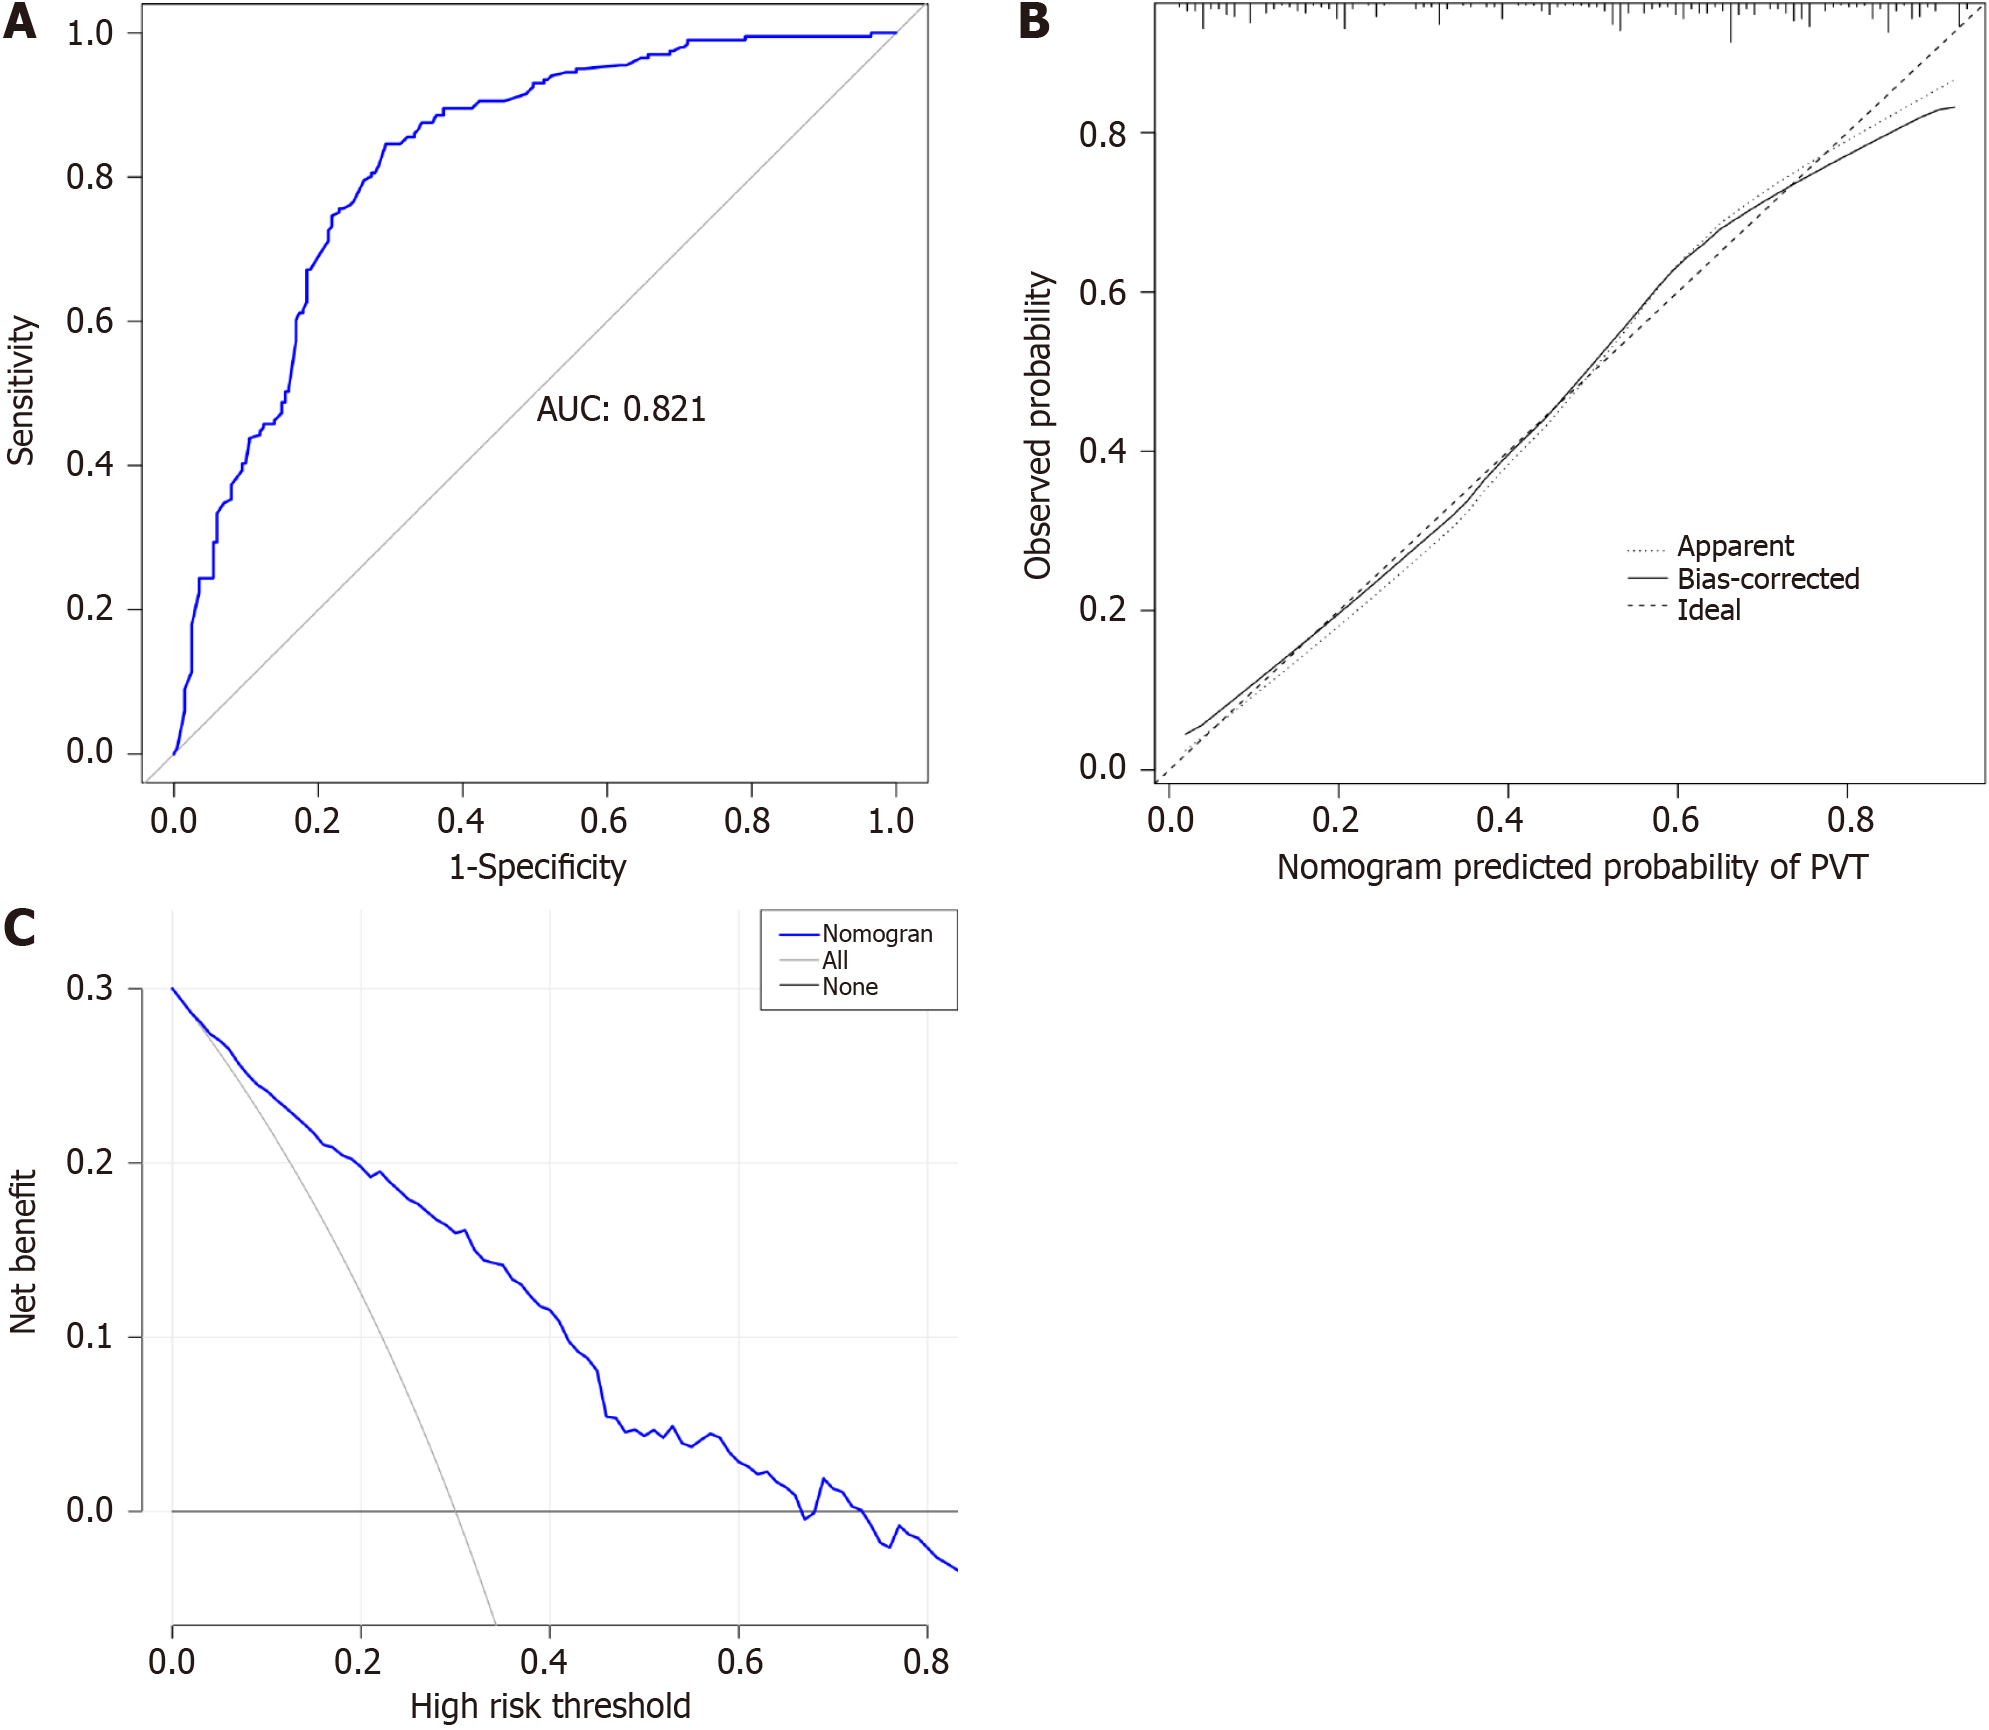
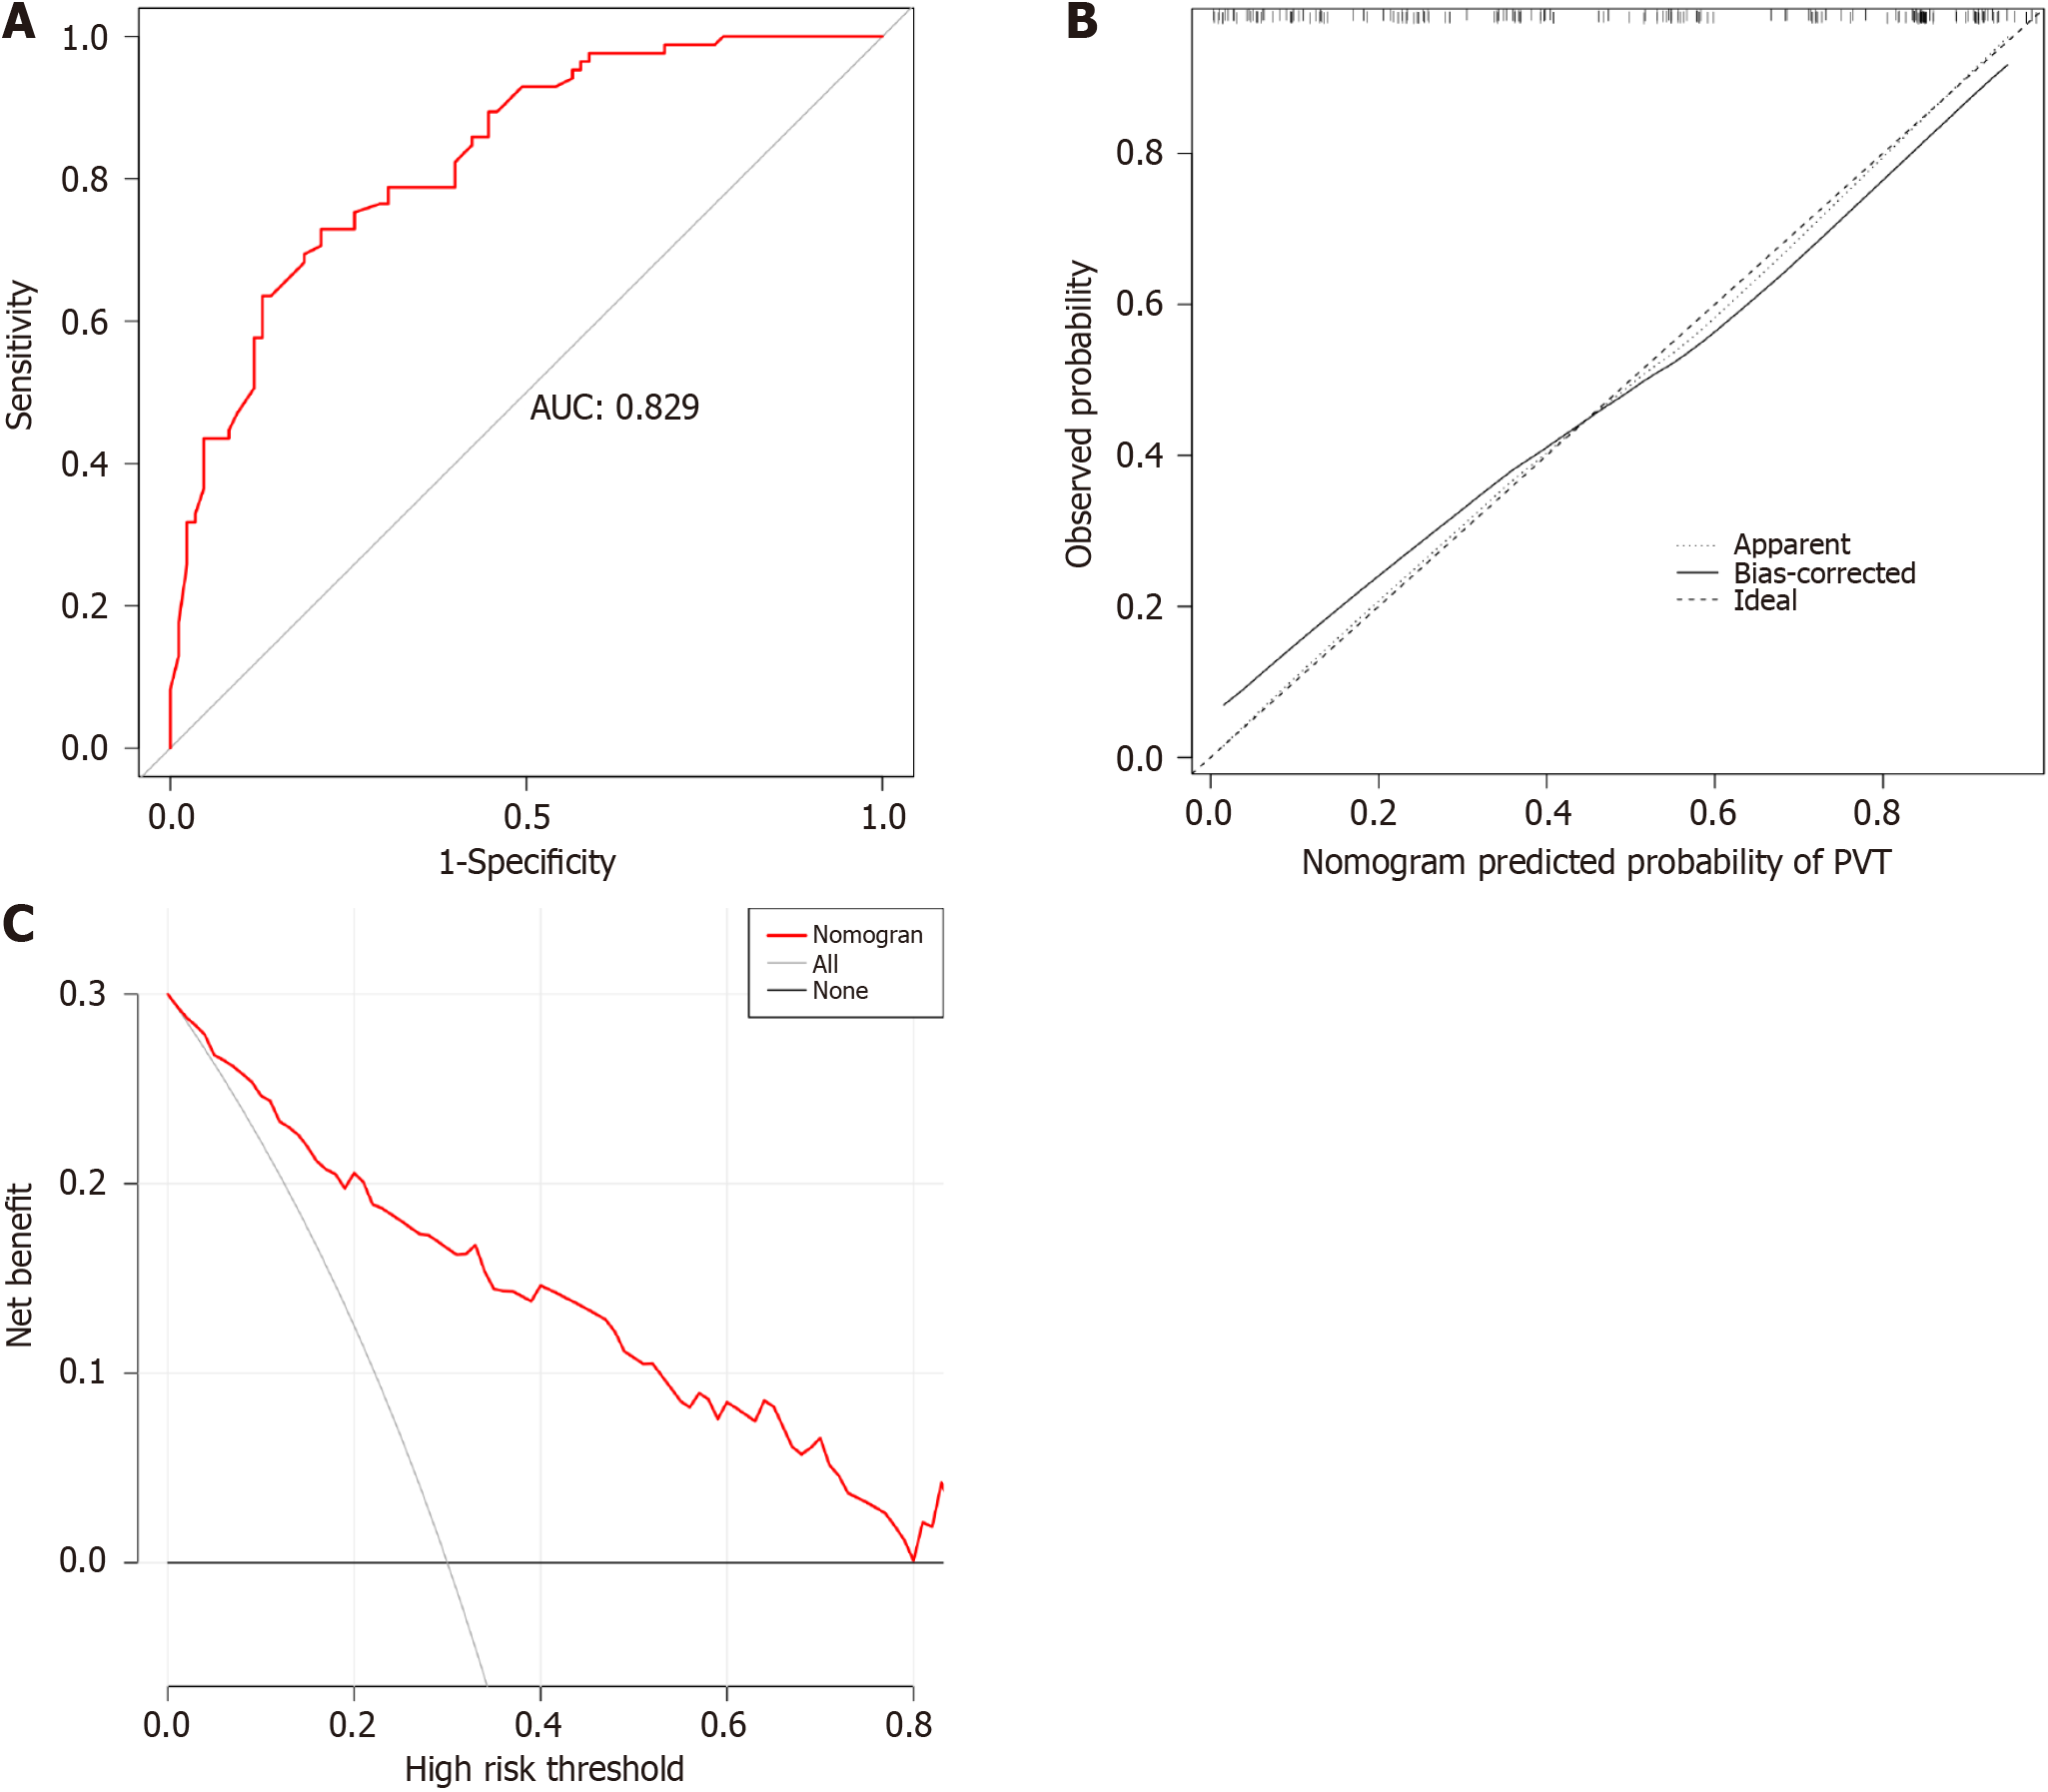
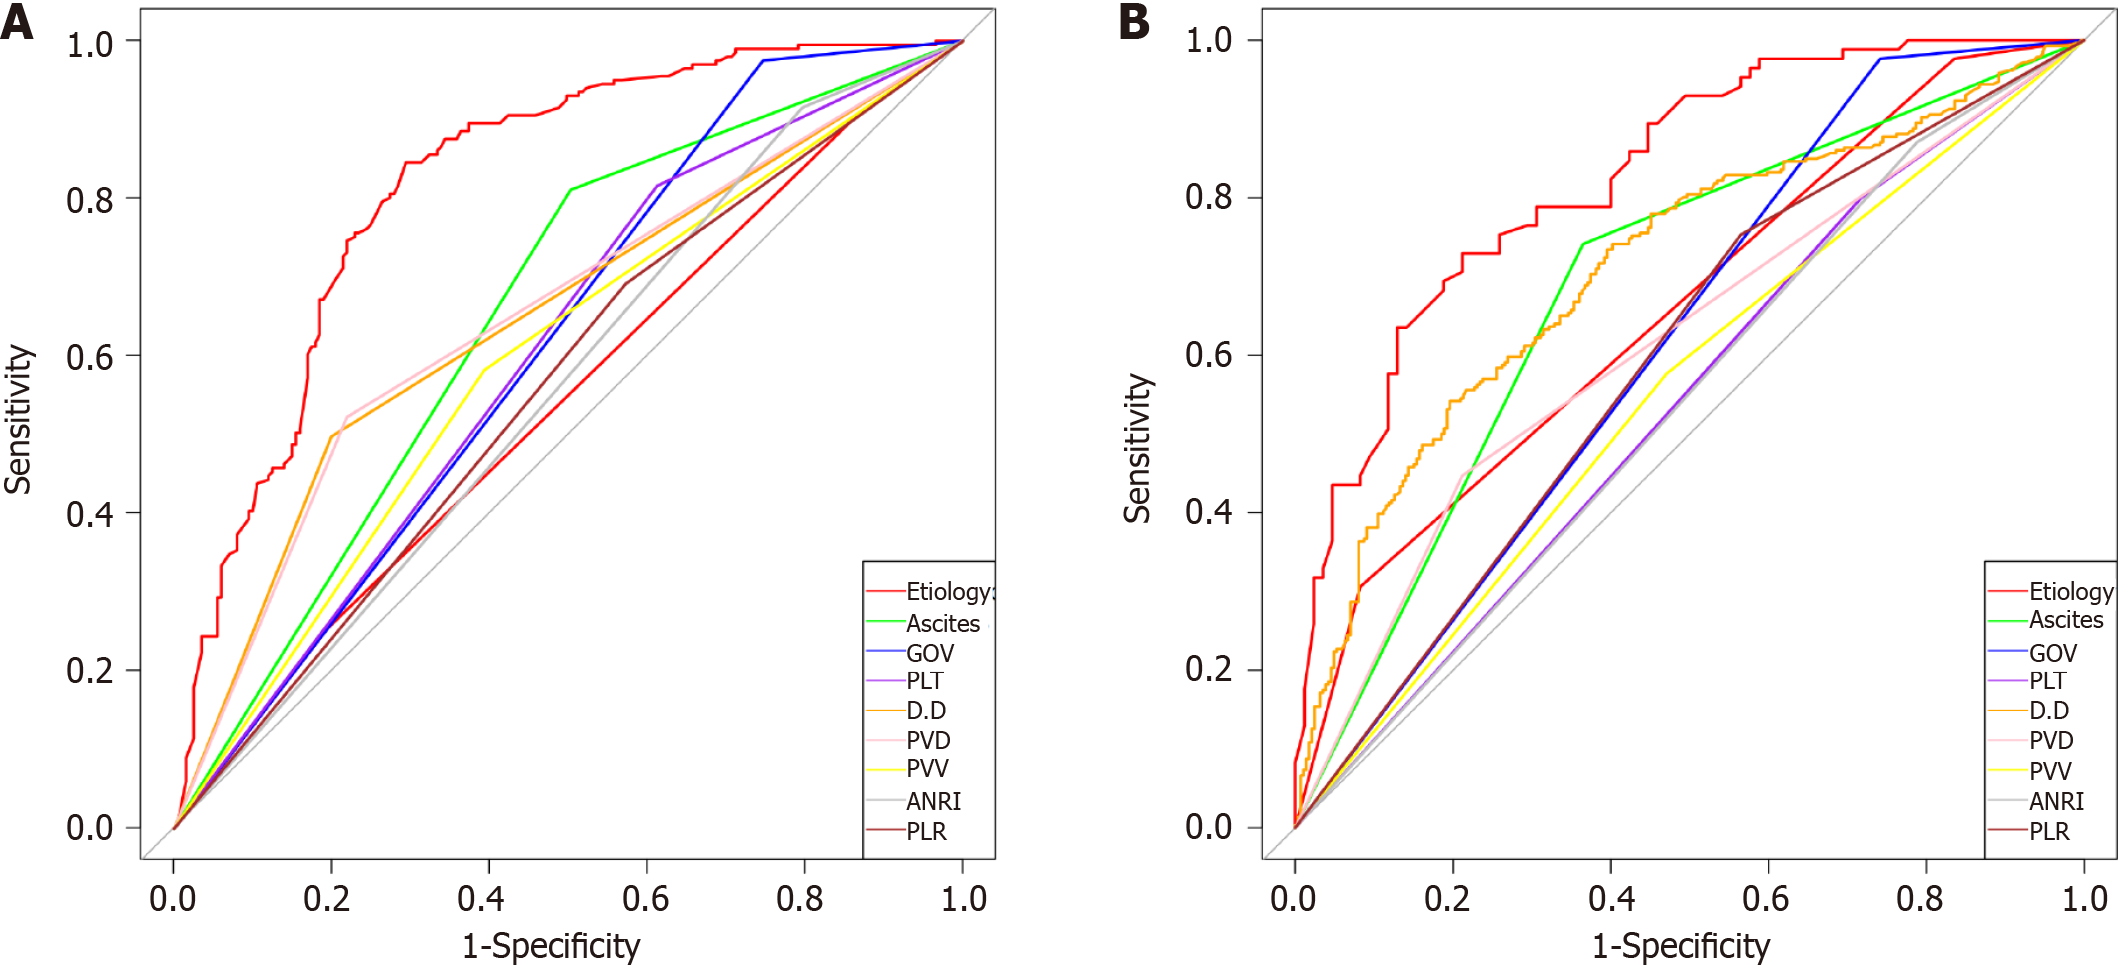
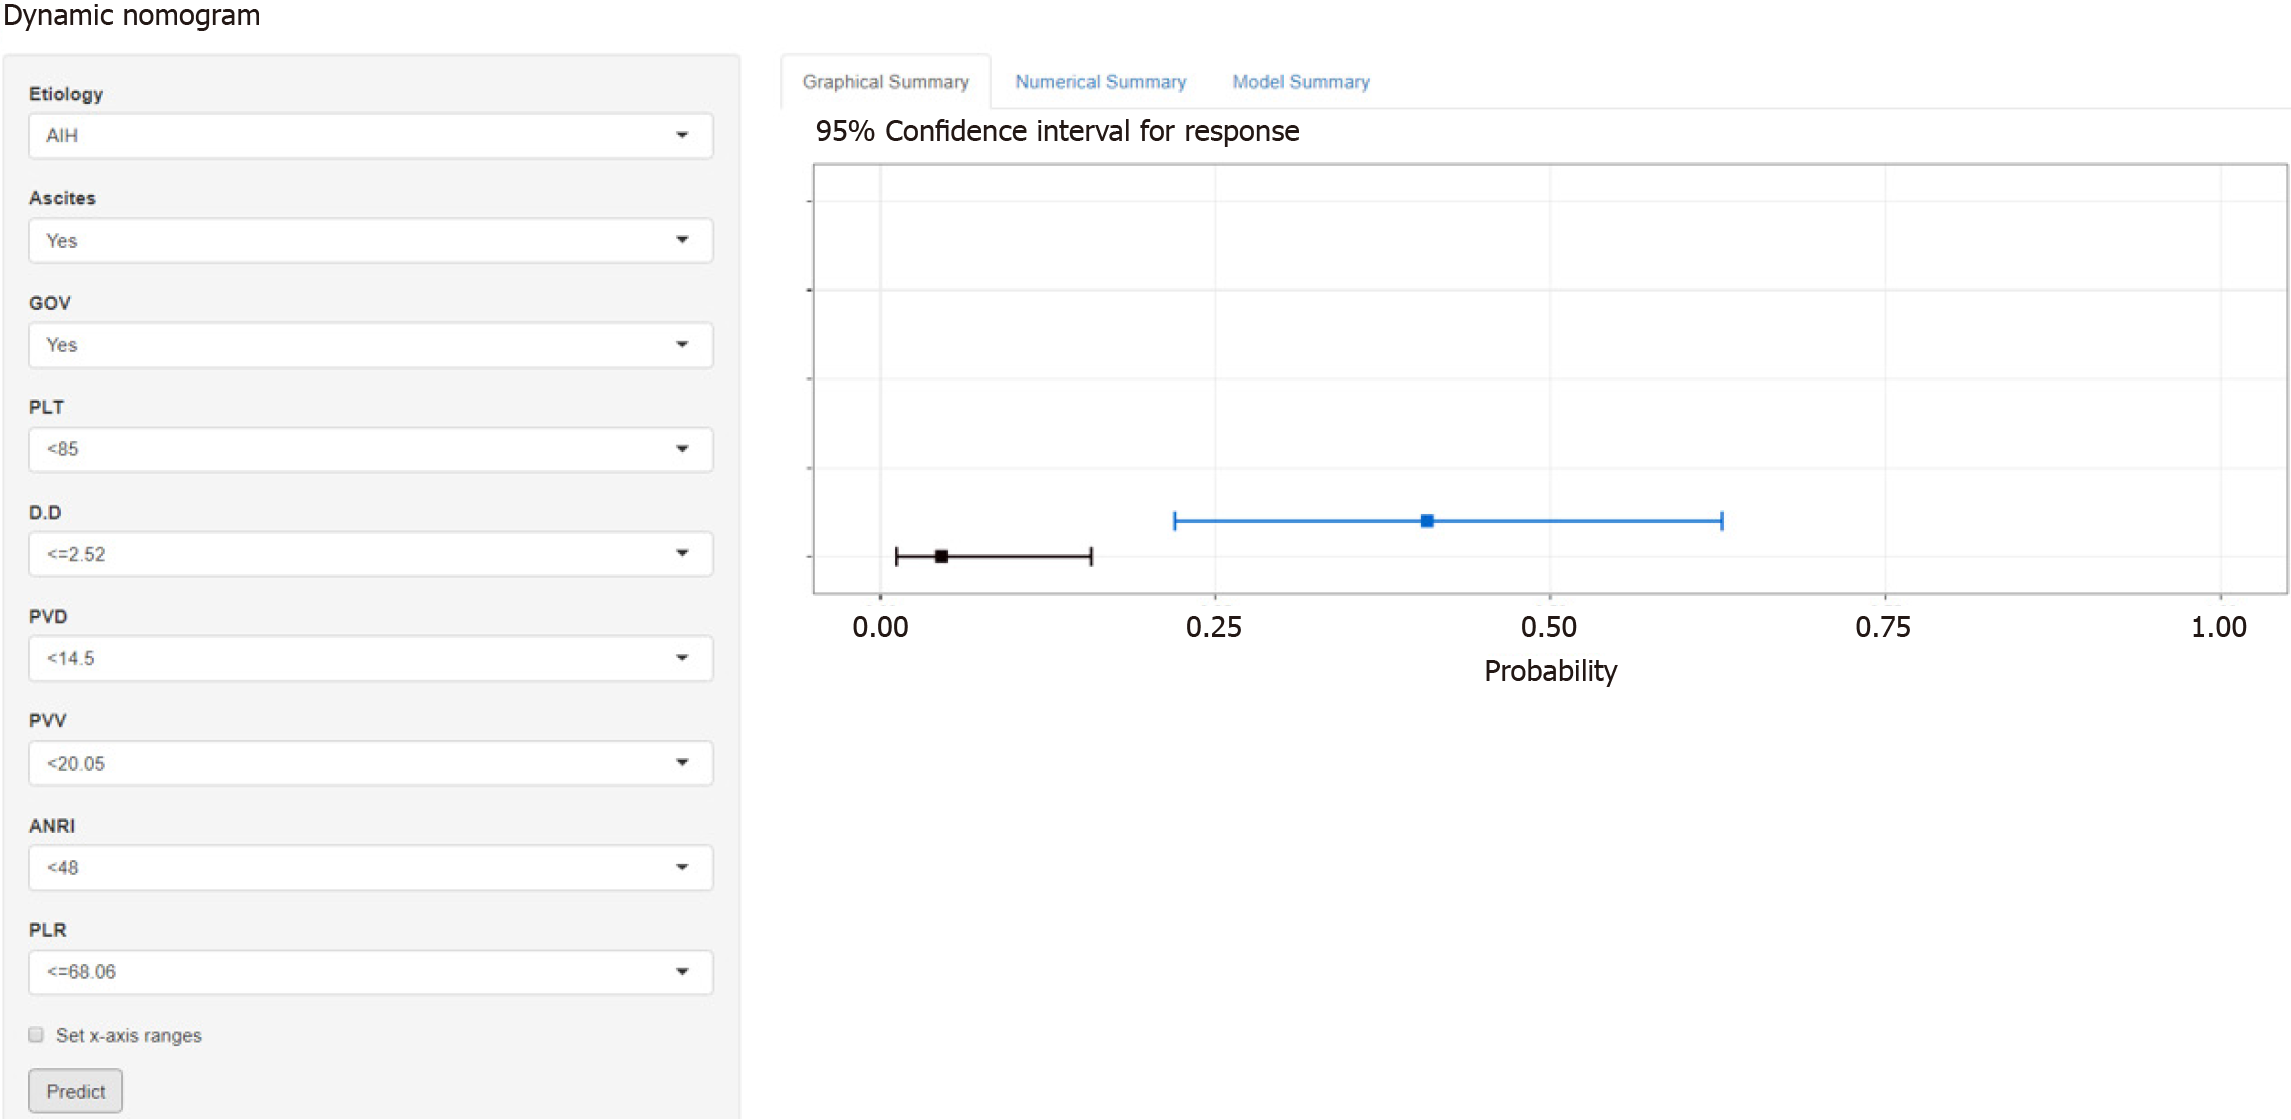
The total population was divided into training (n = 402) and testing (n = 170) groups in a 7:3 ratio, and the baseline characteristics of the two groups are shown in Table 4. A nomogram was constructed based on the independent risk factors in the training group (Figure 4). The ROC curves of the training and testing groups were also plotted, and the AUROC of the nomogram was 0.821 and 0.829 for the training (Figure 5A) and testing groups (Figure 6A), respectively. To verify the calibration performance of the nomogram, calibration curves were plotted for the training (Figure 5B) and testing groups (Figure 6B). The calibration plot showed excellent predictive accuracy between the actual and predicted probabilities. To further evaluate the value of the model for clinical application, the DCA of the nomogram was plotted for the training group (Figure 5C) and testing groups (Figure 6C). The DCA results showed that the nomogram had good clinical application value. To further validate the discrimination of the nomogram, the ROC curve of each independent risk factor and nomogram was plotted for the training and testing groups (Figure 7). Finally, we constructed an online web calculator based on the nomogram (https://glfl993823.shinyapps.io/PVT_DynNomapp/). Figure 8 shows the application interface of the web calculator. Finally, the optimal cutoff value for the total nomogram score was 0.513. The sensitivity and specificity of the optimal cutoff values were 0.822 and 0.706, respectively (Supplementary Figure 1).
| Characteristics | Training group (n = 402) | Testing group (n = 170) | P value |
| Etiology | |||
| AIH | 44 (10.90) | 16 (9.40) | 0.572 |
| Hepatitis | 268 (66.70) | 121 (71.20) | |
| Others | 90 (22.40) | 33 (19.40) | |
| Ascites | |||
| No | 138 (34.30) | 76 (44.70) | 0.024 |
| Yes | 264 (65.70) | 94 (55.30) | |
| GOV | |||
| No | 56 (13.90) | 24 (14.10) | 1.000 |
| Yes | 346 (86.1) | 146 (85.90) | |
| PLT | |||
| < 85 | 287 (71.40) | 129 (75.90) | 0.318 |
| ≥ 85 | 115 (28.60) | 41 (24.10) | |
| D-D | |||
| ≤ 2.52 | 262 (65.20) | 99 (58.20) | 0.140 |
| >2.52 | 140 (34.80) | 71 (41.80) | |
| PVD | |||
| < 14.5 | 253 (62.90) | 114 (67.10) | 0.398 |
| ≥ 14.5 | 149 (37.10) | 56 (32.90) | |
| PVV | |||
| < 20.05 | 196 (48.80) | 89 (52.40) | 0.487 |
| ≥ 20.05 | 206 (51.20) | 81 (47.60) | |
| ANRI | |||
| < 48 | 344 (85.60) | 141 (82.90) | 0.501 |
| ≥ 48 | 58 (14.40) | 29 (17.10) | |
| PLR | |||
| ≤ 68.06 | 148 (36.80) | 58 (34.10) | 0.604 |
| > 68.06 | 254 (63.20) | 112 (65.90) |
The prevalence of PVT in patients awaiting liver transplantation ranges from 2% to 26%[20]. In contrast, prospective studies have shown that the incidence of PVT ranges from 1.6% to 8.4%[21,22]. Studies have shown that PVT is often associated with nonalcoholic steatohepatitis[23]. Therefore, the different incidences and prevalence of PVT may be associated with cirrhotic etiology. This may also be one reason for the large variation in the incidence of PVT in studies conducted in different countries. Similarly, a cirrhotic etiology was found to be an independent risk factor for PVT in the present study. Regarding clinical signs, patients with cirrhosis with PVT had more common ascites and GOV. On laboratory tests, patients with cirrhosis with PVT had higher D-D and lower ALB and PLT levels, while patients with cirrhosis with PVT had wider PVD and slower PVV. Regarding systemic inflammatory markers, patients with cirrhosis and PVT had higher NLR and PLR and lower ANRI levels.
The mechanisms underlying the development of PVT are still being investigated and may be related to a hypercoagulable state, platelet activation, endothelial cell injury, or hemodynamic changes[24,25]. SVD, PVD, PLT, PVV, GOV, D-D, ALB, and ascites have all been reported as independent risk factors of PVT[26-29]. In the present study, PVV, PVD, GOV, D-D, PLT, and ascites were found to be independent risk predictors of PVT.
The diagnosis of portal vein thrombosis associated are still facing great challenges in the process of liver cirrhosis. Early diagnosis and intervention of portal vein thrombosis are of great significance to patient prognosis. Systemic inflammatory markers and clinical indices are closely associated with disease diagnosis and prognosis. In this study, we explored the correlation between systemic inflammatory markers, clinical indices, and PVT. Compared to other PVT prognostic models[30,31], PLR was also found to be an independent risk factor for PVT in present study. The model in this study used clinical indicators and indices as predictors; the indicators were easy to calculate, and the nomogram was more convenient for clinicians to apply.
The AST is a routine test for patients with cirrhosis. It is commonly used to assess the severity of liver diseases[32]. Recently, studies have reported that prognostic indices based on inflammatory cells such as neutrophils and lymphocytes can reflect the survival of various malignancies, and ANRI is a commonly used index[33,34]. Interestingly, ANRI was found to be an independent risk factor for PVT in this study.
Relevant studies on the novel markers of PVT have also been reported. A disintegrin and metalloprotease with thrombospondin 1 repeats Nr.13 (ADAMTS-13), is expected to be the most promising marker of PVT. ADAMTS-13 activity is inversely correlated with PVT, and is independently associated with PVT in patients with cirrhosis[35]. A recent prospective study showed that an ADAMTS-13/VWF ratio < 0.4 in patients with compensated cirrhosis could be a reliable biomarker for predicting the development of PVT[36]. The intestinal flora is also closely related to the formation of thrombosis[37]. And the portal vein is a bridge between the intestines and liver. The intestinal flora and related metabolites may also be essential for portal vein formation. However, further research is needed on the value of these indicators in PVT. With continuous research and the application of new biotechnologies, an increasing number of novel markers will be discovered, which will be helpful in diagnosing PVT.
The present study had several strengths and limitations. The sample size included in this study is one of the strengths of this study. However, this was a retrospective, single-center study, and only patients with cirrhosis who developed PVT during the natural course of cirrhosis were included. Therefore, a large multicenter study is needed to obtain a more representative sample and a higher statistical efficacy of the results.
A nomogram for predicting PVT in a cirrhotic population was successfully constructed and validated based on etiology, PLT, ANRI, ascites, GOV, D-D, PVD, PLR, and PVV. Meanwhile, a more intuitive and easy-to-use web calculator for clinical decision-makers was constructed based on the nomogram. The model will help identify people at a high risk of PVT in cirrhosis, which is expected to enable early intervention and improve patient prognosis.
Portal vein thrombosis (PVT) is one of the complications of cirrhosis and one of the major public health concerns. PVT is found incidentally during the natural course of cirrhotic patients, and the formation of PVT is closely related to patient prognosis.
The identification of people at high risk for PVT is crucial for the prevention and treatment of PVT, therefore, it is necessary to develop an early prediction model of the probability of developing PVT in cirrhotic patients to guide clinical decision-making.
Development and validation of a nomogram and network calculator based on clinical blood inflammation markers for early identification of people at high risk of PVT.
By 1:1 propensity score matching, 572 eligible patients with cirrhosis were screened and their relevant clinical data were collected. Risk factors associated with the development of PVT were identified using the least absolute shrinkage and selection operator and multivariate logistic regression analysis. Variance inflation factor and correlation matrix plots tested for multicollinearity between variables. Finally, nomograms and network calculators predicting the risk of PVT occurrence were constructed and validated based on the independent risk factors for PVT.
A total of 572 patients with cirrhosis were included in this study. The final nine parameters identified as independent risk factors for PVT in cirrhosis were etiology, ascites, gastroesophageal varices (GOV), platelet count (PLT), D-dimer (D-D), portal vein diameter (PVD), portal vein velocity (PVV), aspartate aminotransferase-to-neutrophil ratio index (ANRI), and platelet-to-lymphocyte ratio (PLR). The area under the receiver operating characteristic of the constructed nomogram was 0.821 and 0.829 in the training and test groups, respectively. The calibration curves and DCA showed good clinical performance. Finally, the best threshold for the total score of the nomogram was 0.513. The sensitivity and specificity of the best threshold were 0.822 and 0.706, respectively.
Etiology, ascites, GOV, PLT, D-D, PVD, PVV, ANRI, and PLR were the independent risk factors for PVT in cirrhosis. The constructed nomogram had its excellent clinical performance.
In this article, we constructed a prediction model about the risk of developing PVT in the natural course of cirrhosis, and also confirmed that inflammatory markers have a good application value in the diagnosis of PVT. A convenient web-based calculator was also constructed to enable the assessment of the risk of developing PVT in patients with cirrhosis.
Provenance and peer review: Unsolicited article; Externally peer reviewed.
Peer-review model: Single blind
Specialty type: Gastroenterology and hepatology
Country/Territory of origin: China
Peer-review report’s scientific quality classification
Grade A (Excellent): 0
Grade B (Very good): B
Grade C (Good): 0
Grade D (Fair): 0
Grade E (Poor): 0
P-Reviewer: Sultana N, Bangladesh S-Editor: Gong ZM L-Editor: A P-Editor: Zhao YQ
| 1. | Hepatobiliary Disease Study Group; Chinese Society of Gastroenterology; Chinese Medical Association. Consensus for management of portal vein thrombosis in liver cirrhosis (2020, Shanghai). J Dig Dis. 2021;22:176-186. [RCA] [PubMed] [DOI] [Full Text] [Full Text (PDF)] [Cited by in Crossref: 58] [Cited by in RCA: 59] [Article Influence: 11.8] [Reference Citation Analysis (0)] |
| 2. | Ogren M, Bergqvist D, Björck M, Acosta S, Eriksson H, Sternby NH. Portal vein thrombosis: prevalence, patient characteristics and lifetime risk: a population study based on 23,796 consecutive autopsies. World J Gastroenterol. 2006;12:2115-2119. [RCA] [PubMed] [DOI] [Full Text] [Full Text (PDF)] [Cited by in CrossRef: 310] [Cited by in RCA: 327] [Article Influence: 16.4] [Reference Citation Analysis (2)] |
| 3. | Intagliata NM, Argo CK, Stine JG, Lisman T, Caldwell SH, Violi F; faculty of the 7th International Coagulation in Liver Disease. Concepts and Controversies in Haemostasis and Thrombosis Associated with Liver Disease: Proceedings of the 7th International Coagulation in Liver Disease Conference. Thromb Haemost. 2018;118:1491-1506. [RCA] [PubMed] [DOI] [Full Text] [Full Text (PDF)] [Cited by in Crossref: 114] [Cited by in RCA: 134] [Article Influence: 16.8] [Reference Citation Analysis (1)] |
| 4. | Ponziani FR, Zocco MA, Garcovich M, D'Aversa F, Roccarina D, Gasbarrini A. What we should know about portal vein thrombosis in cirrhotic patients: a changing perspective. World J Gastroenterol. 2012;18:5014-5020. [RCA] [PubMed] [DOI] [Full Text] [Full Text (PDF)] [Cited by in CrossRef: 37] [Cited by in RCA: 43] [Article Influence: 3.1] [Reference Citation Analysis (0)] |
| 5. | Stine JG, Shah PM, Cornella SL, Rudnick SR, Ghabril MS, Stukenborg GJ, Northup PG. Portal vein thrombosis, mortality and hepatic decompensation in patients with cirrhosis: A meta-analysis. World J Hepatol. 2015;7:2774-2780. [RCA] [PubMed] [DOI] [Full Text] [Full Text (PDF)] [Cited by in Crossref: 85] [Cited by in RCA: 105] [Article Influence: 9.5] [Reference Citation Analysis (0)] |
| 6. | Qi X, Su C, Ren W, Yang M, Jia J, Dai J, Xu W, Guo X. Association between portal vein thrombosis and risk of bleeding in liver cirrhosis: A systematic review of the literature. Clin Res Hepatol Gastroenterol. 2015;39:683-691. [RCA] [PubMed] [DOI] [Full Text] [Cited by in Crossref: 40] [Cited by in RCA: 36] [Article Influence: 3.3] [Reference Citation Analysis (0)] |
| 7. | Kuplay H, Erdoğan SB, Bastopcu M, Arslanhan G, Baykan DB, Orhan G. The neutrophil-lymphocyte ratio and the platelet-lymphocyte ratio correlate with thrombus burden in deep venous thrombosis. J Vasc Surg Venous Lymphat Disord. 2020;8:360-364. [RCA] [PubMed] [DOI] [Full Text] [Cited by in Crossref: 19] [Cited by in RCA: 44] [Article Influence: 7.3] [Reference Citation Analysis (0)] |
| 8. | Carr BI, Guerra V, Donghia R. Portal Vein Thrombosis and Markers of Inflammation in Hepatocellular Carcinoma. J Gastrointest Cancer. 2020;51:1141-1147. [RCA] [PubMed] [DOI] [Full Text] [Cited by in Crossref: 8] [Cited by in RCA: 12] [Article Influence: 2.4] [Reference Citation Analysis (0)] |
| 9. | Li S, Liu K, Gao Y, Zhao L, Zhang R, Fang H, Tao Y, Liu H, Zhao J, Xia Z, Xu Y, Song B. Prognostic value of systemic immune-inflammation index in acute/subacute patients with cerebral venous sinus thrombosis. Stroke Vasc Neurol. 2020;5:368-373. [RCA] [PubMed] [DOI] [Full Text] [Full Text (PDF)] [Cited by in Crossref: 24] [Cited by in RCA: 52] [Article Influence: 8.7] [Reference Citation Analysis (0)] |
| 10. | Li S, Xu W, Liao M, Zhou Y, Weng J, Ren L, Yu J, Liao W, Huang Z. The Significance of Gamma-Glutamyl Transpeptidase to Lymphocyte Count Ratio in the Early Postoperative Recurrence Monitoring and Prognosis Prediction of AFP-Negative Hepatocellular Carcinoma. J Hepatocell Carcinoma. 2021;8:23-33. [RCA] [PubMed] [DOI] [Full Text] [Full Text (PDF)] [Cited by in Crossref: 5] [Cited by in RCA: 22] [Article Influence: 4.4] [Reference Citation Analysis (0)] |
| 11. | Chen W, Hong D, Chen Z, Dai X, Cao J, Yu M, Li L. Gamma-glutamyl transpeptidase to platelet and gamma-glutamyl transpeptidase to lymphocyte ratio in a sample of Chinese Han population. BMC Gastroenterol. 2022;22:442. [RCA] [PubMed] [DOI] [Full Text] [Reference Citation Analysis (0)] |
| 12. | Wang D, Hu X, Xiao L, Long G, Yao L, Wang Z, Zhou L. Prognostic Nutritional Index and Systemic Immune-Inflammation Index Predict the Prognosis of Patients with HCC. J Gastrointest Surg. 2021;25:421-427. [RCA] [PubMed] [DOI] [Full Text] [Full Text (PDF)] [Cited by in Crossref: 108] [Cited by in RCA: 146] [Article Influence: 29.2] [Reference Citation Analysis (0)] |
| 13. | Liu L, Wang W, Zhang Y, Long J, Zhang Z, Li Q, Chen B, Li S, Hua Y, Shen S, Peng B. Declined Preoperative Aspartate Aminotransferase to Neutrophil Ratio Index Predicts Poor Prognosis in Patients with Intrahepatic Cholangiocarcinoma after Hepatectomy. Cancer Res Treat. 2018;50:538-550. [RCA] [PubMed] [DOI] [Full Text] [Full Text (PDF)] [Cited by in Crossref: 10] [Cited by in RCA: 20] [Article Influence: 2.2] [Reference Citation Analysis (0)] |
| 14. | Kudo M. Newly Developed Modified ALBI Grade Shows Better Prognostic and Predictive Value for Hepatocellular Carcinoma. Liver Cancer. 2022;11:1-8. [RCA] [PubMed] [DOI] [Full Text] [Cited by in Crossref: 5] [Cited by in RCA: 48] [Article Influence: 9.6] [Reference Citation Analysis (0)] |
| 15. | Zhao LY, Yang DD, Ma XK, Liu MM, Wu DH, Zhang XP, Ruan DY, Lin JX, Wen JY, Chen J, Lin Q, Dong M, Qi JJ, Hu PS, Zeng ZL, Chen ZH, Wu XY. The Prognostic Value of aspartate aminotransferase to lymphocyte ratio and systemic immune-inflammation index for Overall Survival of Hepatocellular Carcinoma Patients Treated with palliative Treatments. J Cancer. 2019;10:2299-2311. [RCA] [PubMed] [DOI] [Full Text] [Full Text (PDF)] [Cited by in Crossref: 22] [Cited by in RCA: 42] [Article Influence: 6.0] [Reference Citation Analysis (0)] |
| 16. | Balachandran VP, Gonen M, Smith JJ, DeMatteo RP. Nomograms in oncology: more than meets the eye. Lancet Oncol. 2015;16:e173-e180. [RCA] [PubMed] [DOI] [Full Text] [Cited by in Crossref: 1119] [Cited by in RCA: 2564] [Article Influence: 233.1] [Reference Citation Analysis (0)] |
| 17. | Nie G, Zhang H, Yan J, Xie D, Li X. Construction and validation of a novel nomogram to predict cancer-specific survival in patients with gastric adenocarcinoma. Front Oncol. 2023;13:1114847. [RCA] [PubMed] [DOI] [Full Text] [Reference Citation Analysis (0)] |
| 18. | Nie GL, Luo W, Yan J, Wang HP, Li X. Construction of Predictive and Prognostic Nomograms for Distant Metastases in Hepatocellular Carcinoma Based on SEER Database. CSP. 2022;1:11-24. [RCA] [DOI] [Full Text] [Cited by in Crossref: 1] [Reference Citation Analysis (0)] |
| 19. | Huang Y, Li W, Macheret F, Gabriel RA, Ohno-Machado L. A tutorial on calibration measurements and calibration models for clinical prediction models. J Am Med Inform Assoc. 2020;27:621-633. [RCA] [PubMed] [DOI] [Full Text] [Full Text (PDF)] [Cited by in Crossref: 68] [Cited by in RCA: 267] [Article Influence: 53.4] [Reference Citation Analysis (0)] |
| 20. | Chen H, Turon F, Hernández-Gea V, Fuster J, Garcia-Criado A, Barrufet M, Darnell A, Fondevila C, Garcia-Valdecasas JC, Garcia-Pagán JC. Nontumoral portal vein thrombosis in patients awaiting liver transplantation. Liver Transpl. 2016;22:352-365. [RCA] [PubMed] [DOI] [Full Text] [Cited by in Crossref: 79] [Cited by in RCA: 104] [Article Influence: 10.4] [Reference Citation Analysis (0)] |
| 21. | Noronha Ferreira C, Marinho RT, Cortez-Pinto H, Ferreira P, Dias MS, Vasconcelos M, Alexandrino P, Serejo F, Pedro AJ, Gonçalves A, Palma S, Leite I, Reis D, Damião F, Valente A, Xavier Brito L, Baldaia C, Fatela N, Ramalho F, Velosa J. Incidence, predictive factors and clinical significance of development of portal vein thrombosis in cirrhosis: A prospective study. Liver Int. 2019;39:1459-1467. [RCA] [PubMed] [DOI] [Full Text] [Cited by in Crossref: 49] [Cited by in RCA: 77] [Article Influence: 11.0] [Reference Citation Analysis (0)] |
| 22. | Turon F, Driever EG, Baiges A, Cerda E, García-Criado Á, Gilabert R, Bru C, Berzigotti A, Nuñez I, Orts L, Reverter JC, Magaz M, Camprecios G, Olivas P, Betancourt-Sanchez F, Perez-Campuzano V, Blasi A, Seijo S, Reverter E, Bosch J, Borràs R, Hernandez-Gea V, Lisman T, Garcia-Pagan JC. Predicting portal thrombosis in cirrhosis: A prospective study of clinical, ultrasonographic and hemostatic factors. J Hepatol. 2021;75:1367-1376. [RCA] [PubMed] [DOI] [Full Text] [Cited by in Crossref: 35] [Cited by in RCA: 122] [Article Influence: 24.4] [Reference Citation Analysis (0)] |
| 23. | Stine JG, Shah NL, Argo CK, Pelletier SJ, Caldwell SH, Northup PG. Increased risk of portal vein thrombosis in patients with cirrhosis due to nonalcoholic steatohepatitis. Liver Transpl. 2015;21:1016-1021. [RCA] [PubMed] [DOI] [Full Text] [Cited by in Crossref: 92] [Cited by in RCA: 116] [Article Influence: 10.5] [Reference Citation Analysis (0)] |
| 24. | Stotts MJ, Wentworth BJ, Northup PG. Management of Portal Vein Thrombosis in Cirrhosis. Semin Liver Dis. 2021;41:79-86. [RCA] [PubMed] [DOI] [Full Text] [Cited by in Crossref: 4] [Cited by in RCA: 12] [Article Influence: 2.4] [Reference Citation Analysis (0)] |
| 25. | Naymagon L, Tremblay D, Mascarenhas J, Schiano T. Characteristics, anticoagulation, and outcomes of portal vein thrombosis after intra-abdominal surgery. Surgery. 2021;169:1175-1181. [RCA] [PubMed] [DOI] [Full Text] [Cited by in Crossref: 3] [Cited by in RCA: 13] [Article Influence: 2.2] [Reference Citation Analysis (0)] |
| 26. | Stine JG, Wang J, Shah PM, Argo CK, Intagliata N, Uflacker A, Caldwell SH, Northup PG. Decreased portal vein velocity is predictive of the development of portal vein thrombosis: A matched case-control study. Liver Int. 2018;38:94-101. [RCA] [PubMed] [DOI] [Full Text] [Cited by in Crossref: 85] [Cited by in RCA: 119] [Article Influence: 14.9] [Reference Citation Analysis (0)] |
| 27. | Péré G, Basselerie H, Maulat C, Pitocco A, Leblanc P, Philis A, Julio CH, Tuyeras G, Buscail E, Carrere N. Splenic volume and splenic vein diameter are independent pre-operative risk factors of portal vein thrombosis after splenectomy: a retrospective cohort study. BMC Surg. 2021;21:366. [RCA] [PubMed] [DOI] [Full Text] [Full Text (PDF)] [Cited by in Crossref: 10] [Cited by in RCA: 13] [Article Influence: 2.6] [Reference Citation Analysis (0)] |
| 28. | Xu W, Cheng Y, Tu B. [Construction and validation of a nomogram for predicting the risk of portal vein thrombosis after splenectomy in patients with hepatitis B cirrhosis]. Nanfang Yikedaxue Xuebao. 2020;40:1265-1272. [RCA] [DOI] [Full Text] [Cited by in RCA: 2] [Reference Citation Analysis (0)] |
| 29. | Basili S, Carnevale R, Nocella C, Bartimoccia S, Raparelli V, Talerico G, Stefanini L, Romiti GF, Perticone F, Corazza GR, Piscaglia F, Pietrangelo A, Violi F; PRO‐LIVER Collaborators. Serum Albumin Is Inversely Associated With Portal Vein Thrombosis in Cirrhosis. Hepatol Commun. 2019;3:504-512. [RCA] [PubMed] [DOI] [Full Text] [Full Text (PDF)] [Cited by in Crossref: 58] [Cited by in RCA: 60] [Article Influence: 8.6] [Reference Citation Analysis (0)] |
| 30. | Xing Y, Tian Z, Jiang Y, Guan G, Niu Q, Sun X, Han R, Jing X. A practical nomogram based on systemic inflammatory markers for predicting portal vein thrombosis in patients with liver cirrhosis. Ann Med. 2022;54:302-309. [RCA] [PubMed] [DOI] [Full Text] [Full Text (PDF)] [Cited by in Crossref: 4] [Cited by in RCA: 40] [Article Influence: 10.0] [Reference Citation Analysis (0)] |
| 31. | Han JB, Shu QH, Zhang YF, Yi YX. Predictive Value of Inflammation Biomarkers in Patients with Portal Vein Thrombosis. J Clin Transl Hepatol. 2021;9:384-391. [RCA] [PubMed] [DOI] [Full Text] [Full Text (PDF)] [Cited by in RCA: 4] [Reference Citation Analysis (0)] |
| 32. | Kim HC, Nam CM, Jee SH, Han KH, Oh DK, Suh I. Normal serum aminotransferase concentration and risk of mortality from liver diseases: prospective cohort study. BMJ. 2004;328:983. [RCA] [PubMed] [DOI] [Full Text] [Cited by in Crossref: 391] [Cited by in RCA: 436] [Article Influence: 19.8] [Reference Citation Analysis (0)] |
| 33. | Ji F, Fu S, Guo Z, Pang H, Chen D, Wang X, Ju W, Wang D, He X, Hua Y, Peng B. Prognostic significance of preoperative aspartate aminotransferase to neutrophil ratio index in patients with hepatocellular carcinoma after hepatic resection. Oncotarget. 2016;7:72276-72289. [RCA] [PubMed] [DOI] [Full Text] [Full Text (PDF)] [Cited by in Crossref: 19] [Cited by in RCA: 30] [Article Influence: 3.8] [Reference Citation Analysis (0)] |
| 34. | Fu SJ, Shen SL, Li SQ, Hua YP, Hu WJ, Liang LJ, Peng BG. Prognostic value of preoperative peripheral neutrophil-to-lymphocyte ratio in patients with HBV-associated hepatocellular carcinoma after radical hepatectomy. Med Oncol. 2013;30:721. [RCA] [PubMed] [DOI] [Full Text] [Cited by in Crossref: 32] [Cited by in RCA: 42] [Article Influence: 3.2] [Reference Citation Analysis (0)] |
| 35. | Lancellotti S, Basso M, Veca V, Sacco M, Riccardi L, Pompili M, De Cristofaro R. Presence of portal vein thrombosis in liver cirrhosis is strongly associated with low levels of ADAMTS-13: a pilot study. Intern Emerg Med. 2016;11:959-967. [RCA] [PubMed] [DOI] [Full Text] [Cited by in Crossref: 27] [Cited by in RCA: 32] [Article Influence: 3.2] [Reference Citation Analysis (0)] |
| 36. | Sacco M, Tardugno M, Lancellotti S, Ferretti A, Ponziani FR, Riccardi L, Zocco MA, De Magistris A, Santopaolo F, Pompili M, De Cristofaro R. ADAMTS-13/von Willebrand factor ratio: A prognostic biomarker for portal vein thrombosis in compensated cirrhosis. A prospective observational study. Dig Liver Dis. 2022;54:1672-1680. [RCA] [PubMed] [DOI] [Full Text] [Cited by in Crossref: 16] [Cited by in RCA: 18] [Article Influence: 4.5] [Reference Citation Analysis (0)] |
| 37. | Hasan RA, Koh AY, Zia A. The gut microbiome and thromboembolism. Thromb Res. 2020;189:77-87. [RCA] [PubMed] [DOI] [Full Text] [Cited by in Crossref: 16] [Cited by in RCA: 56] [Article Influence: 9.3] [Reference Citation Analysis (0)] |


