Copyright
©The Author(s) 2025.
World J Gastrointest Oncol. Sep 15, 2025; 17(9): 109127
Published online Sep 15, 2025. doi: 10.4251/wjgo.v17.i9.109127
Published online Sep 15, 2025. doi: 10.4251/wjgo.v17.i9.109127
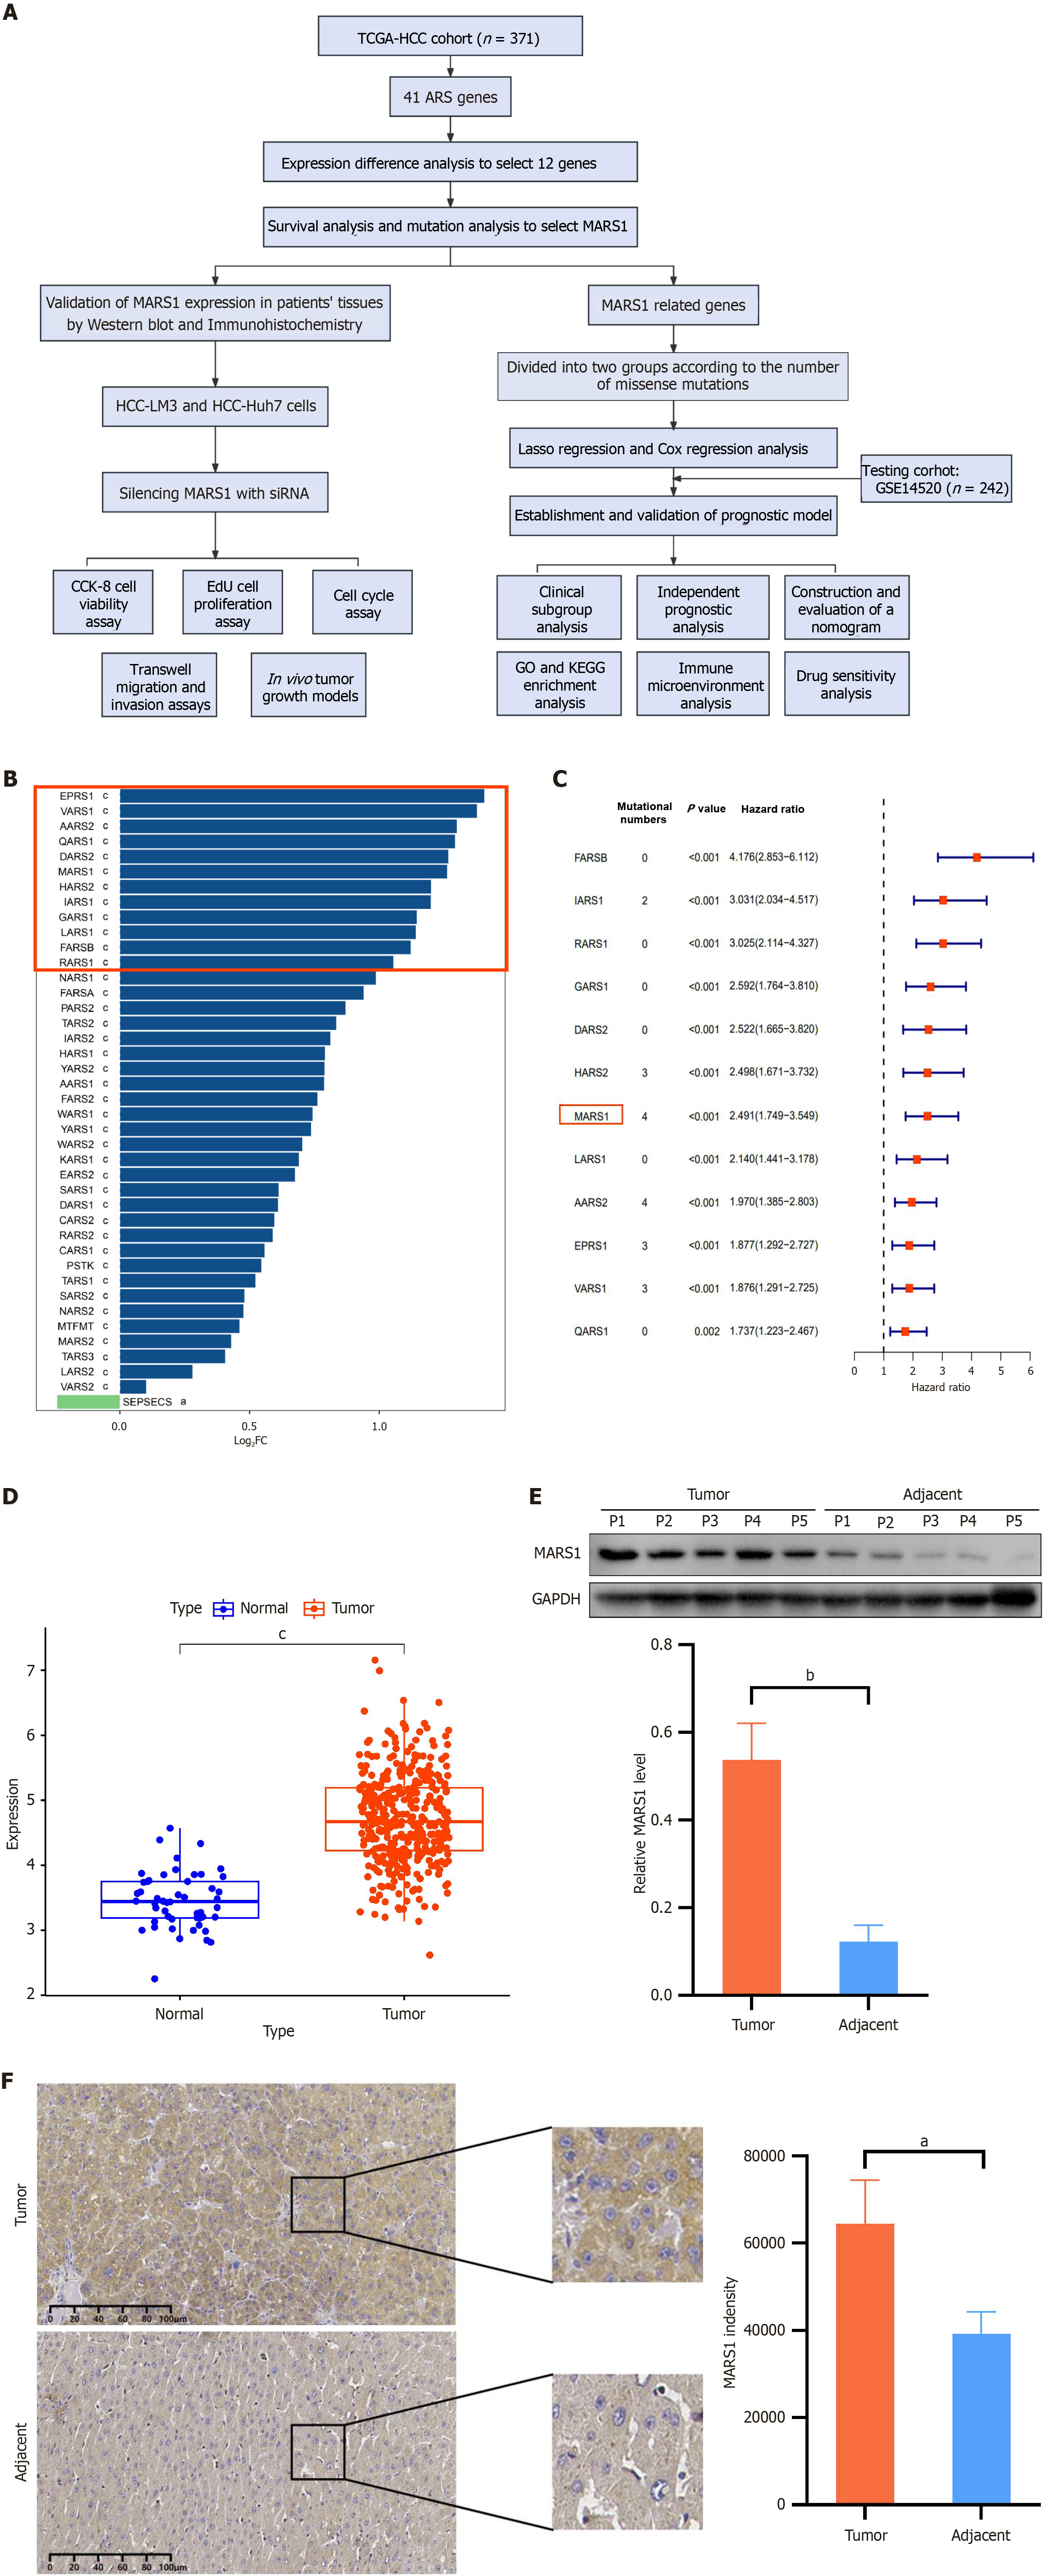
Figure 1 MARS1 is a key gene associated with hepatocellular carcinoma.
A: Flow chart illustrating the study design and workflow; B: Visualization of differentially expressed genes (DEGs) in hepatocellular carcinoma (HCC) compared to adjacent normal tissue; C: Mutation analysis and Kaplan-Meier survival curves based on DEGs identified in panel (B); D: Differential expression of MARS1 in HCC and normal tissue; E and F: Western blot (E) and Immunohistochemistry (F) showing MARS1 expression in HCC and normal liver tissues. Student’s t-test was used to compare differences between two groups. aP < 0.05; bP < 0.01; cP < 0.001. TCGA: The Cancer Genome Atlas; HCC: Hepatocellular carcinoma; GO: Gene Ontology; KEGG: Kyoto Encyclopedia of Genes and Genomes.
Figure 2 MARS1 promotes the proliferation, migration, invasion, and tumor formation of hepatocellular carcinoma cells.
A: Protein expression levels of MARS1 in LM3 and Huh7 cells transiently transfected with siRNA-NC and siRNA-MARS1; B: Cell viability of LM3 and Huh7 cells measured by CCK-8 assay; C: Cell proliferation of LM3 and Huh7 cells examined by EdU assay; D: Cell cycle distribution of LM3 and Huh7 cells examined by cell cycle assays; E and F: Cell migration and invasion of LM3 and Huh7 cells assessed by Transwell migration and Matrigel invasion assays; G: Impact of MARS1 suppression in LM3 and Huh7 cells on subcutaneous tumor growth. The weight of tumors was measured following euthanasia of the mice (n = 5); H: Tumor volumes were recorded every 3 days (n = 5). Student’s t-test was used to compare differences between two groups, while one-way analysis of variance was applied for comparisons among more than two groups. aP < 0.05; bP < 0.01; and cP < 0.001.
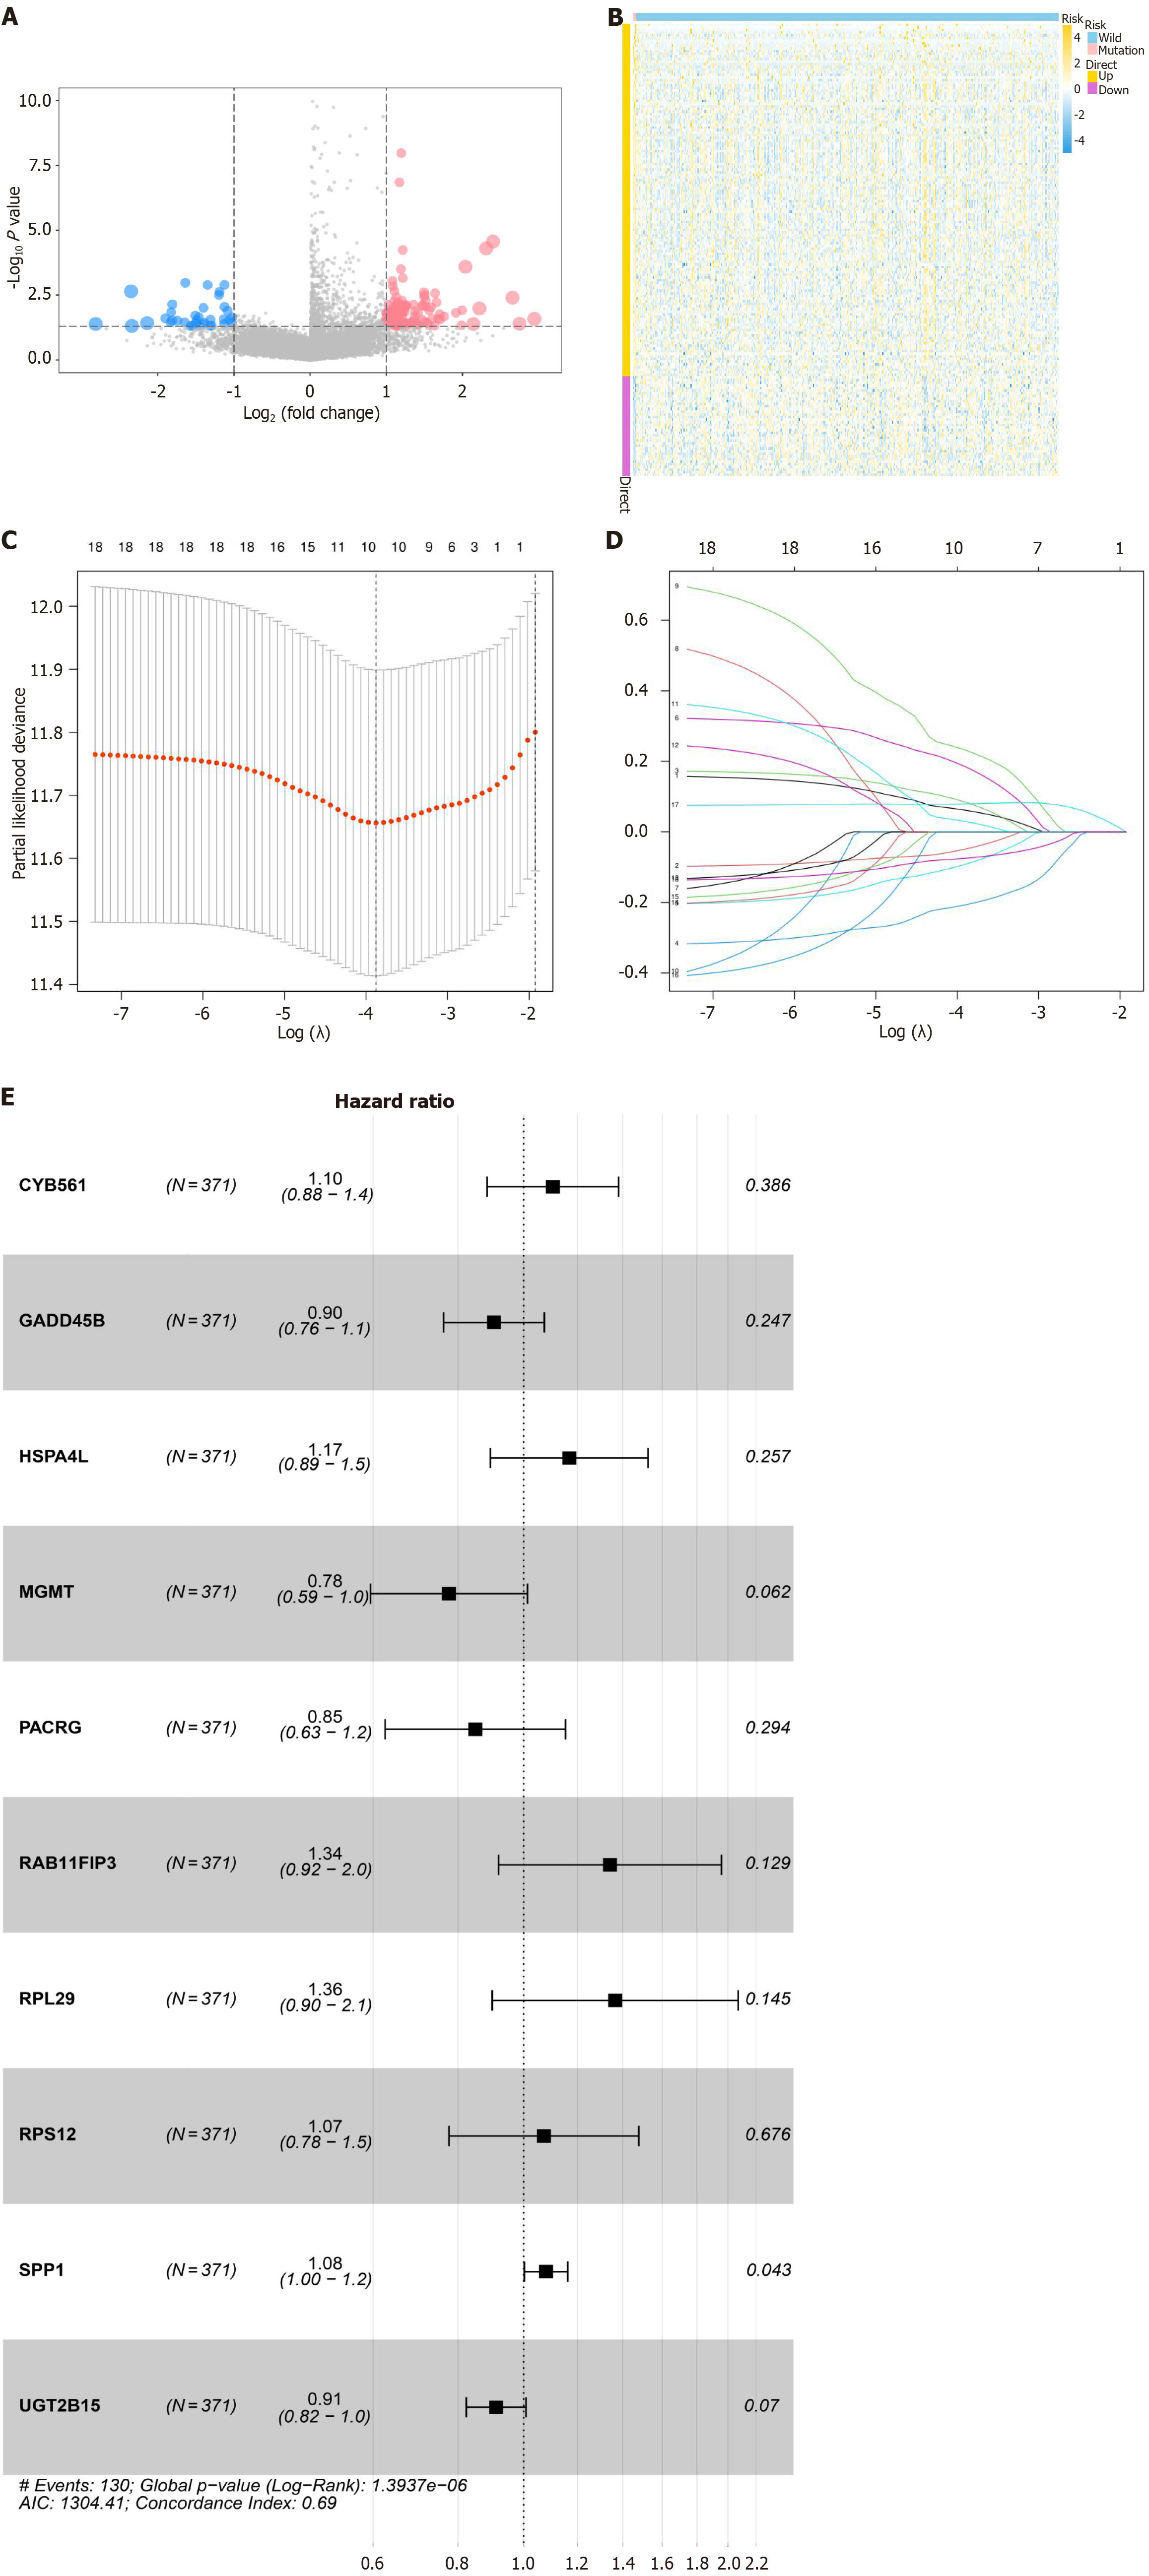
Figure 3 Visualization of differential MARS1-related genes.
A: Volcano plot showing differential expression of MARS1-related genes between MARS1-mutated and wild-type patients with hepatocarcinoma. Genes with significant differential expression are represented by dots; B: Heatmap illustrating the expression patterns of differential MARS1-related genes; C and D: LASSO regression analysis identifies the optimal lambda value associated with the 10 prognostic genes significantly linked to overall survival; E: Forest plot of multivariate Cox regression analysis for 10 genes, depicting hazard ratios and their 95% confidence intervals.
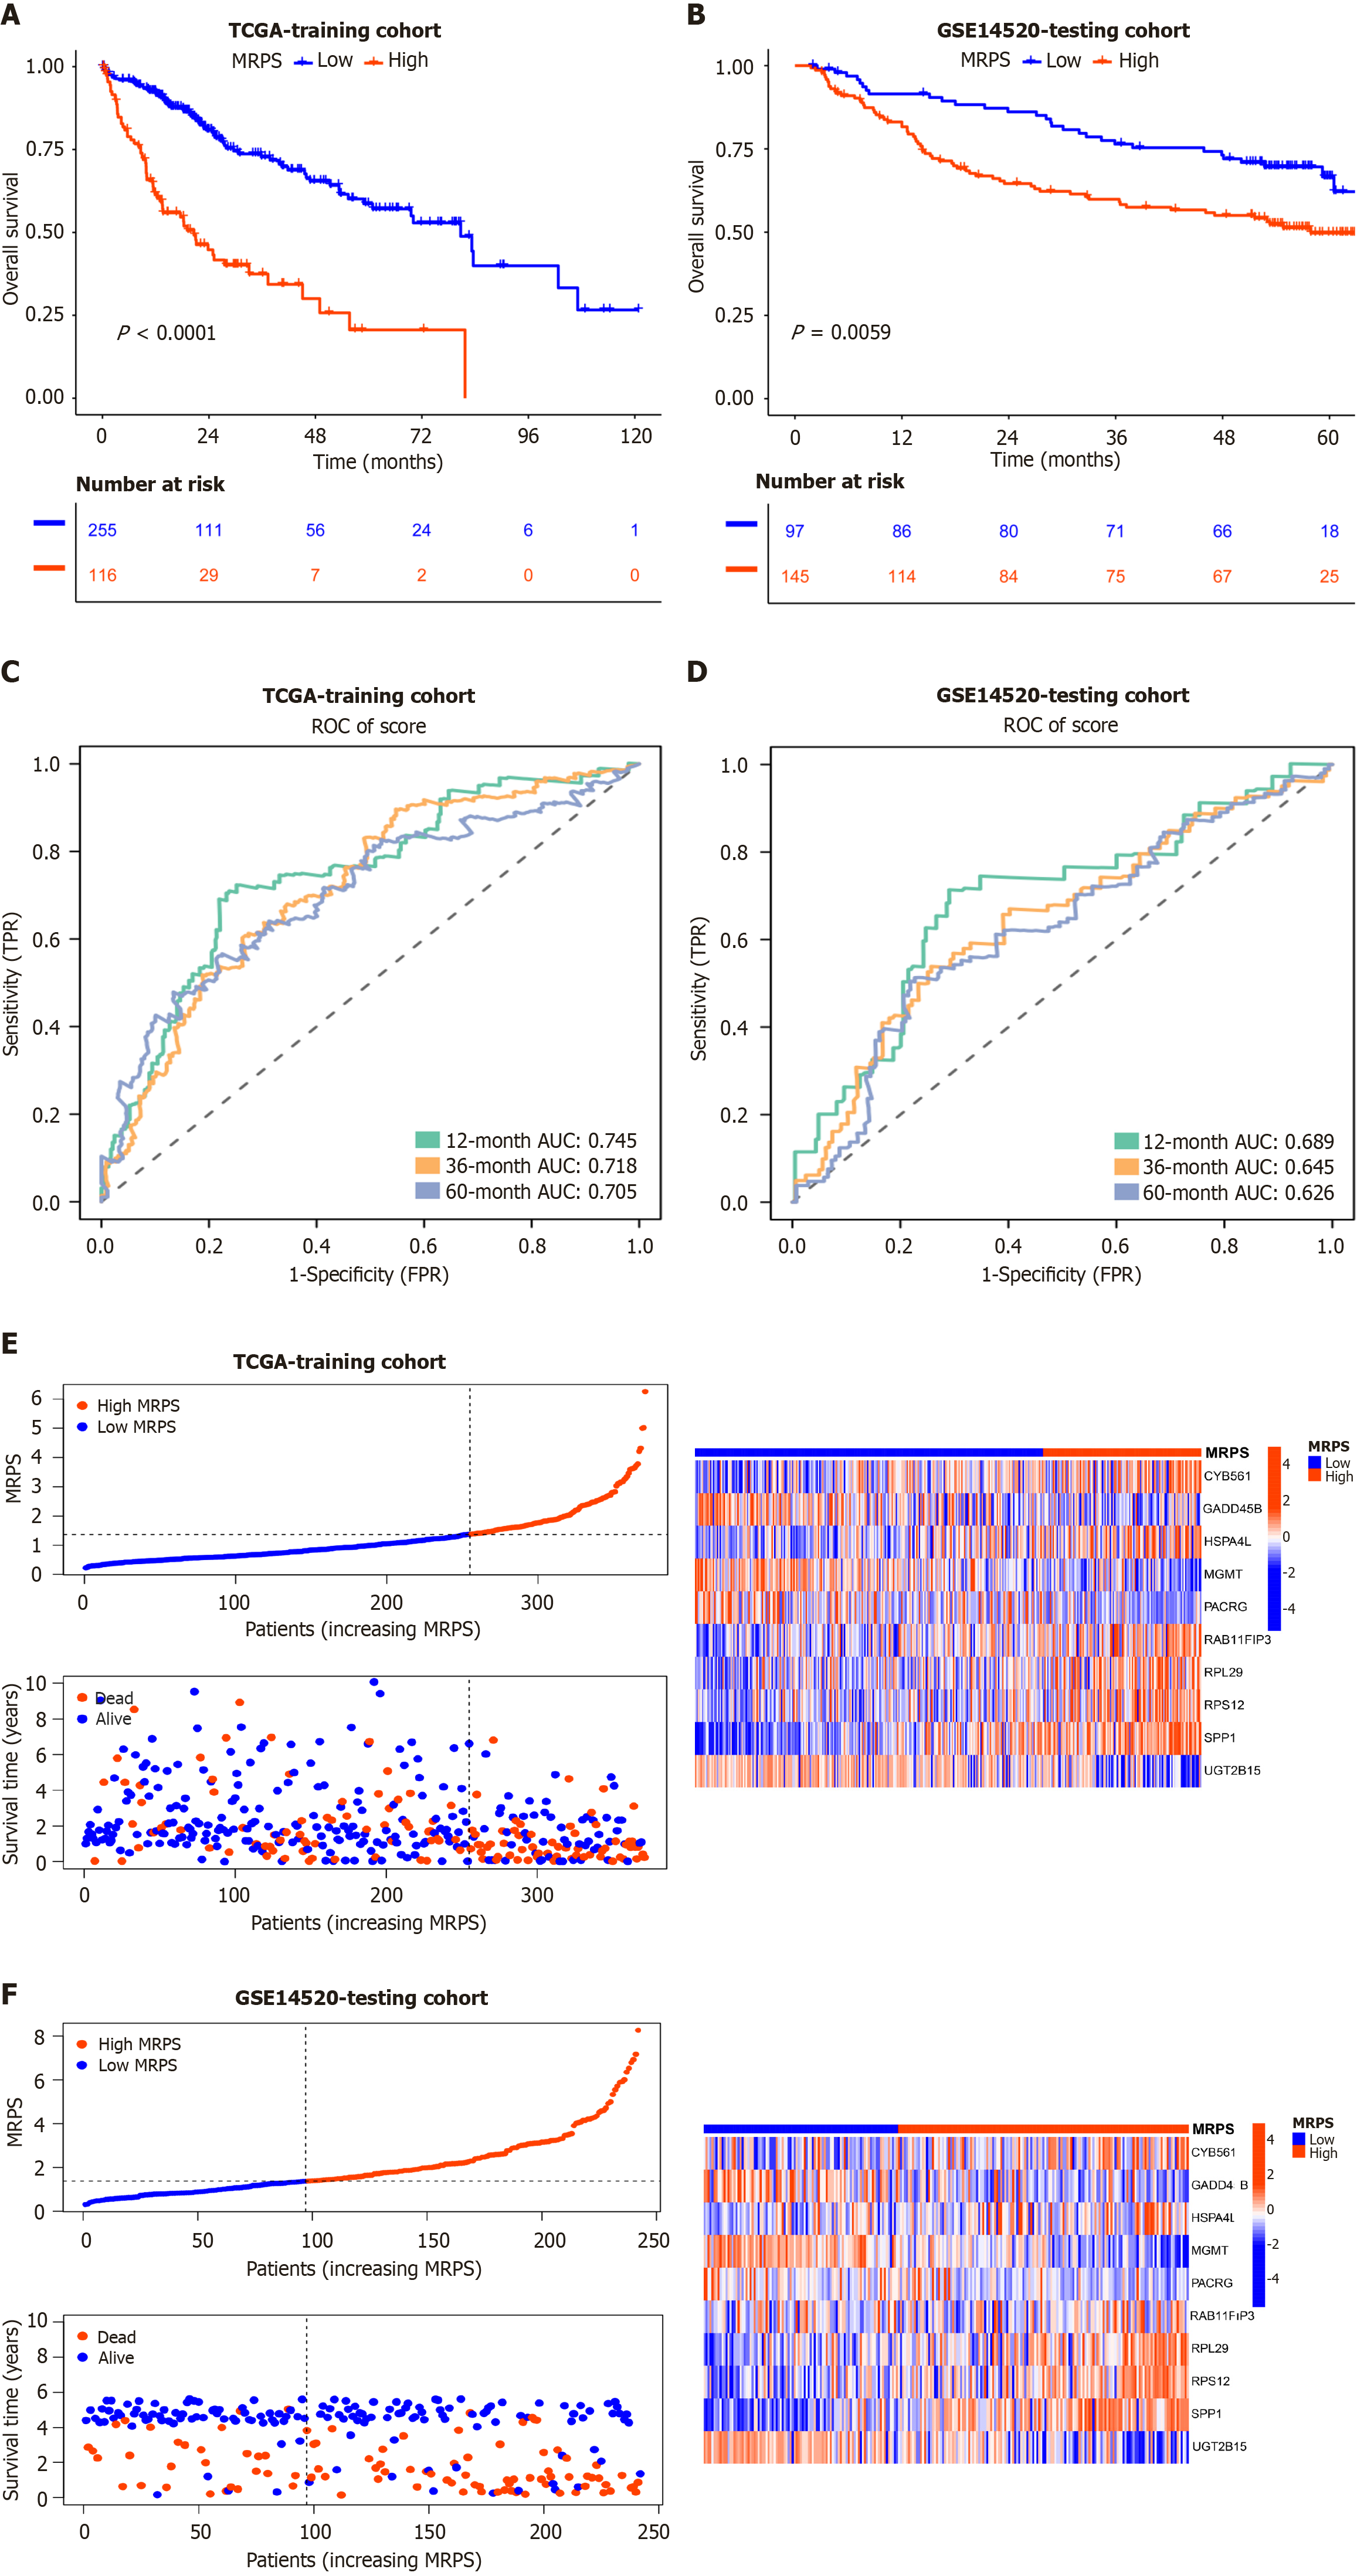
Figure 4 Evaluation and verification of MRPS in The Cancer Genome Atlas and GSE14520.
A and B: Kaplan–Meier curves illustrating the overall survival (OS) of patients classified into high and low MRPS groups in The Cancer Genome Atlas (TCGA)-hepatocellular carcinoma (HCC) (A) and GSE14520 (B); C and D: Receiver operating characteristic (ROC) curves showing the predictive performance of MRPS for 1-, 3-, and 5-year OS in the TCGA-HCC (C) and GSE14520 (D); E and F: Scatter plot of the risk score, OS, and corresponding heatmap based on MRPS in the TCGA (E) and GSE14520 (F). TCGA: The Cancer Genome Atlas; ROC: Receiver operating characteristic.
Figure 5
Kaplan-Meier curves illustrating overall survival differences between high-MRPS and low-MRPS groups across various clinical subgroups.
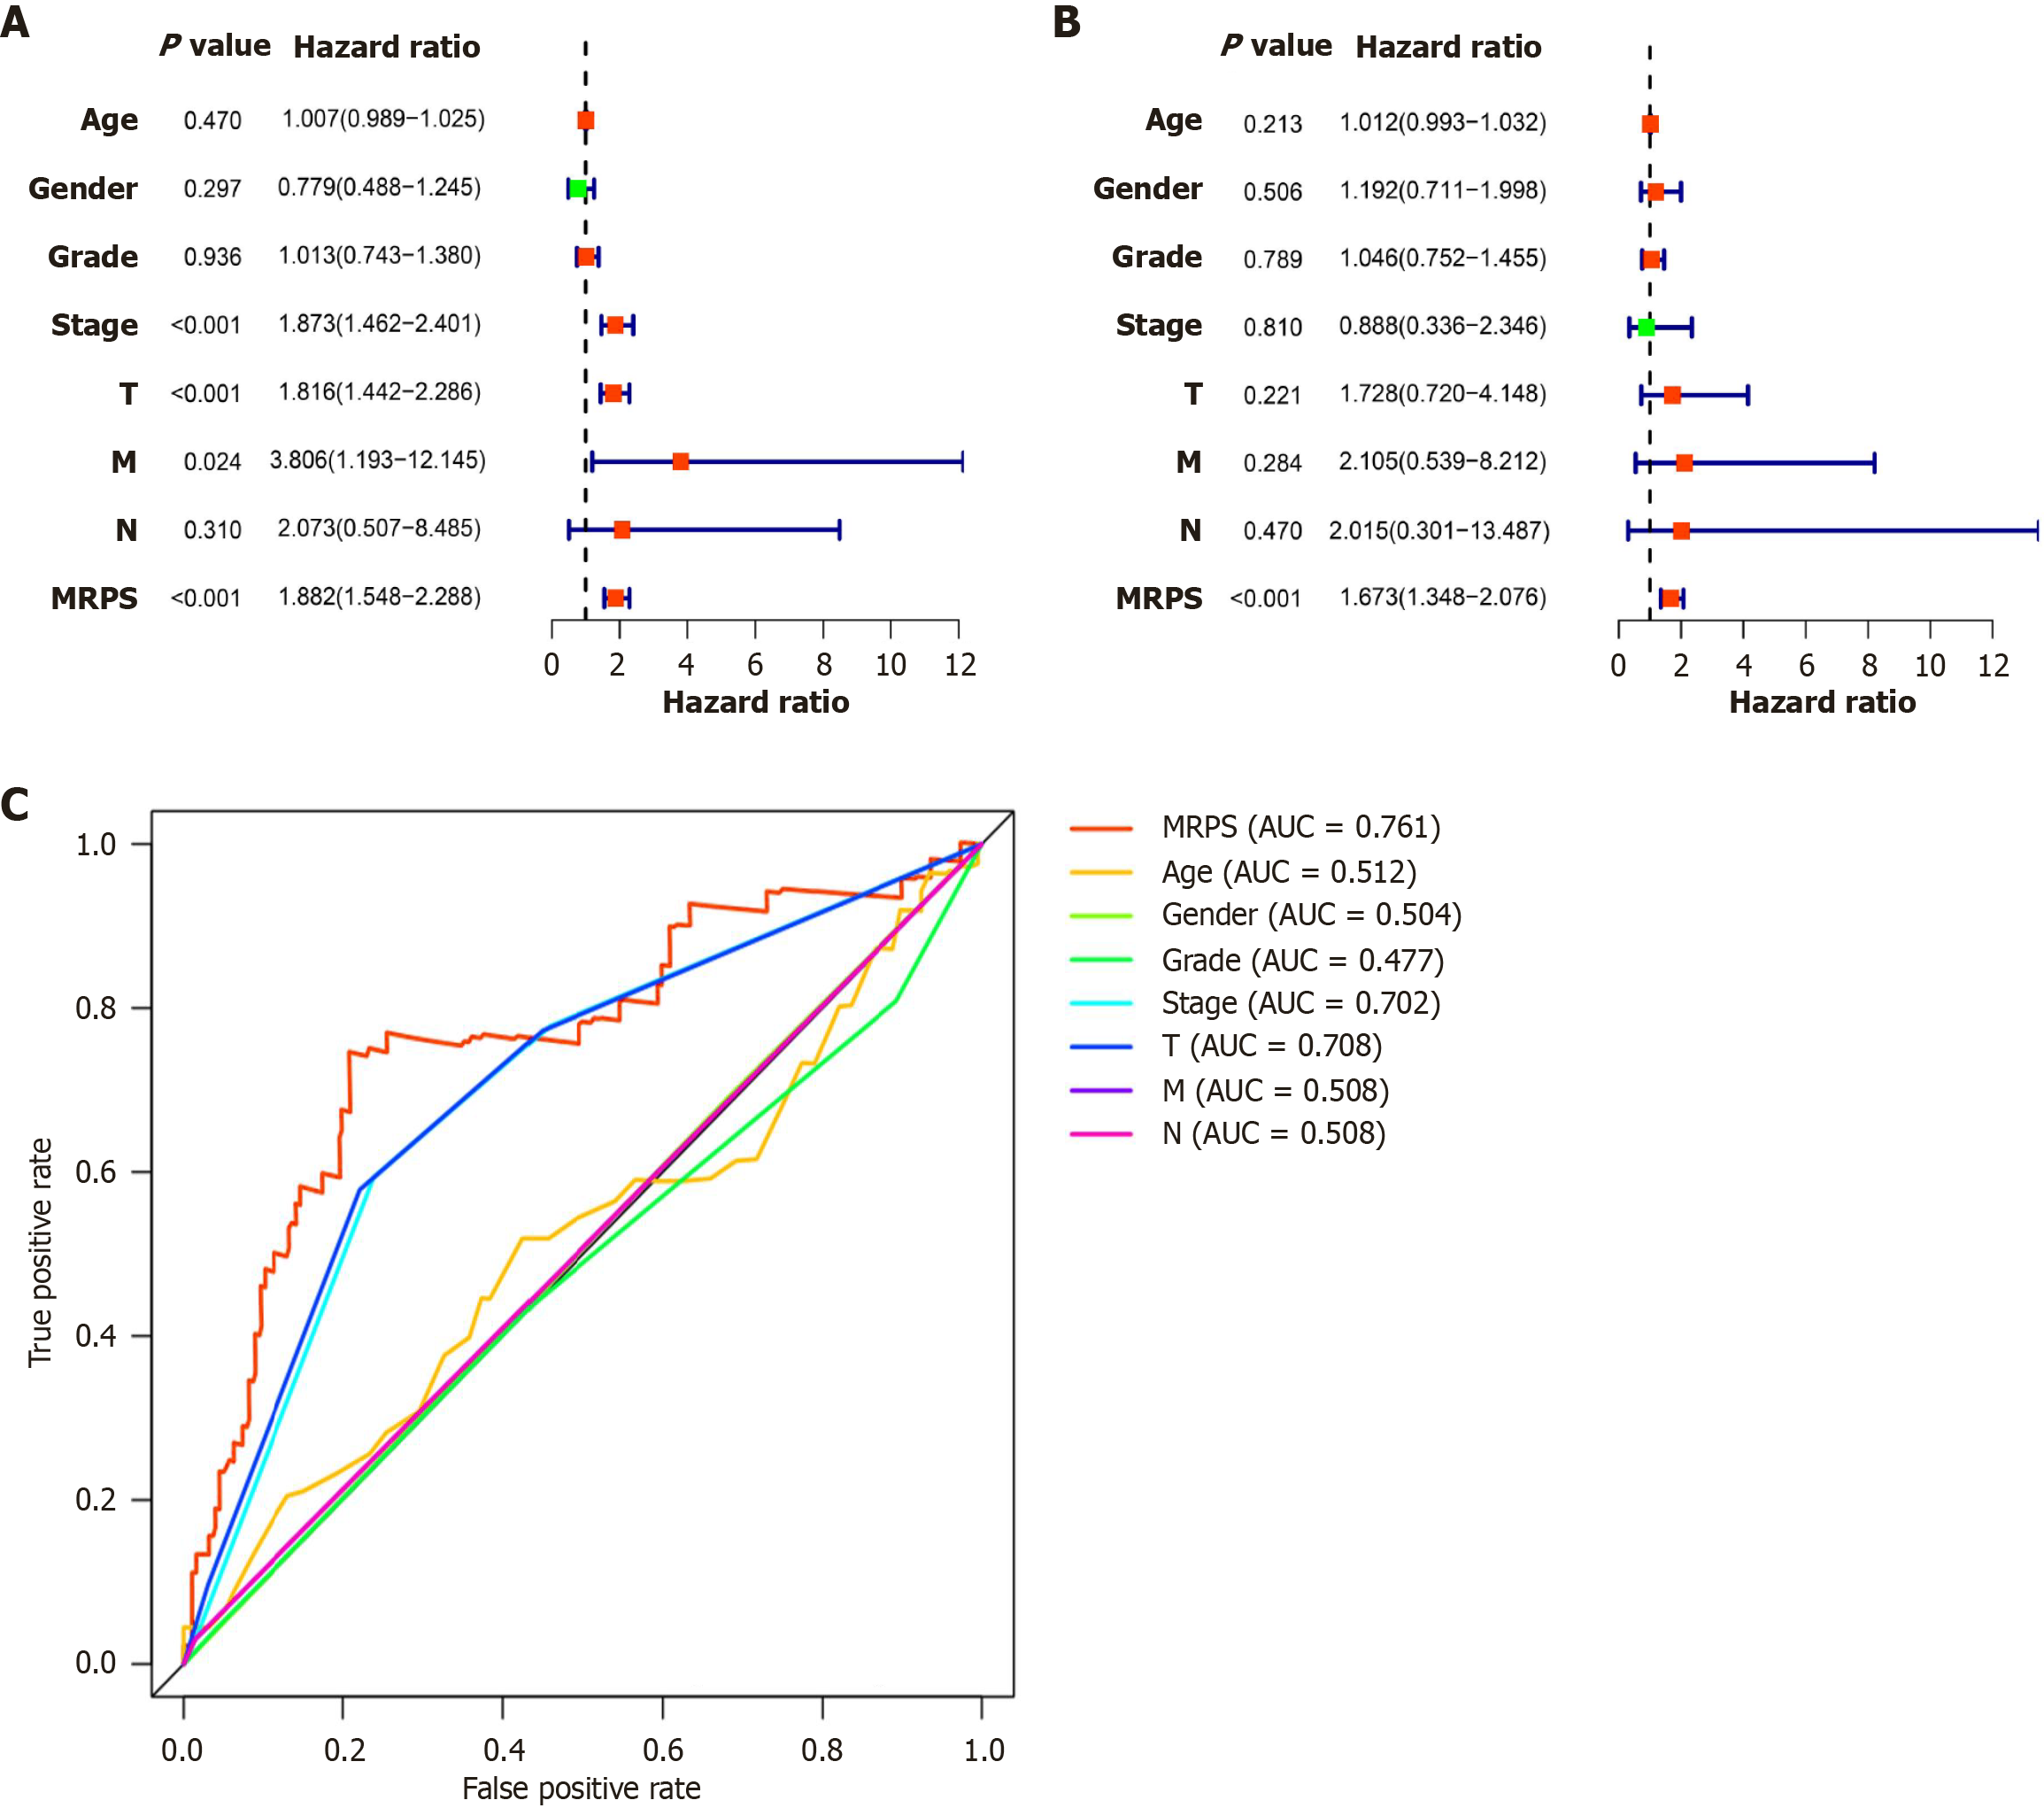
Figure 6 MRPS is an independent prognostic factor of hepatocellular carcinoma.
A: Univariate Cox analysis revealed associations between clinical factors and risk scores. Significant associations were observed for the pathological stage, T stage, and MRPS; B: Multivariate Cox analysis confirmed MRPS as an independent prognostic factor, indicating its importance in predicting hepatocellular carcinoma prognosis; C: Receiver operating characteristic curves were utilized to assess the predictive accuracy of MRPS, compared to age, sex, grade, stage, T, N, M. AUC: Area under the curve.
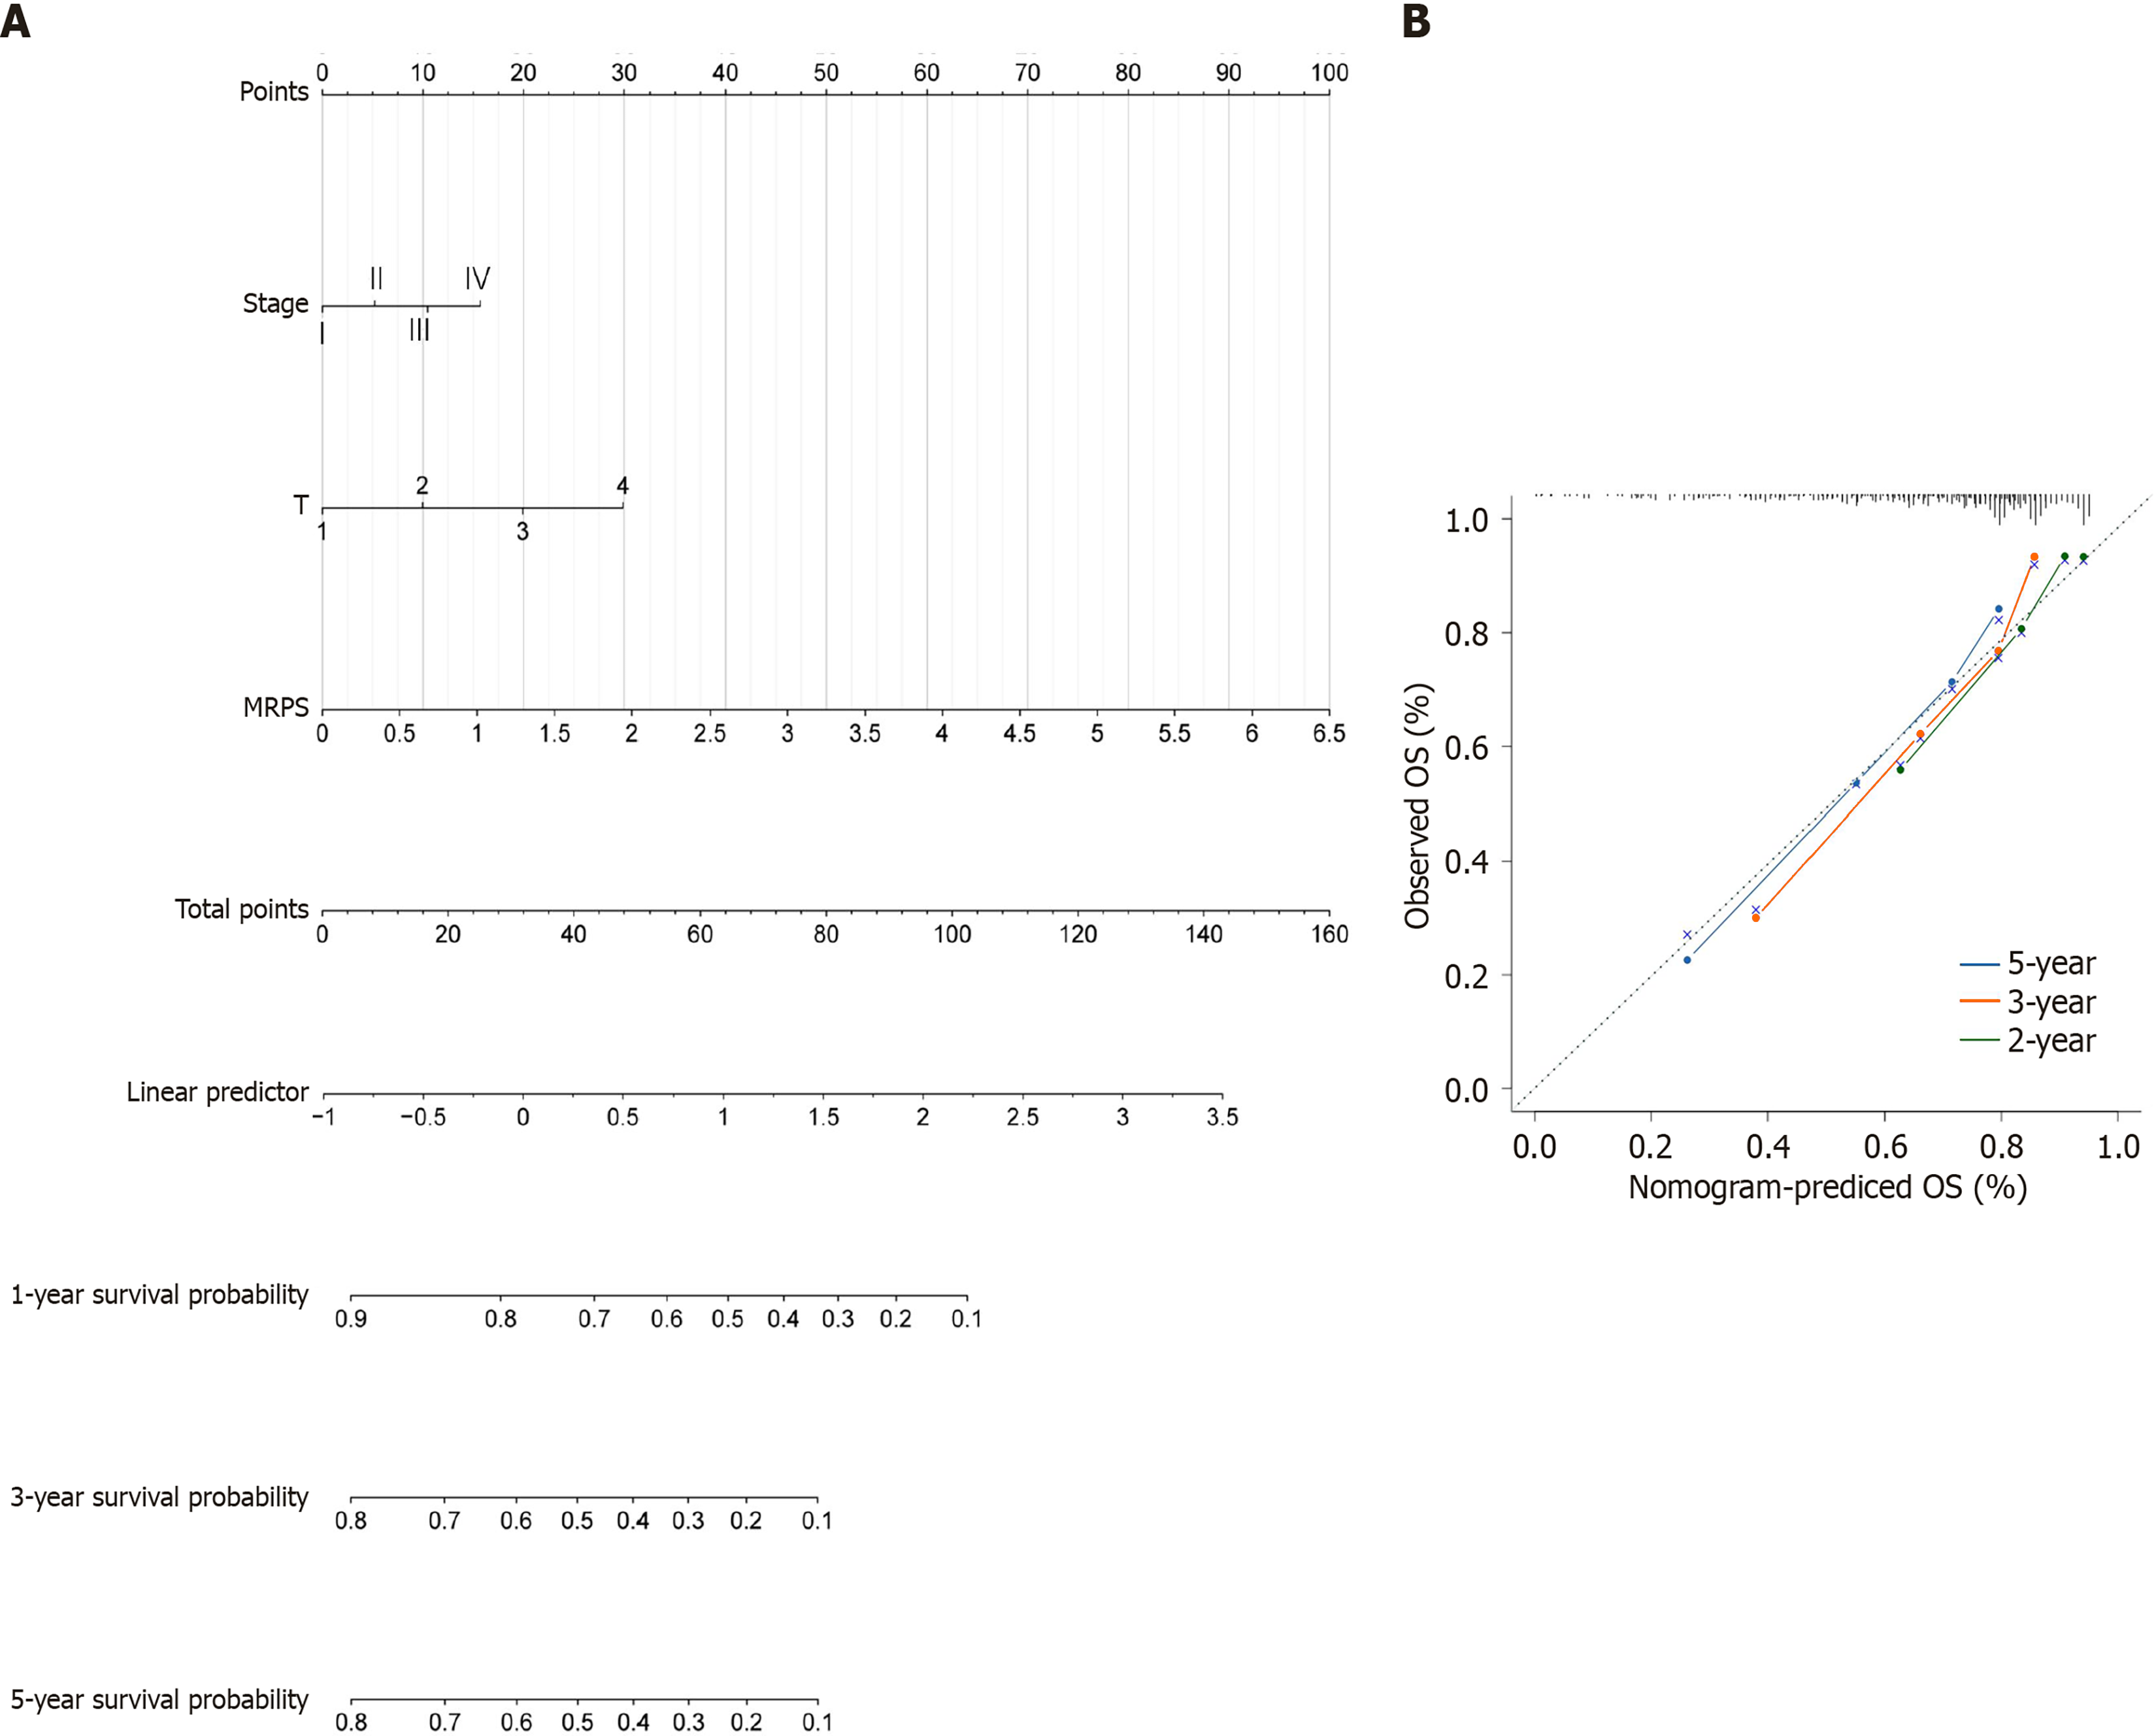
Figure 7 Construction and evaluation of a prognostic nomogram.
A: Prognostic nomogram integrating clinical factors and MRPS values for individualized prognostic assessment; B: Calibration plots predicting recurrence at 1, 3, and 5 years. Gray dashed lines represent the ideal predictions. OS: Overall survival.
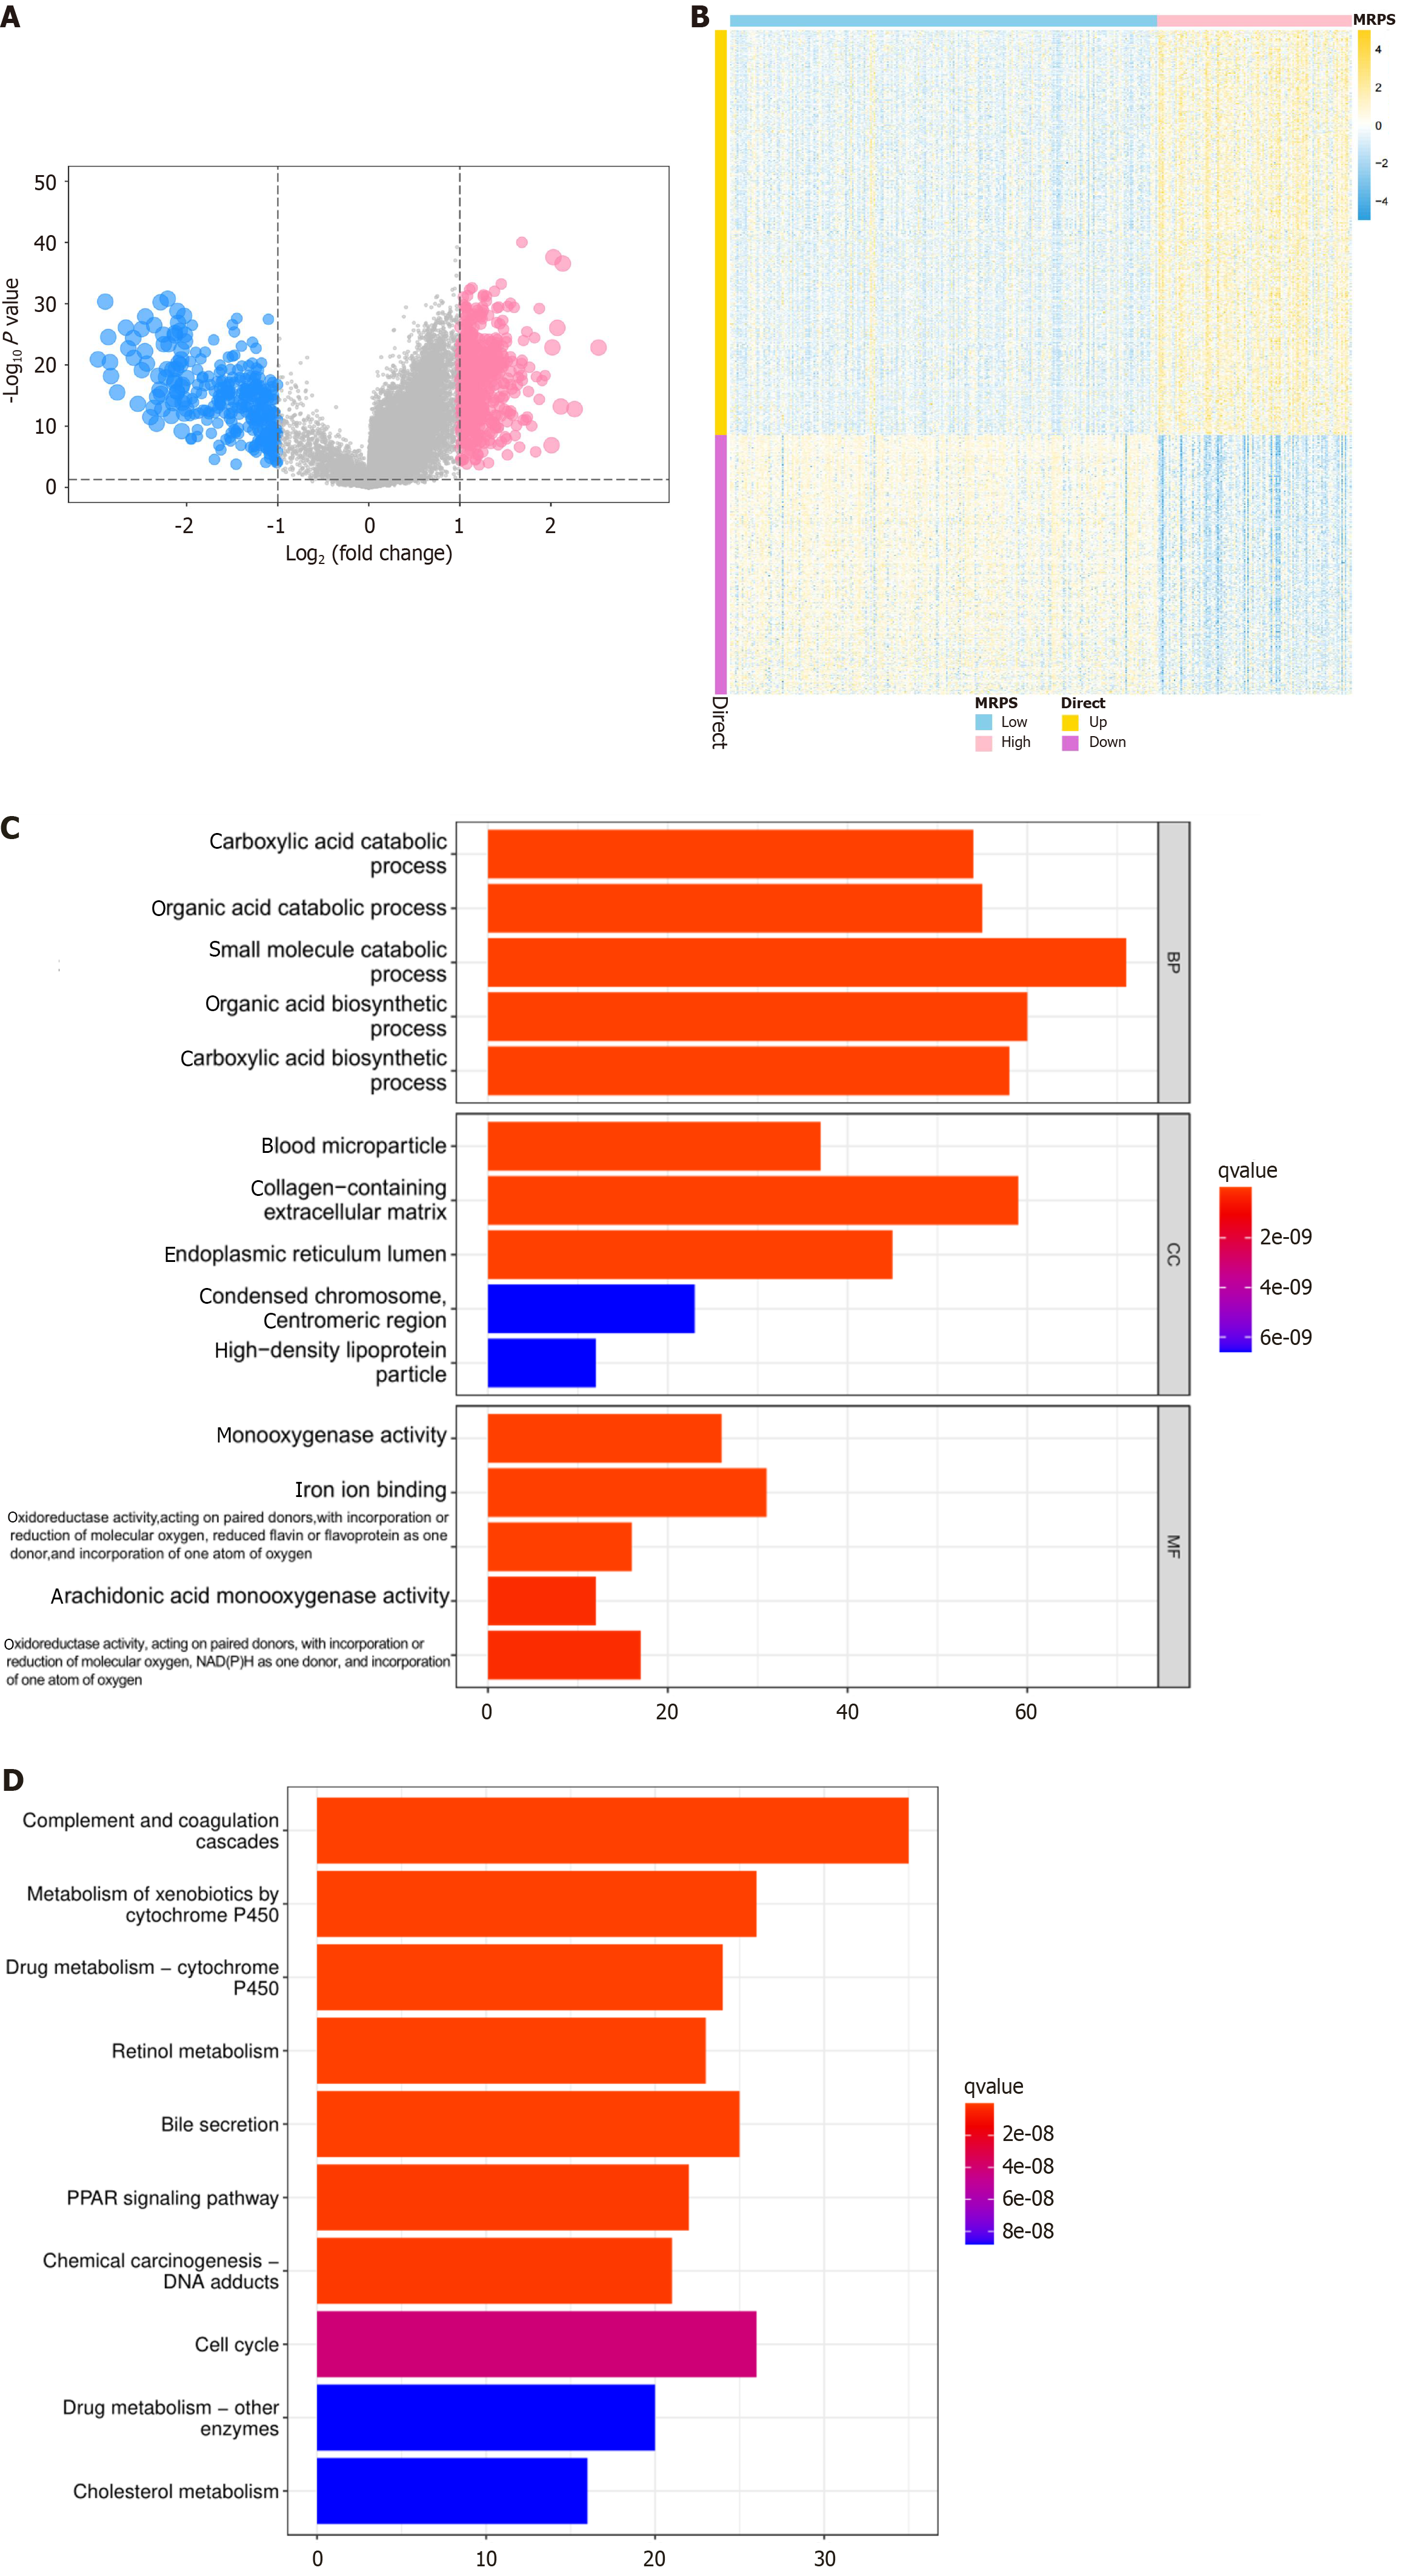
Figure 8 Identification of different MRPS groups differentially expressed genes and functional enrichment analysis.
A: Volcano plots showing 808 differentially expressed genes (DEGs) between different MRPS groups; B: Heatmap illustrating the expression patterns of the 808 DEGs between high and low MRPS patients; C: Gene Ontology enrichment analysis displaying the biological processes, cell components, and molecular functions associated with MARS1-related genes; D: Kyoto Encyclopedia of Genes and Genomes pathways analysis highlighting the pathways enriched in MARS1-related genes, including complement and coagulation cascades, cell cycle, xenobiotic metabolism by cytochrome P450, and bile secretion.
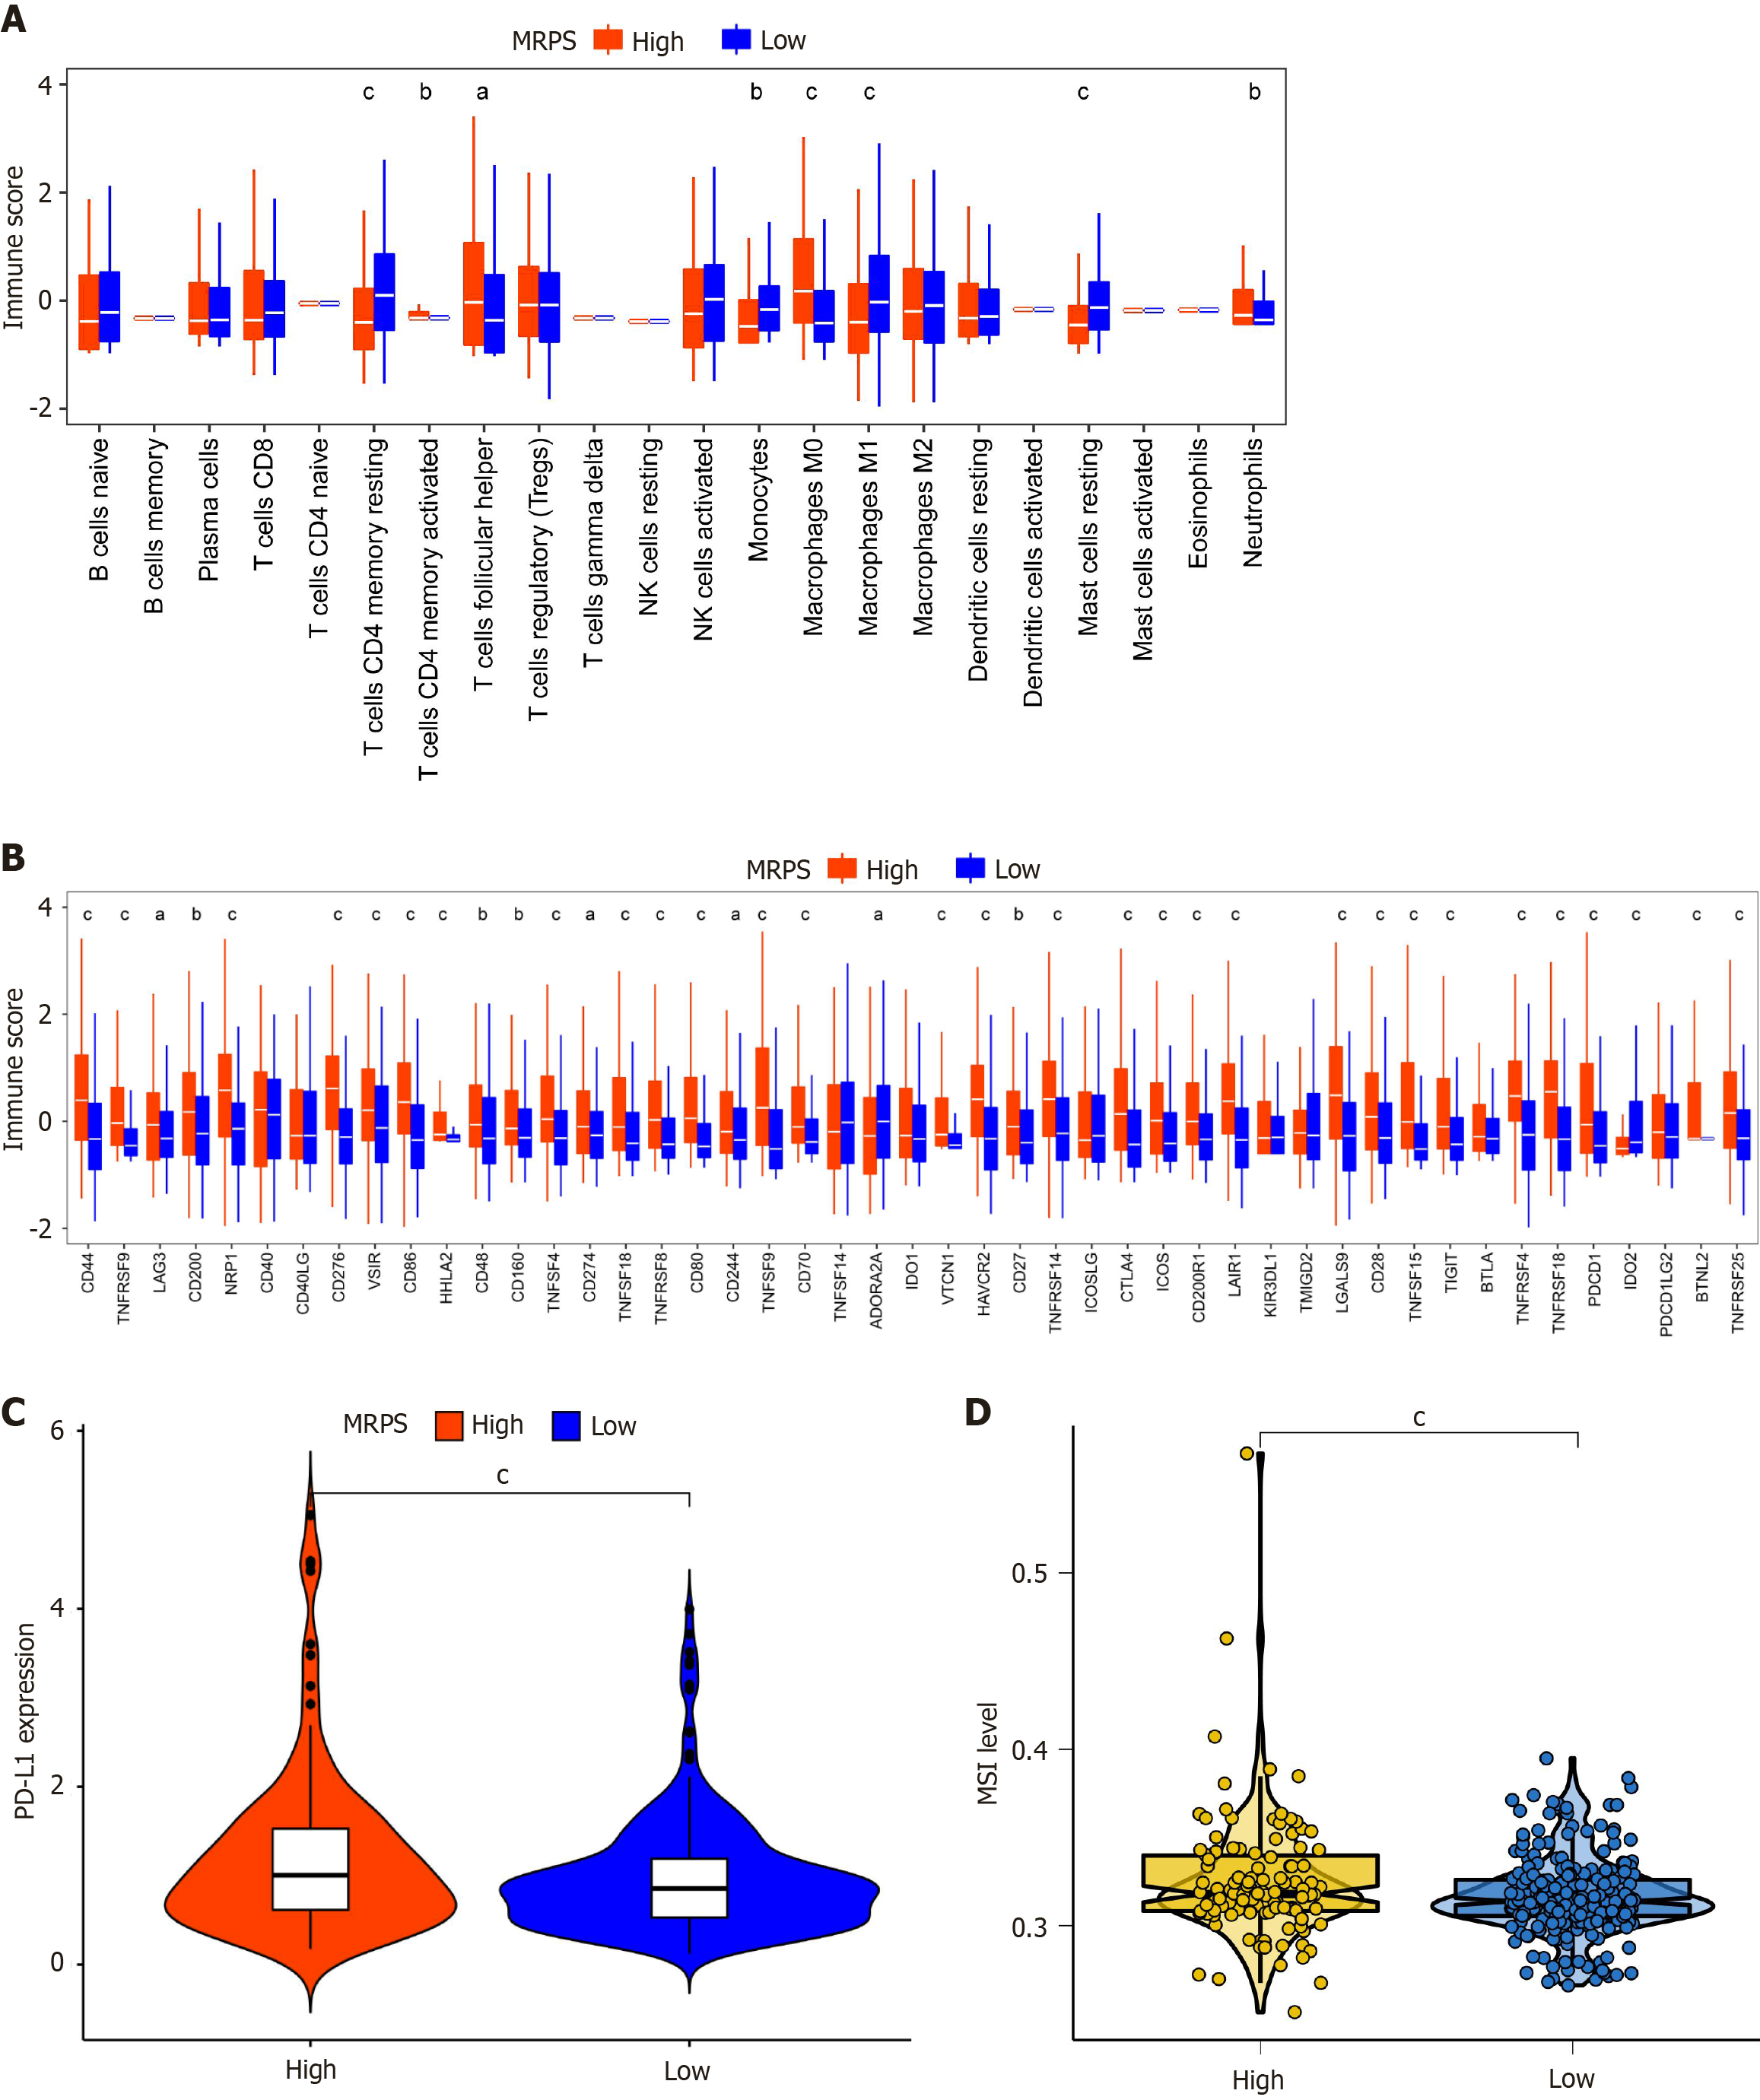
Figure 9 Comparison of immune microenvironment between different MRPS subgroups.
A: Panel illustrates the comparison of immune cell infiltration between different MRPS groups, showing differential levels of various immune cell types; B: Panel depicts the immune checkpoint analysis in high and low MRPS groups; C: Panel displays the differential expression of PD-L1 in high and low MRPS groups; D: Panel illustrates the differential microsatellite instability levels in high and low MRPS groups. aP < 0.05, bP < 0.01, and cP < 0.001.
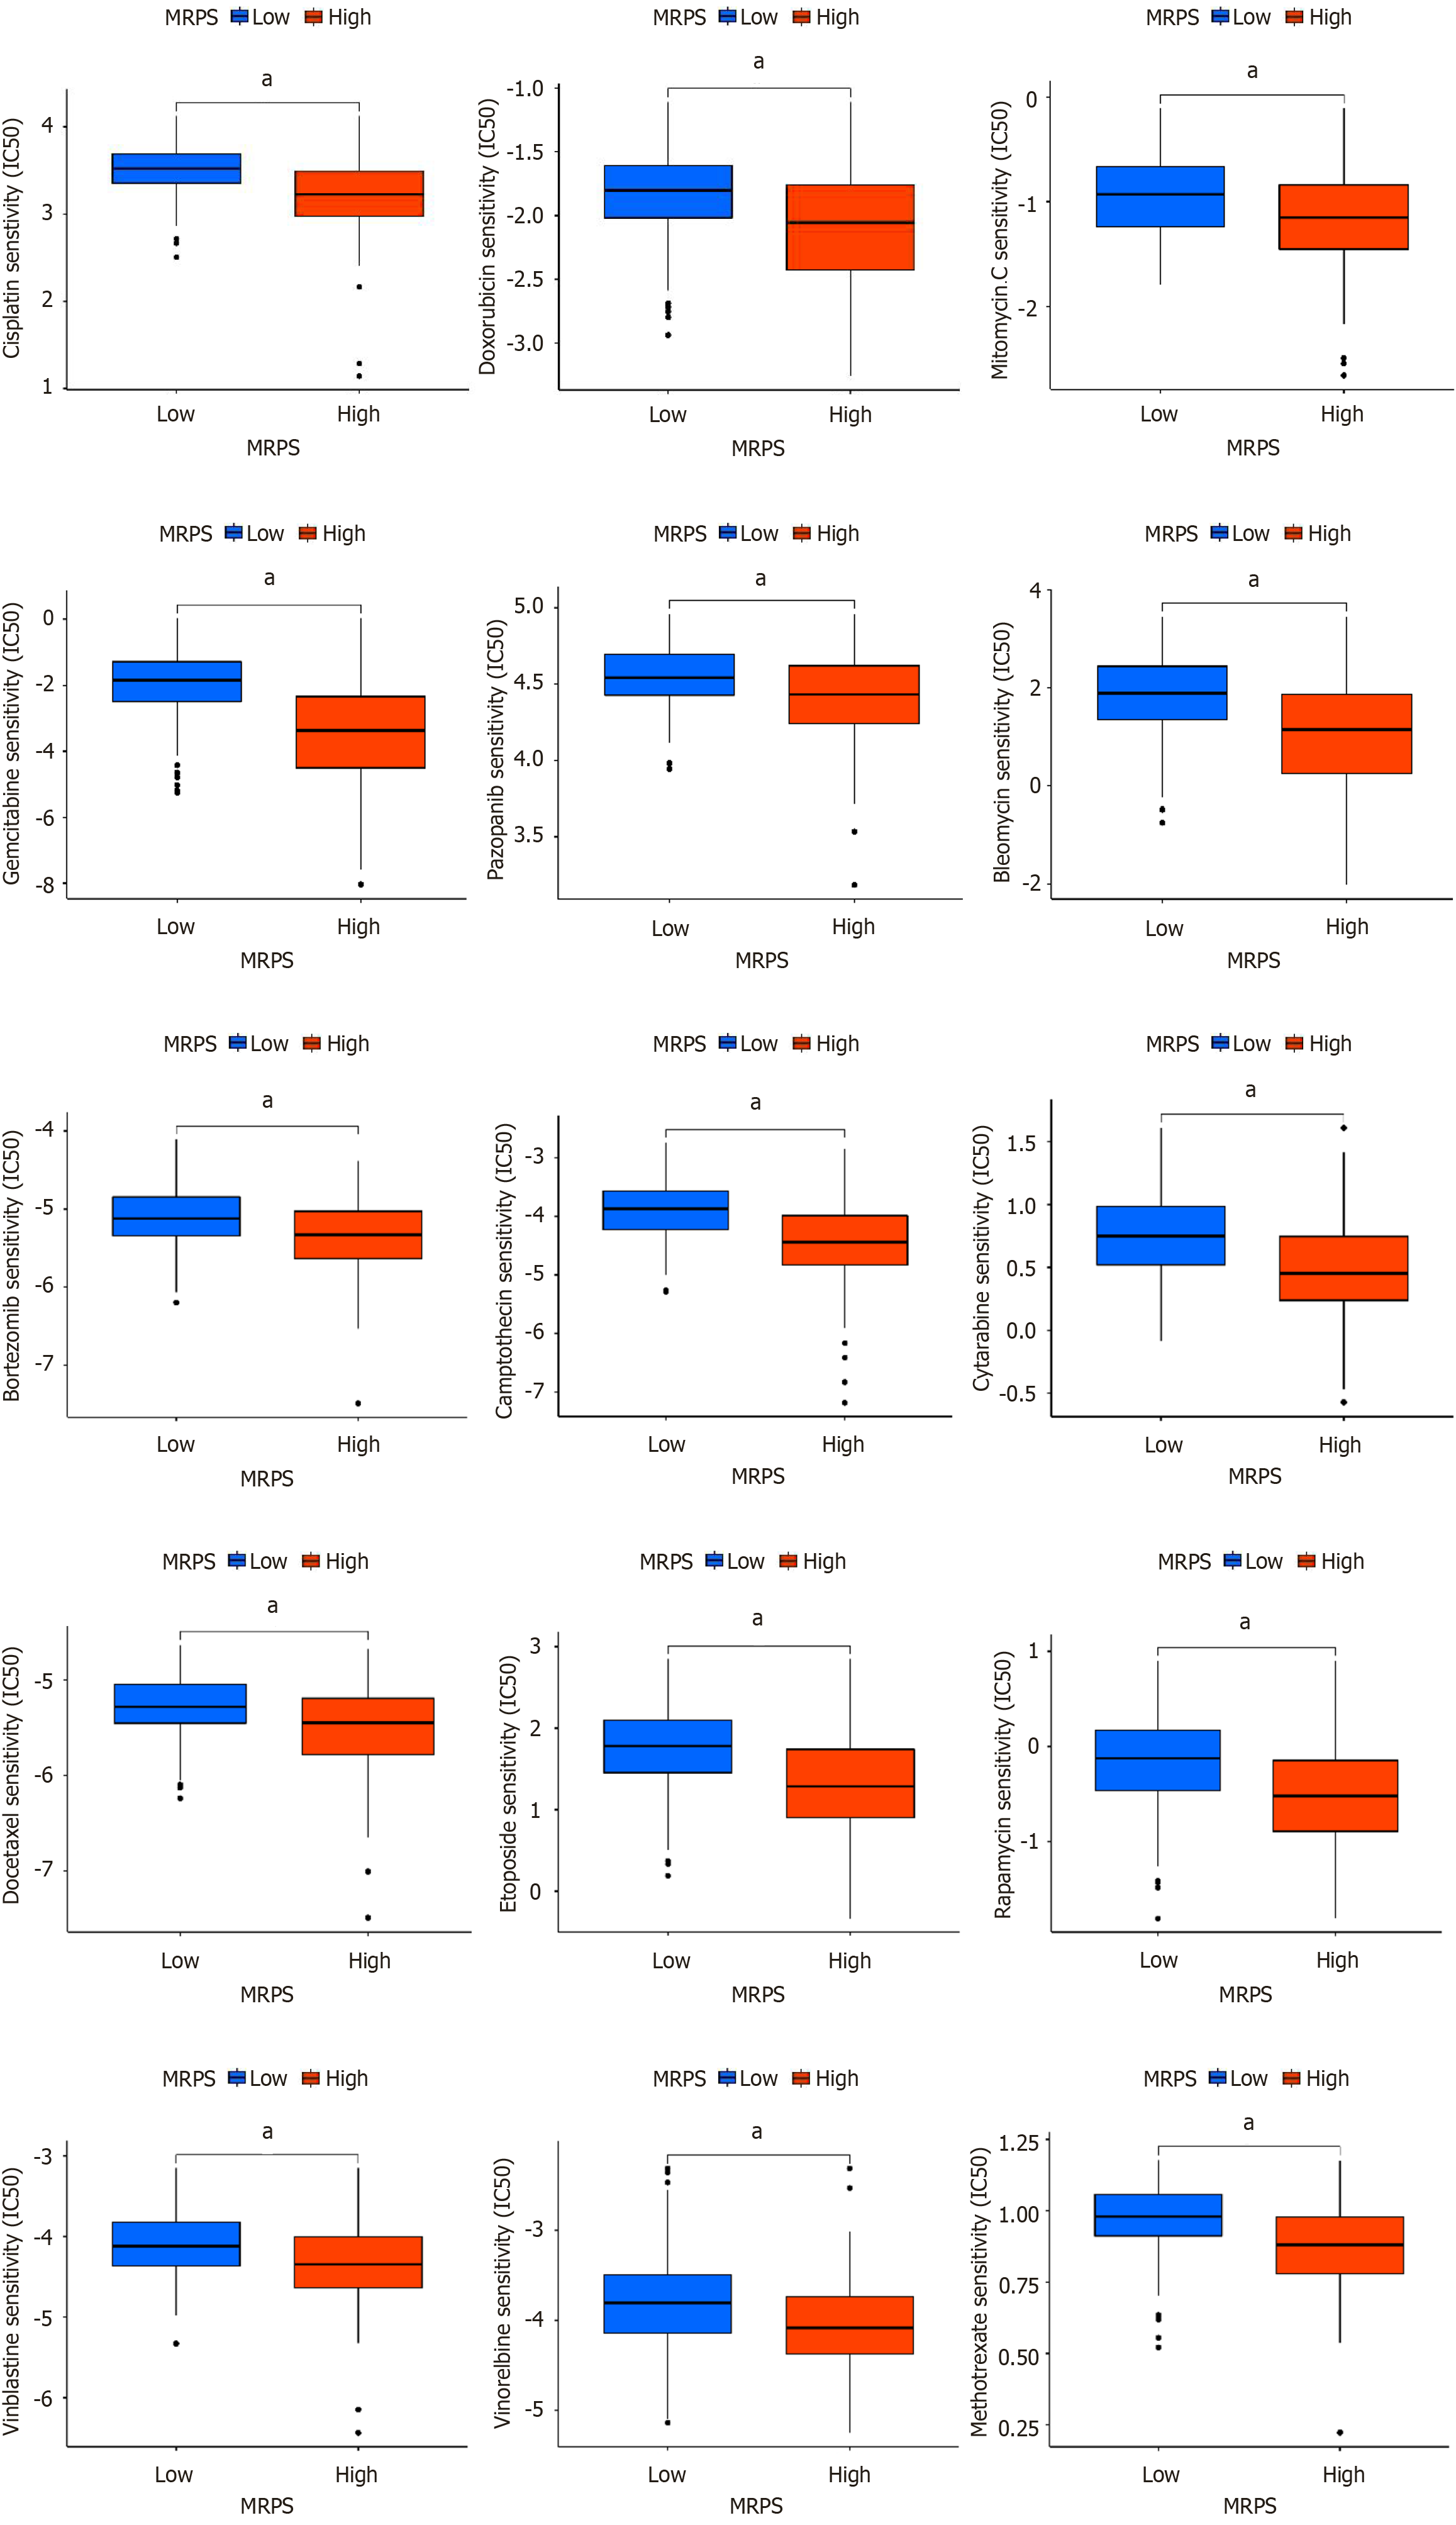
Figure 10 Association of MRPS groups with multiple chemotherapy drug sensitivities.
aP < 0.001.
- Citation: Bu HY, Huang H, Li J, Huang ZB, Huang Y, Huang YK, Wang AM, Wu L, Yuan J, Wang RJ, Lu M, Yu SM, Yi PP, Chen YY, Jiang YP, Hu XW. Methionyl-tRNA synthetase 1 participates in hepatocellular carcinoma and its regulated gene profile possesses potent prognostic ability. World J Gastrointest Oncol 2025; 17(9): 109127
- URL: https://www.wjgnet.com/1948-5204/full/v17/i9/109127.htm
- DOI: https://dx.doi.org/10.4251/wjgo.v17.i9.109127


