Copyright
©The Author(s) 2025.
World J Gastrointest Oncol. Sep 15, 2025; 17(9): 108892
Published online Sep 15, 2025. doi: 10.4251/wjgo.v17.i9.108892
Published online Sep 15, 2025. doi: 10.4251/wjgo.v17.i9.108892
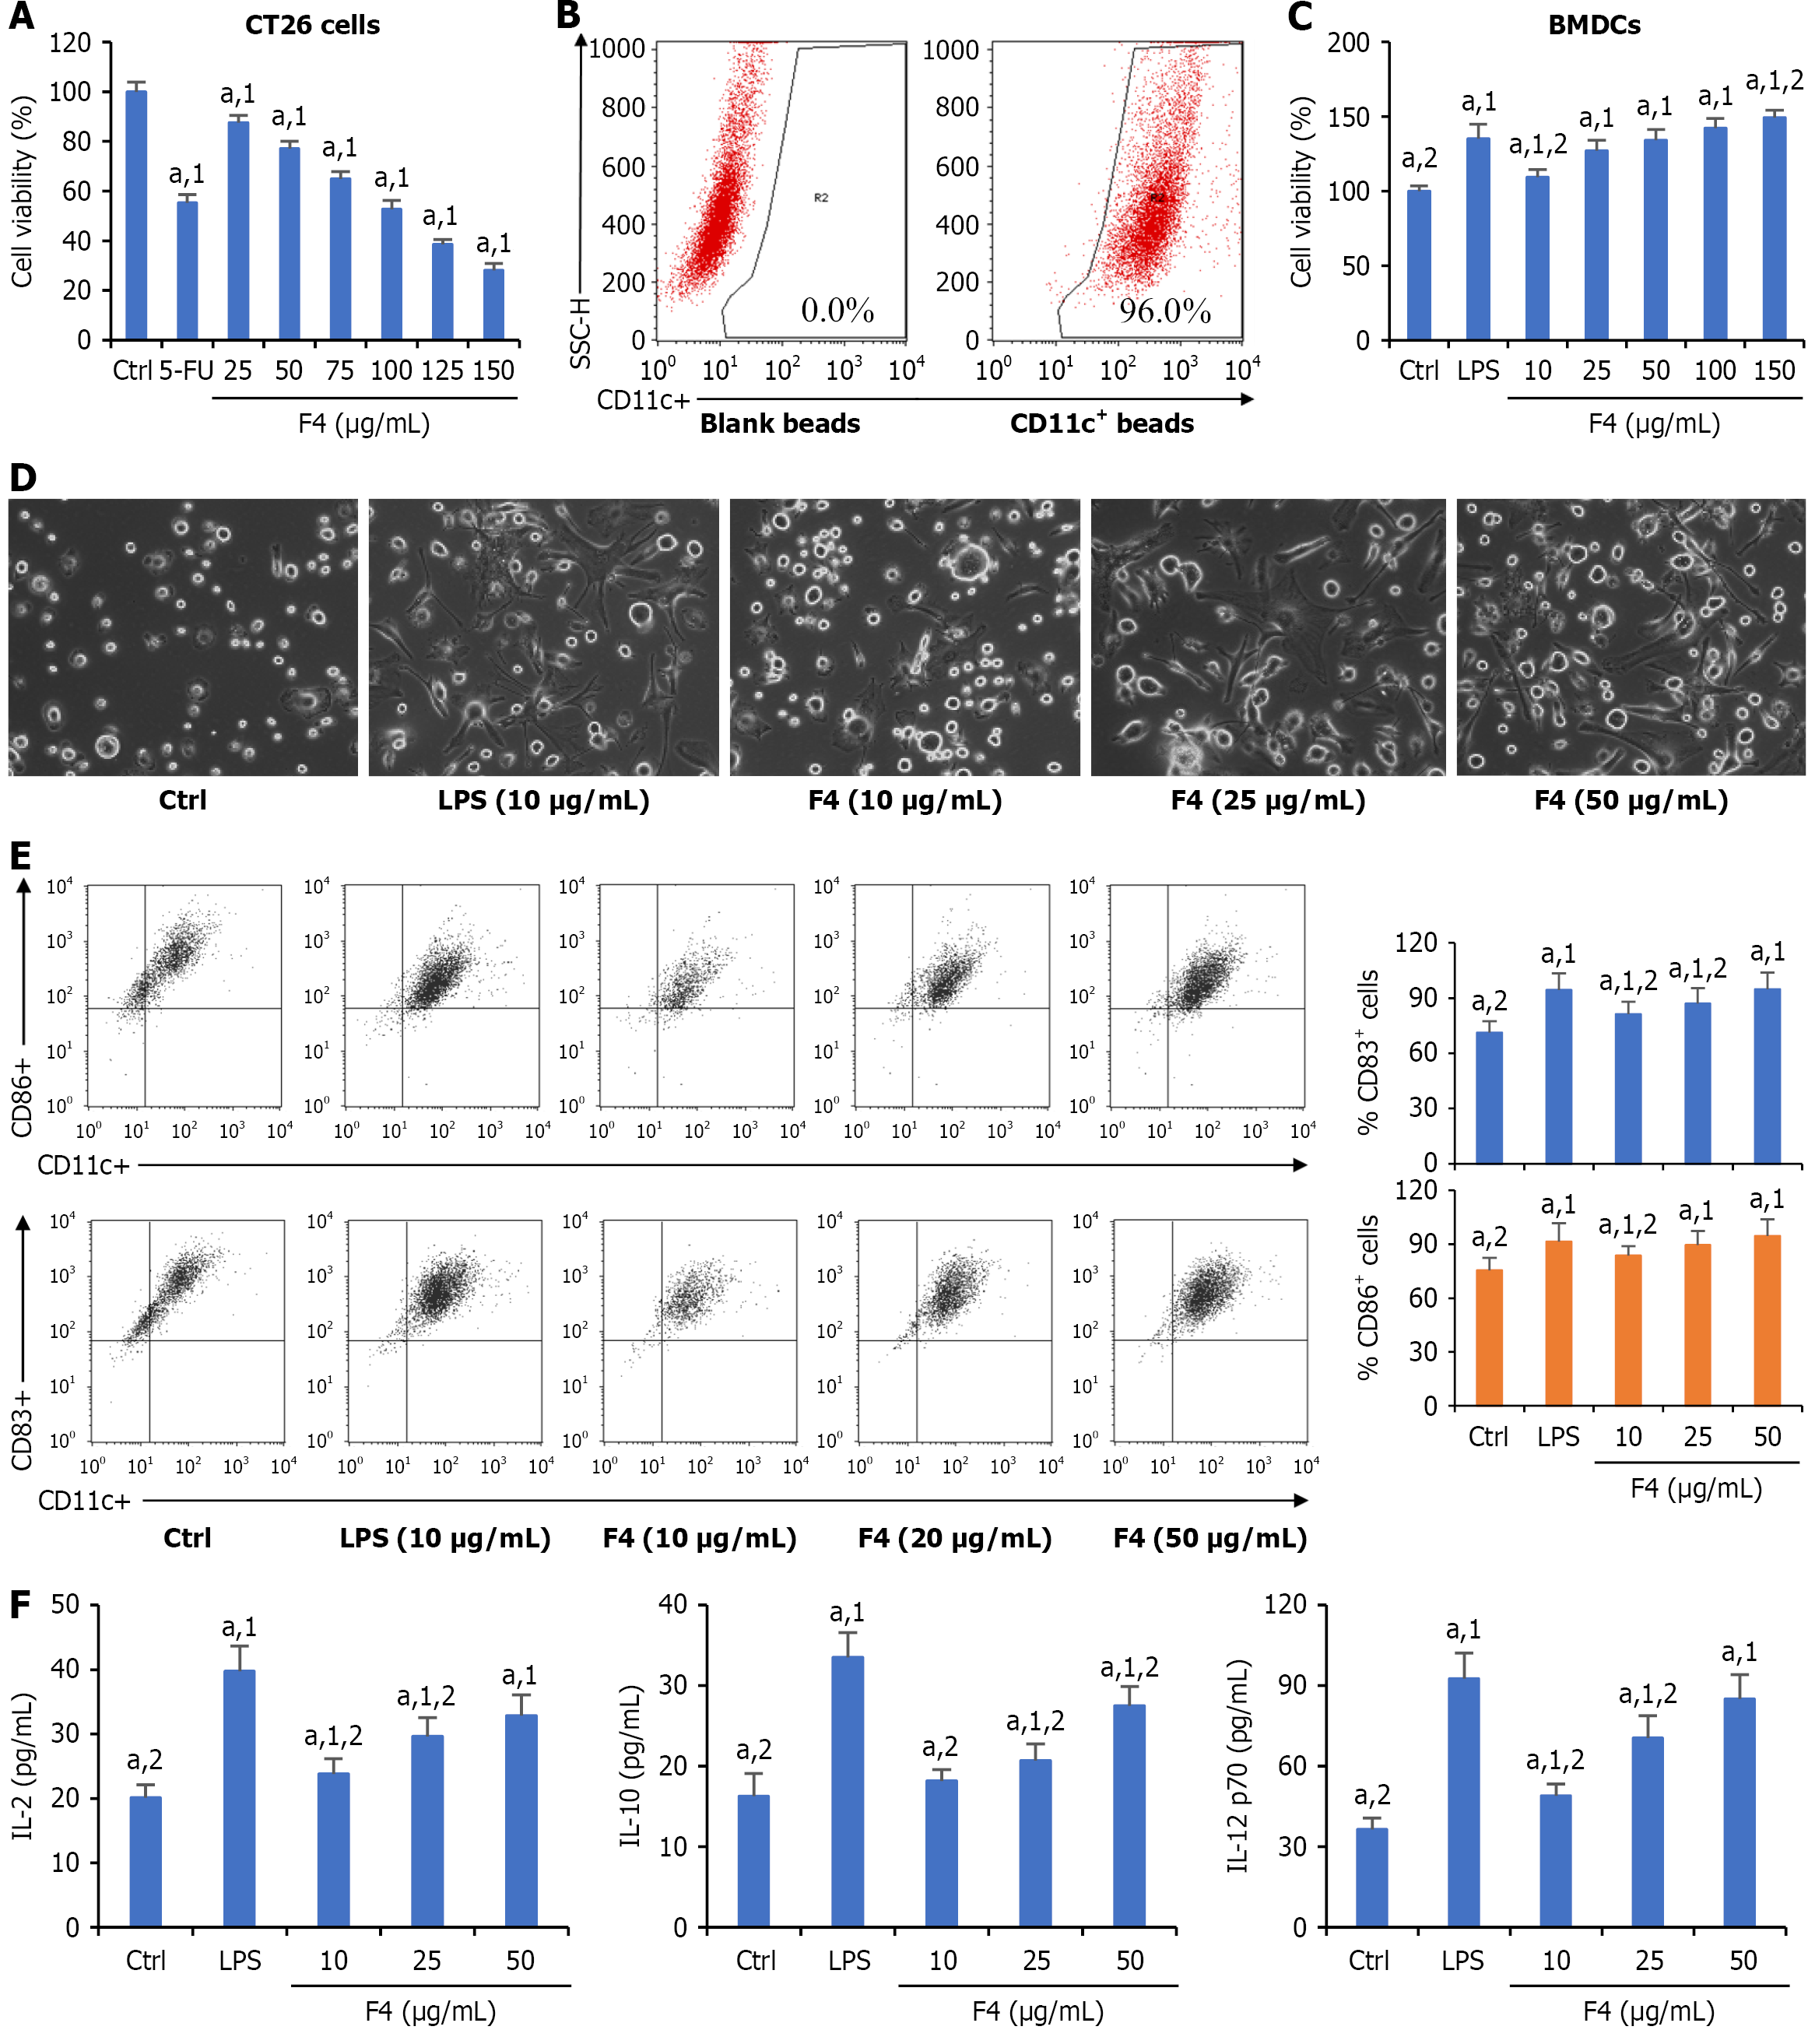
Figure 1 F4 promoted the maturation of bone marrow-derived dendritic cells in vitro.
A: Cytotoxicity of F4 on the proliferation of mouse colon CT26 cells; B: The purity (representative data) of bone marrow-derived dendritic cells (BMDCs) identified by flow cytometry; C: Cytotoxicity of F4 on the proliferation of BMDCs; D: Effects of F4 on the morphological change of BMDCs; E: Effects of F4 on the expressions of DC surface biomarkers cluster of differentiation (CD) 83 and CD86; F: Effects of F4 on the release of cytokines in the culture mediums. All data were shown as mean ± SD (n = 5). aP < 0.05. 1P vs control group. 2P vs lipopolysaccharides group. Ctrl: Control; 5-FU: 5-fluorouracil; CD: Cluster of differentiation; SSC-H: Side scatter high; BMDCs: Bone marrow-derived dendritic cells; LPS: Lipopolysaccharides; IL: Interleukin.
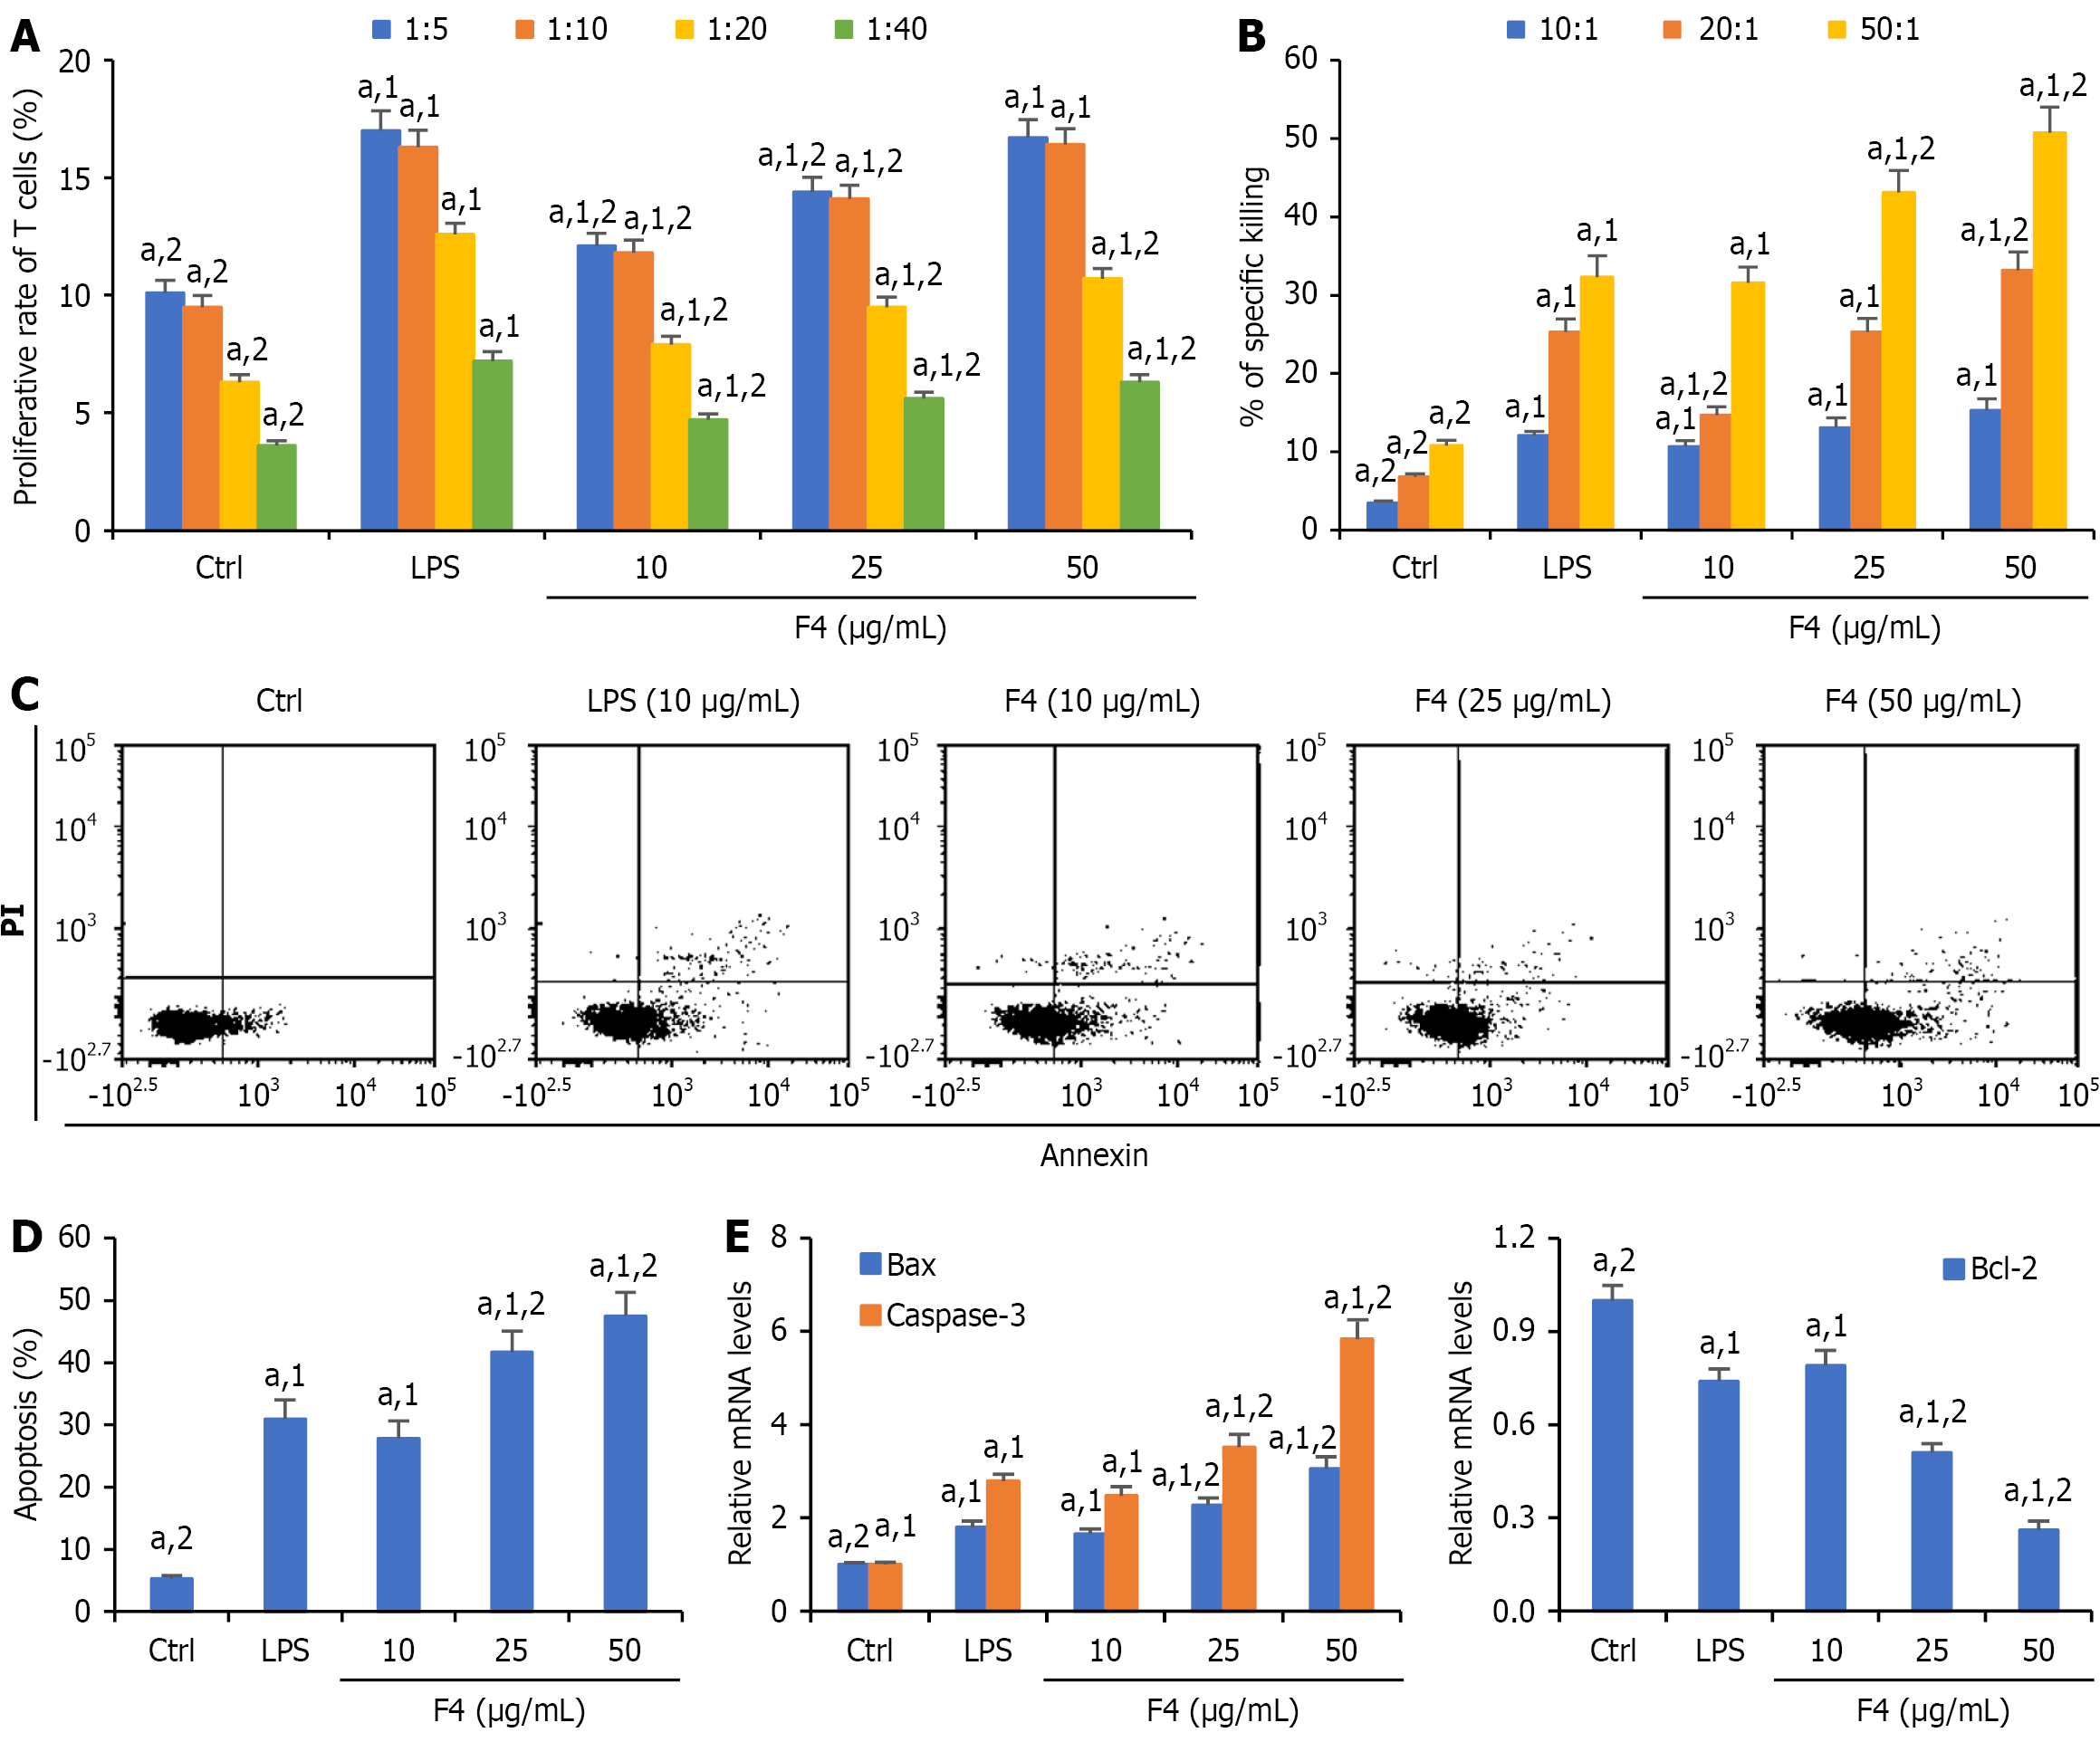
Figure 2 Dendritic cells cultured with F4 enhanced the cytotoxicity of cluster of differentiation 8 + T cells against CT26 cells.
A: Effects of F4-stimulated dendritic cells (DCs) on the proliferation of T cells; B: Cytotoxicity of tumor-specific cytotoxic T lymphocyte (CTL) responses against CT26 cells by F4-treated DCs; C and D: DC-stimulated cluster of differentiation 8 + T cells induced the apoptosis of CT26 cells; E: The relative levels of Bcl-2, Bax and caspase-3 message RNA in CTL-stimulated CT26 cells. All data were shown as mean ± SD (n = 5). aP < 0.05. 1P vs control group. 2P vs lipopolysaccharides group. Ctrl: Control; LPS: Lipopolysaccharides; PI: Propidium iodide.
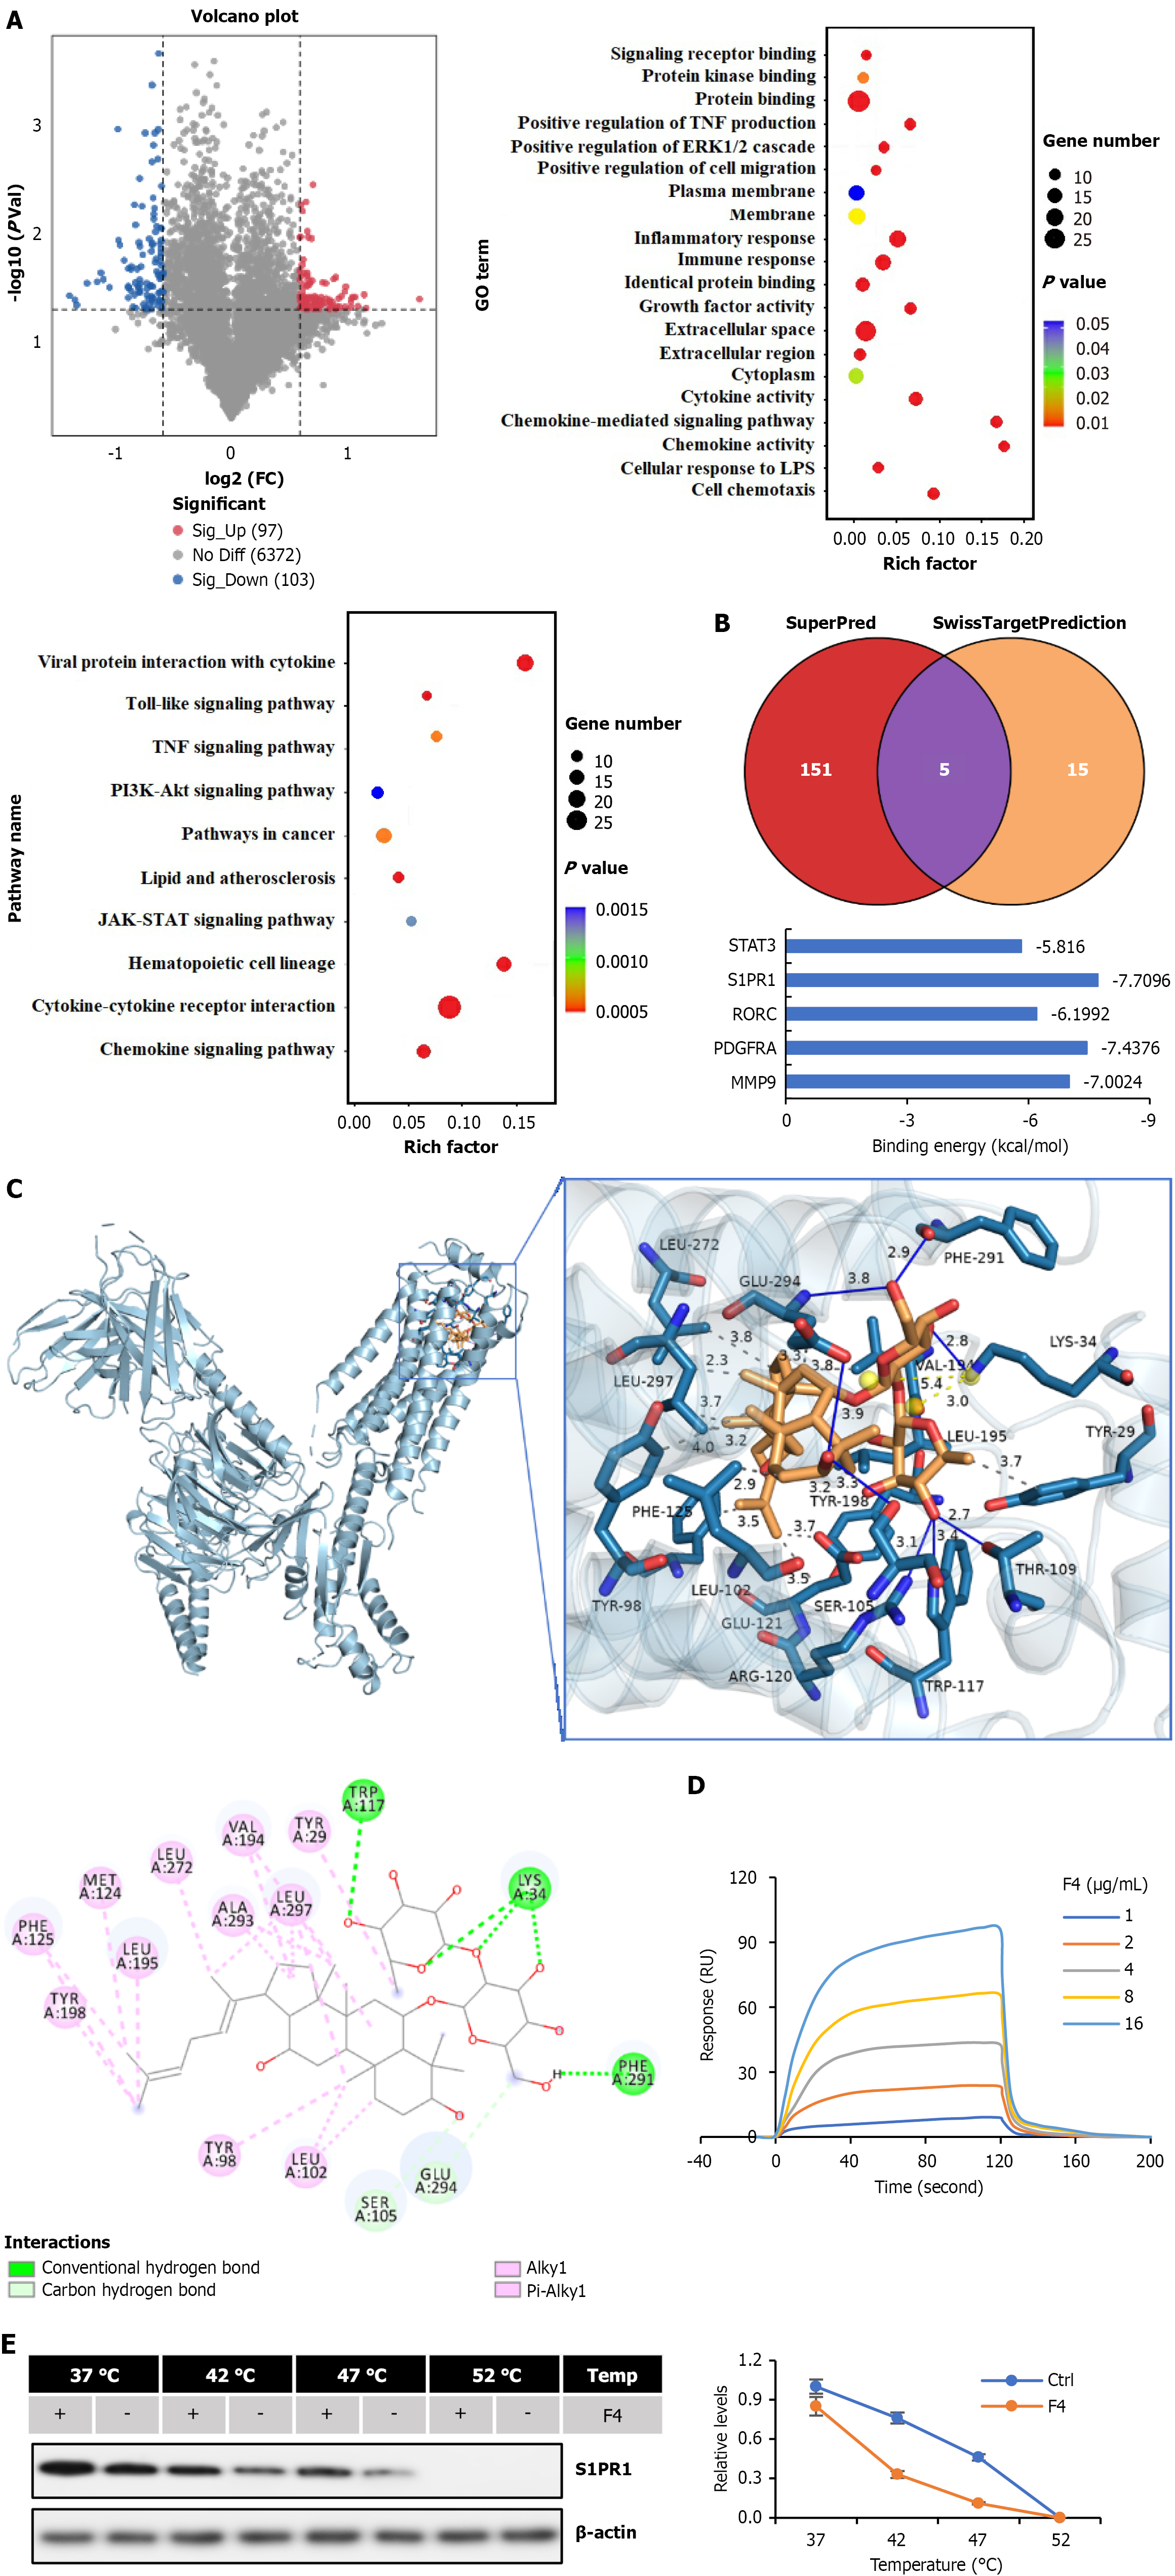
Figure 3 The regulation mechanism of F4 on the maturation of dendritic cells.
A: The volcano plot of differently expressed genes in dendritic cells treated with F4 or saline. The pathways of the involved differently expressed genes were enriched by Gene Ontology and Kyoto Encyclopedia of Genes and Genomes analysis; B: The targets of F4 were predicted by SuperPred and SwissTargetPrediction web-tools. The binding energies among targets and F4 were detected by using AutoDock tool; C: The interaction between target and F4 was evaluated by using AutoDock tool; D: The schematic diagram of interaction between sphingosine-1-phosphate 1 (S1PR1) and F4; E: The interaction between S1PR1 and F4 was detected by surface plasmon resonance assay and verified by thermostability assay. FC: Fold change; TNF: Tumor necrosis factor; GO: Gene Ontology; LPS: Lipopolysaccharides; ERK: Extracellular regulated protein kinases; JAK: Janus kinase; STAT: Signal transducer and activator of transcription; PI3K: Phosphatidylinositol 3-kinase; AKT: Protein kinase B; S1PR1: Sphingosine-1-phosphate 1.
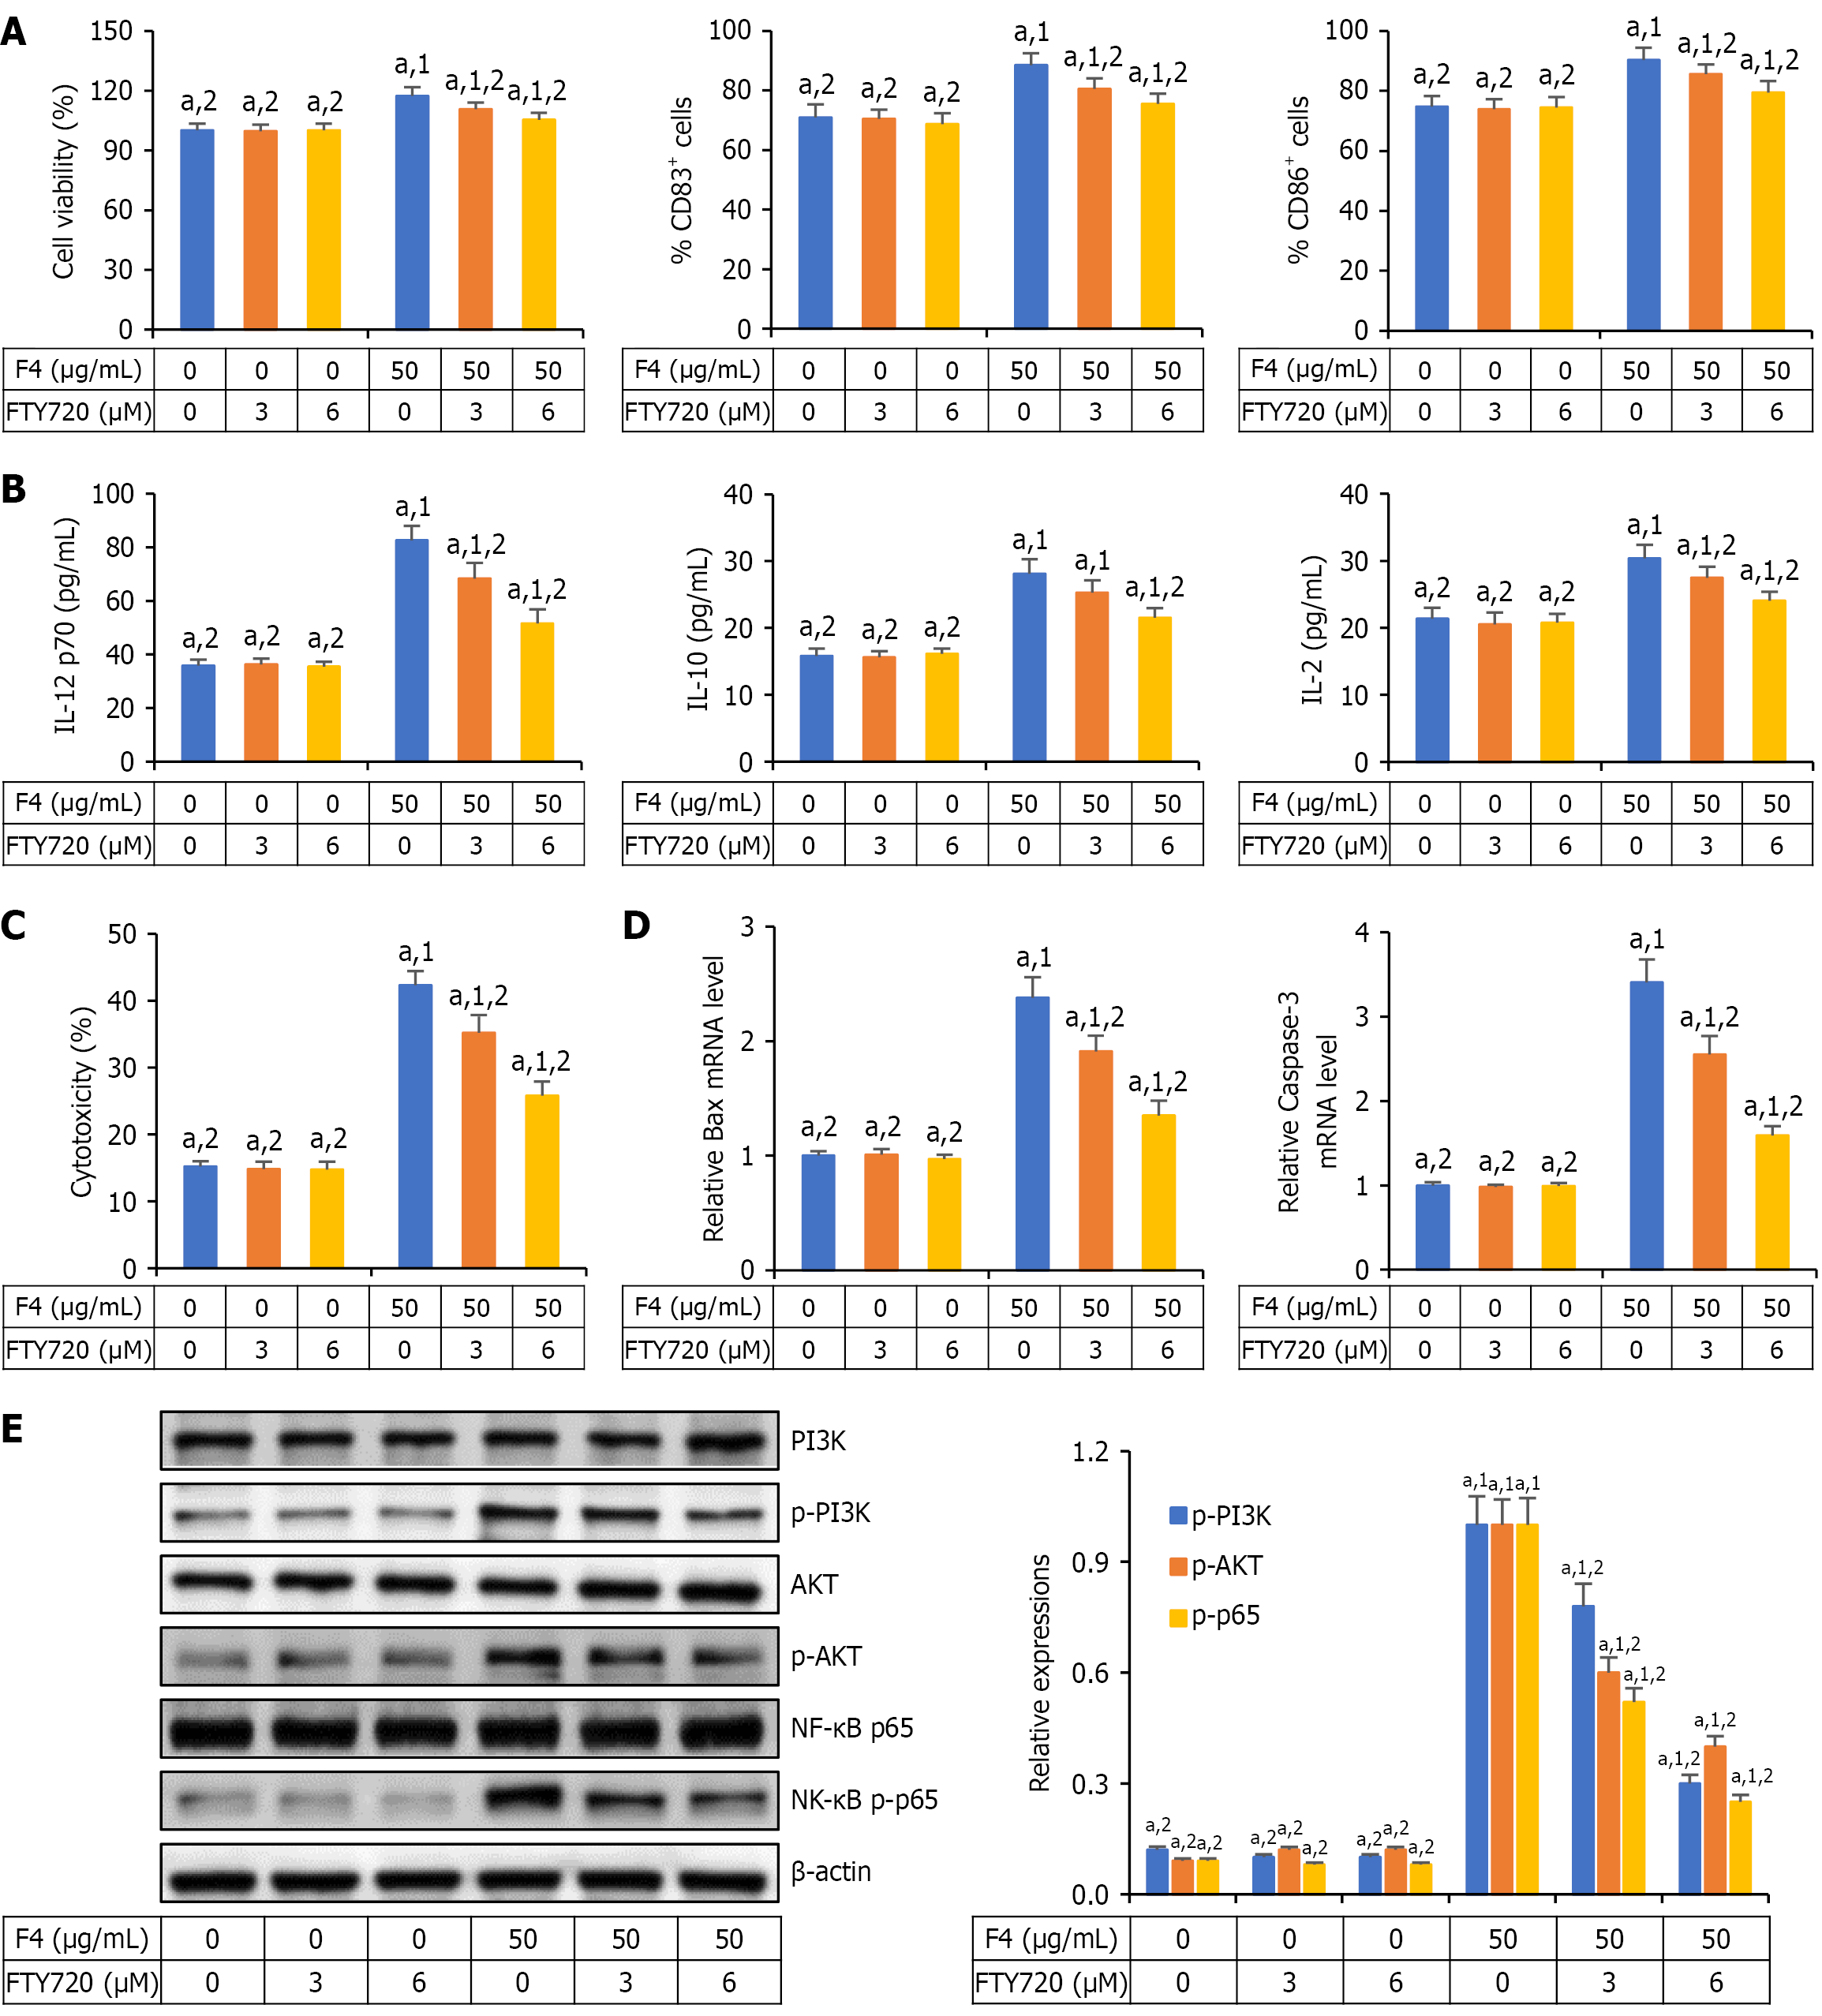
Figure 4 F4 promoted the maturation of dendritic cells via activation of phosphoinositide 3-kinase/protein kinase B and nuclear factor kappa-B pathways.
A and B: F4 promoted the maturation of dendritic cells (DCs) and the production of inflammatory cytokines, which could be reversed by sphingosine-1-phosphate 1 (S1PR1) inhibitor fingolimod hydrochloride (FTY720); C and D: F4-stimulated DCs enhanced cytotoxic T lymphocyte response against the proliferation of CT26 cells, which could be depleted by S1PR1 inhibitor FTY720; E: F4 upregulated the expressions of phosphorylated phosphatidylinositol 3-kinase, phosphorylated protein kinase B and nuclear factor kappa-B phosphorylated-p65 in DCs, which could be reversed by S1PR1 inhibitor FTY720. All data were shown as mean ± SD (n = 5). aP < 0.05. 1P vs control group (0 μg/mL F4 + 0 μM fingolimod hydrochloride). 2P vs 50 μg/mL F4-treated group. CD: Cluster of differentiation; IL: Interleukin; FTY720: Fingolimod hydrochloride; mRNA: Message RNA; PI3K: Phosphatidylinositol 3-kinase; p-PI3K: Phosphorylated phosphatidylinositol 3-kinase; AKT: Protein kinase B; p-AKT: Phosphorylated protein kinase B; NF-κB: Nuclear factor kappa-B.
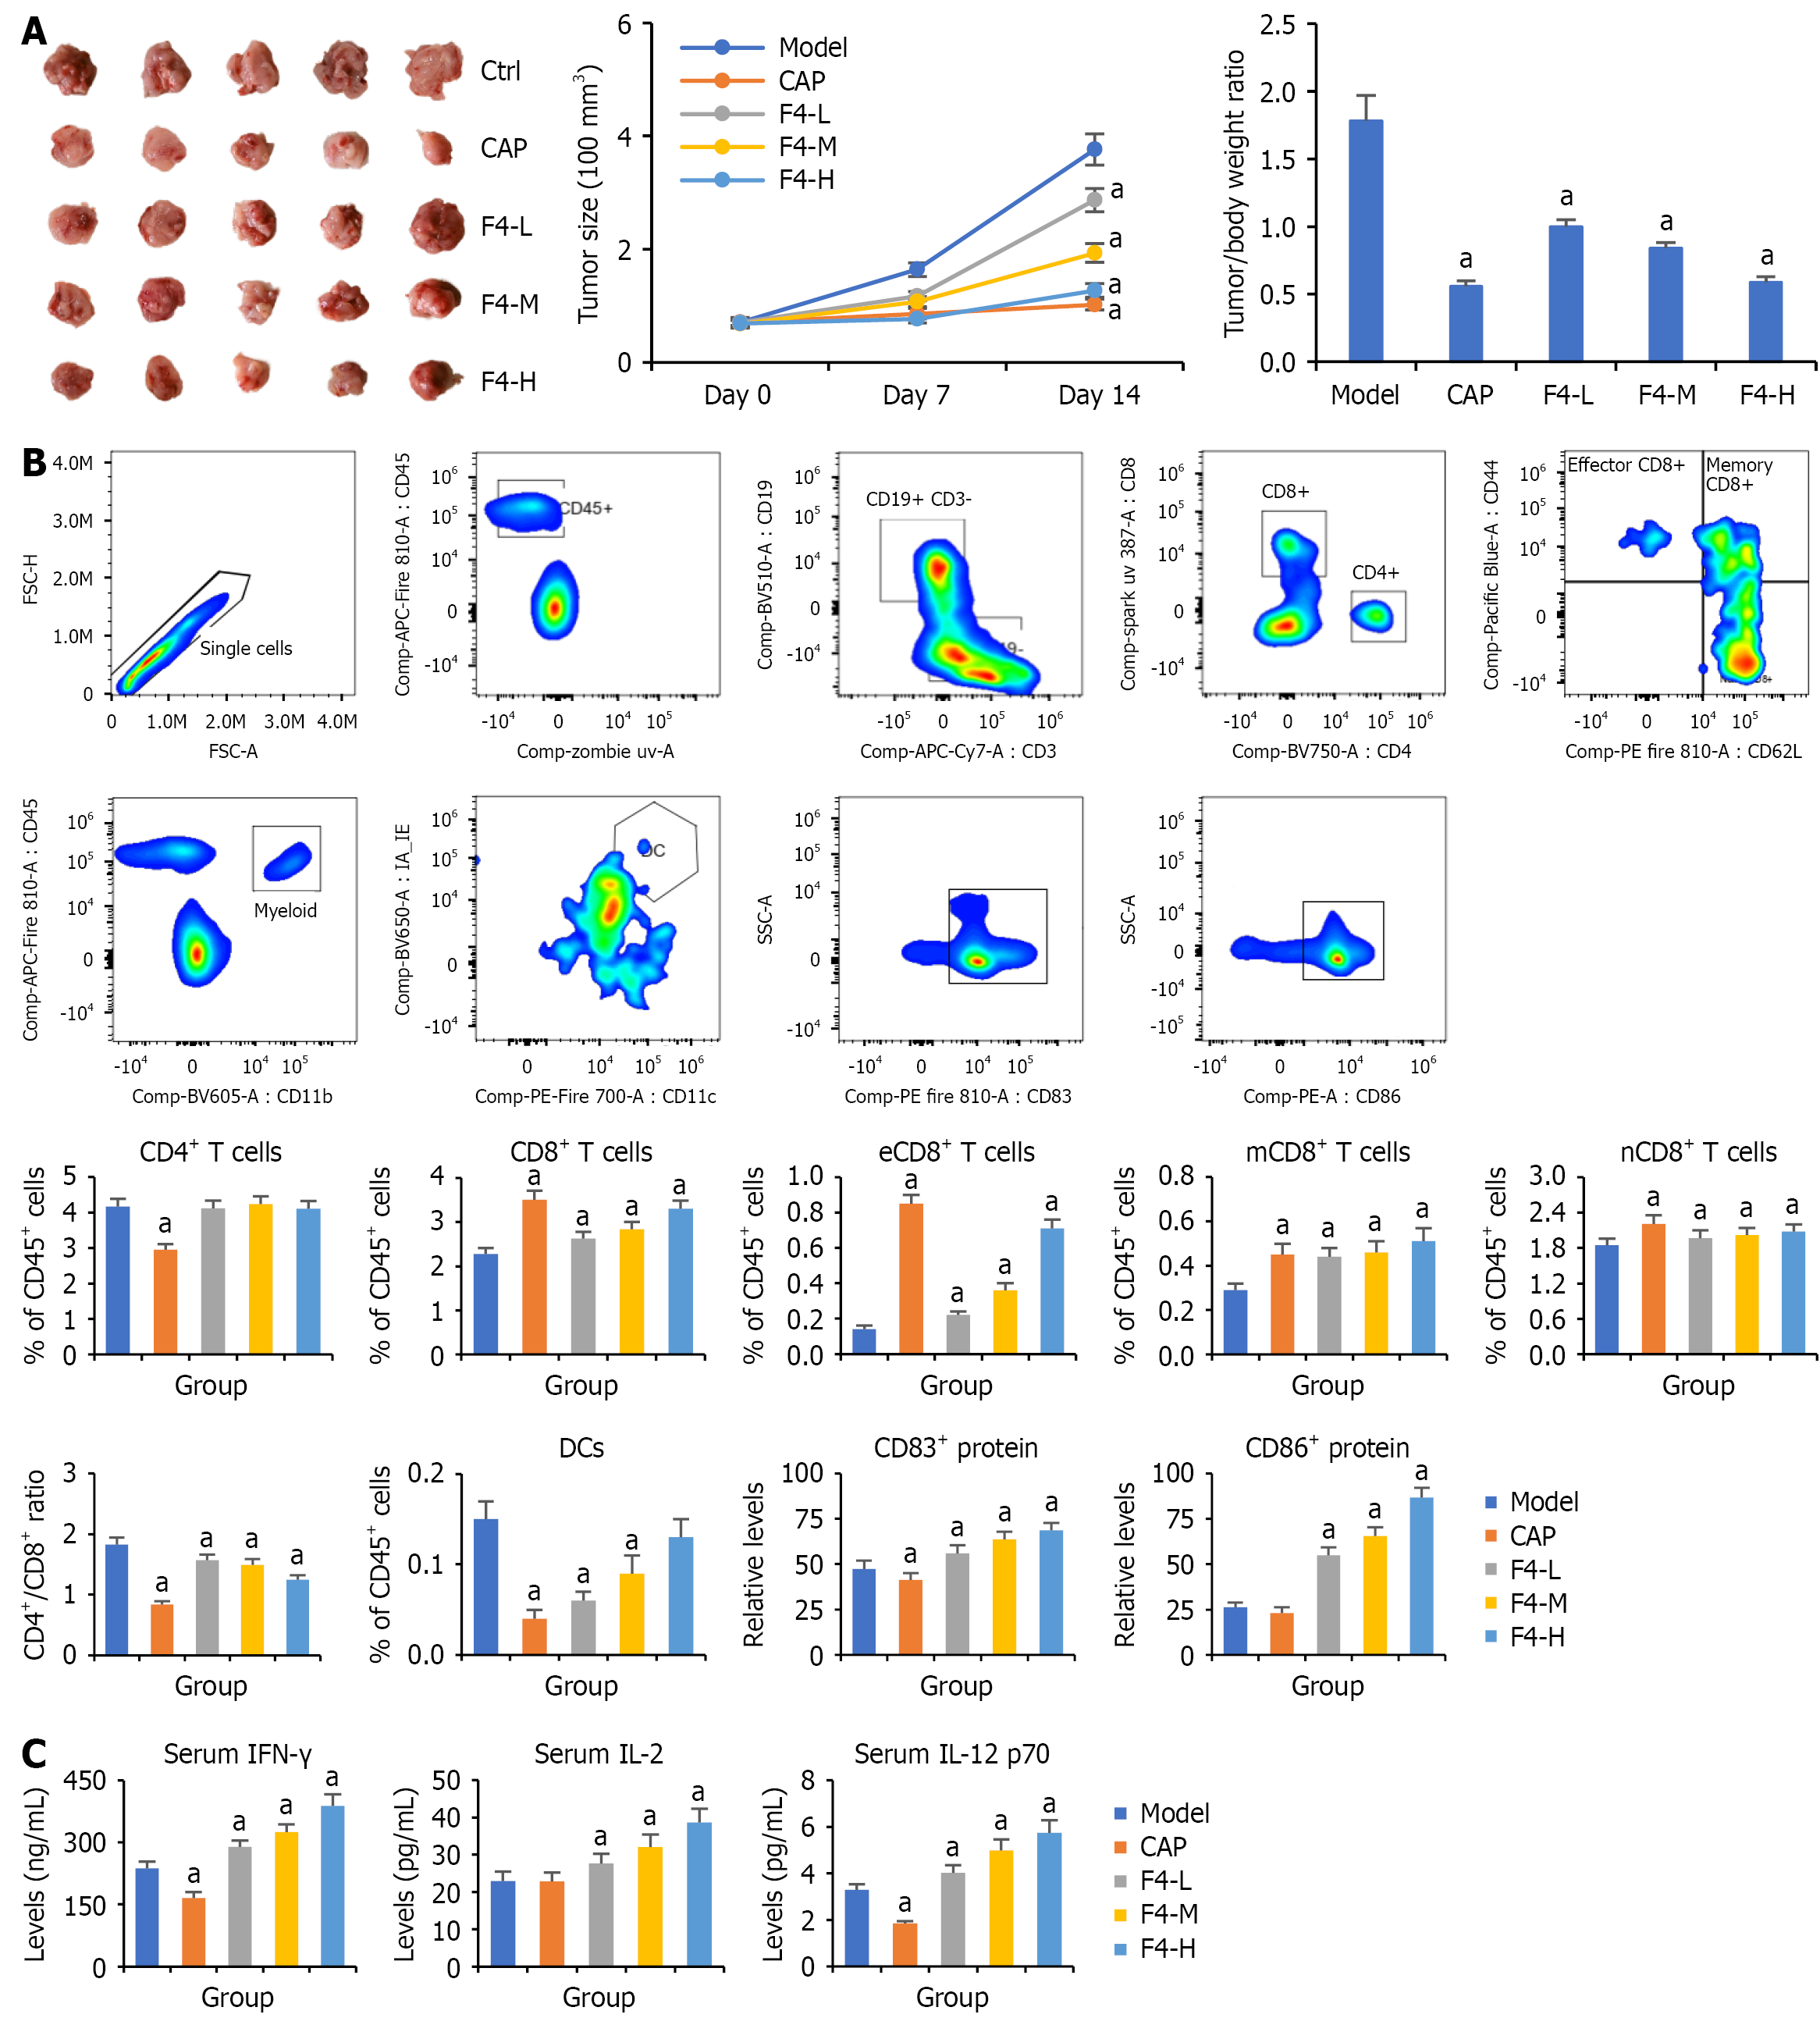
Figure 5 Effects of F4 on the tumor growth of CT26-bearing mice.
A: Inhibition of F4 on the tumor size and tumor/body weight ratio in CT26-bearing mice; B: The landscapes of peripheral immune cells detected by using 15-color spectral flow cytometry; C: The levels of interferon-γ, interleukin-2, and interleukin-12 p70 in the serum detected by enzyme-linked immunosorbent assay. All data were shown as mean ± SD (n = 5). aP < 0.05. P vs model group. Ctrl: Control; CAP: Capecitabine; L: Low; M: Middle; H: High; CD: Cluster of differentiation; eCD: Effective cluster of differentiation; mCD: Memory cluster of differentiation; nCD: Native cluster of differentiation; FSC-H: Forward scatter height; FSC-A: Forward scatter area; APC: Allophycocyanin; BV: Brilliant violet; UV: Ultraviolet; PE: Phycoerythrin; SSC-A: Side scatter area; PE-A: Phycoerythrin area; DC: Dendritic cells; IFN: Interferon; IL: Interleukin.
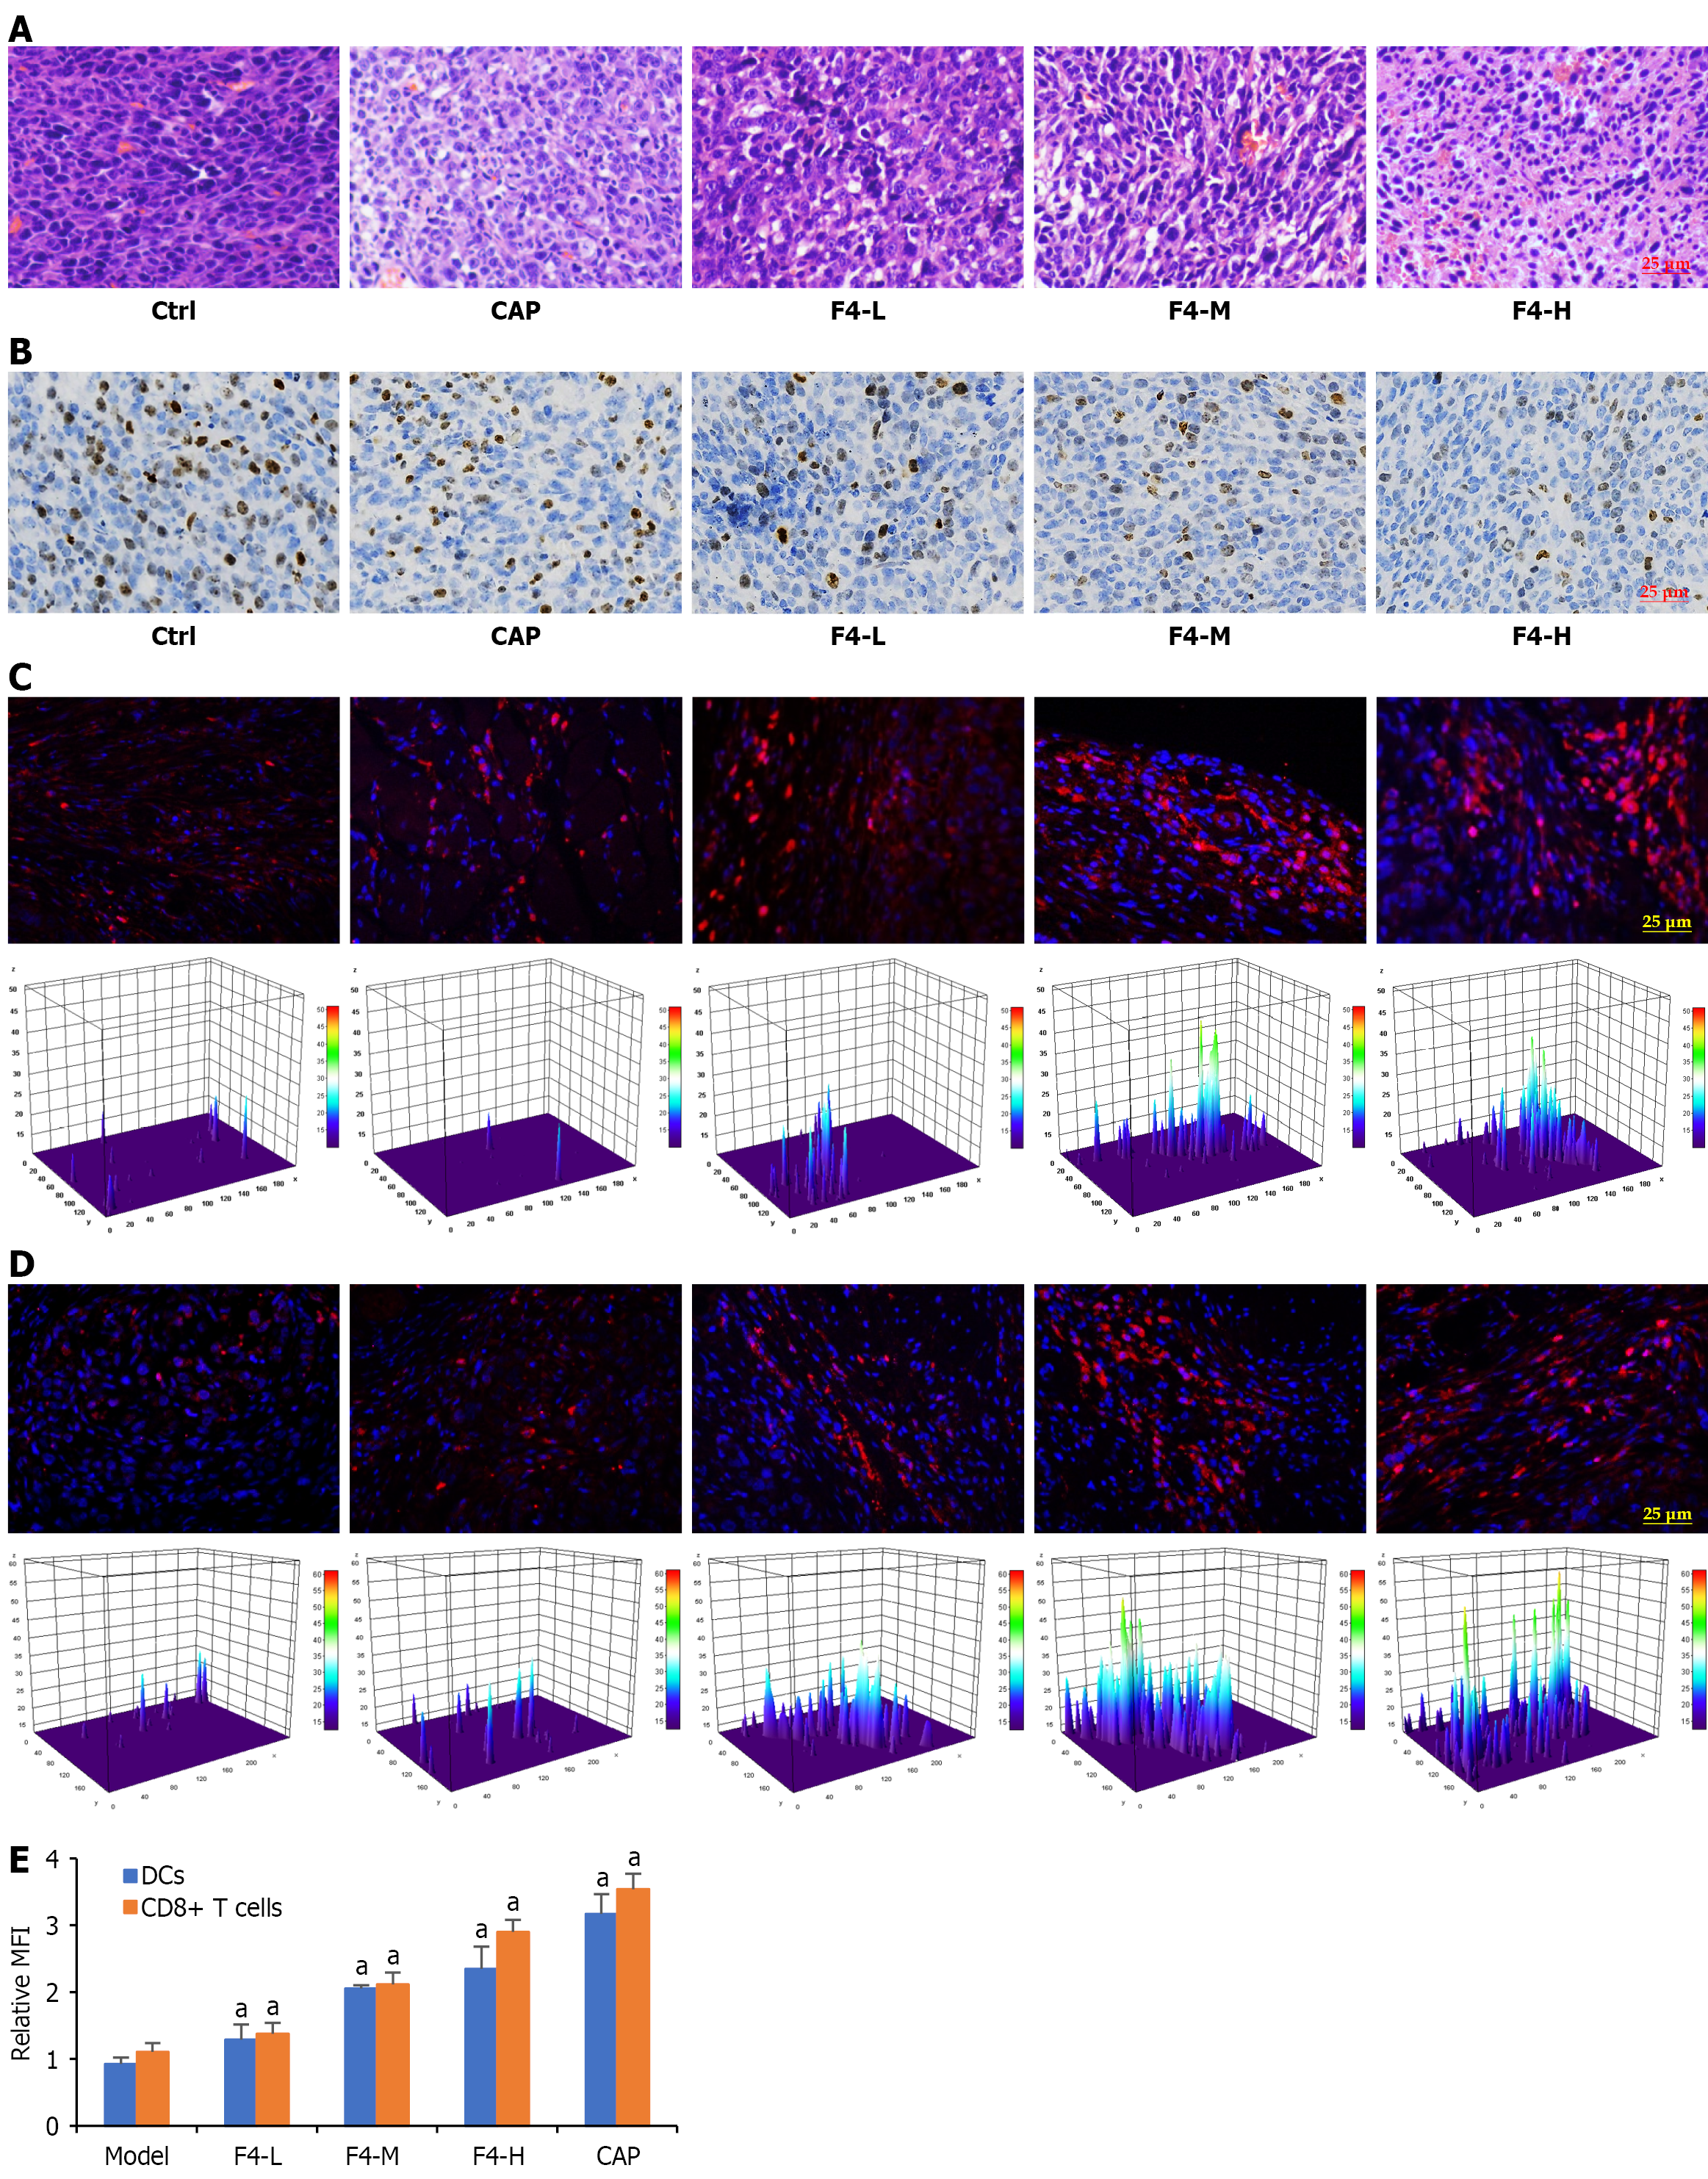
Figure 6 Effects of F4 on the immune cell infiltration in the tumor tissues of colon cancer CT26-bearing mice.
A: Histological change of tumor tissues; B: Representative immunohistochemical images of Ki67 protein expressions in the tumor tissue; C: Representative immunofluorescent images indicated the infiltration of dendritic cells (DCs); D: Cluster of differentiation (CD) 8+ T cells in the tumor tissues. DCs were stained with Texas red-labeled CD11c antibody (red), CD8+ T cells were stained with Texas red-labeled CD8 antibody (red), and nuclei was stained with 4’,6-diamidino-2-phenylindole (blue); E: Quantification of DC or CD8+ T-cell infiltration was visualized by using three-dimensional Gaussian density analysis. All data were shown as mean ± SD (n = 5). aP < 0.05. P vs model group. Ctrl: Control; CAP: Capecitabine; L: Low; M: Middle; H: High; DC: Dendritic cells; CD: Cluster of differentiation; MFI: Mean fluorescence intensity.
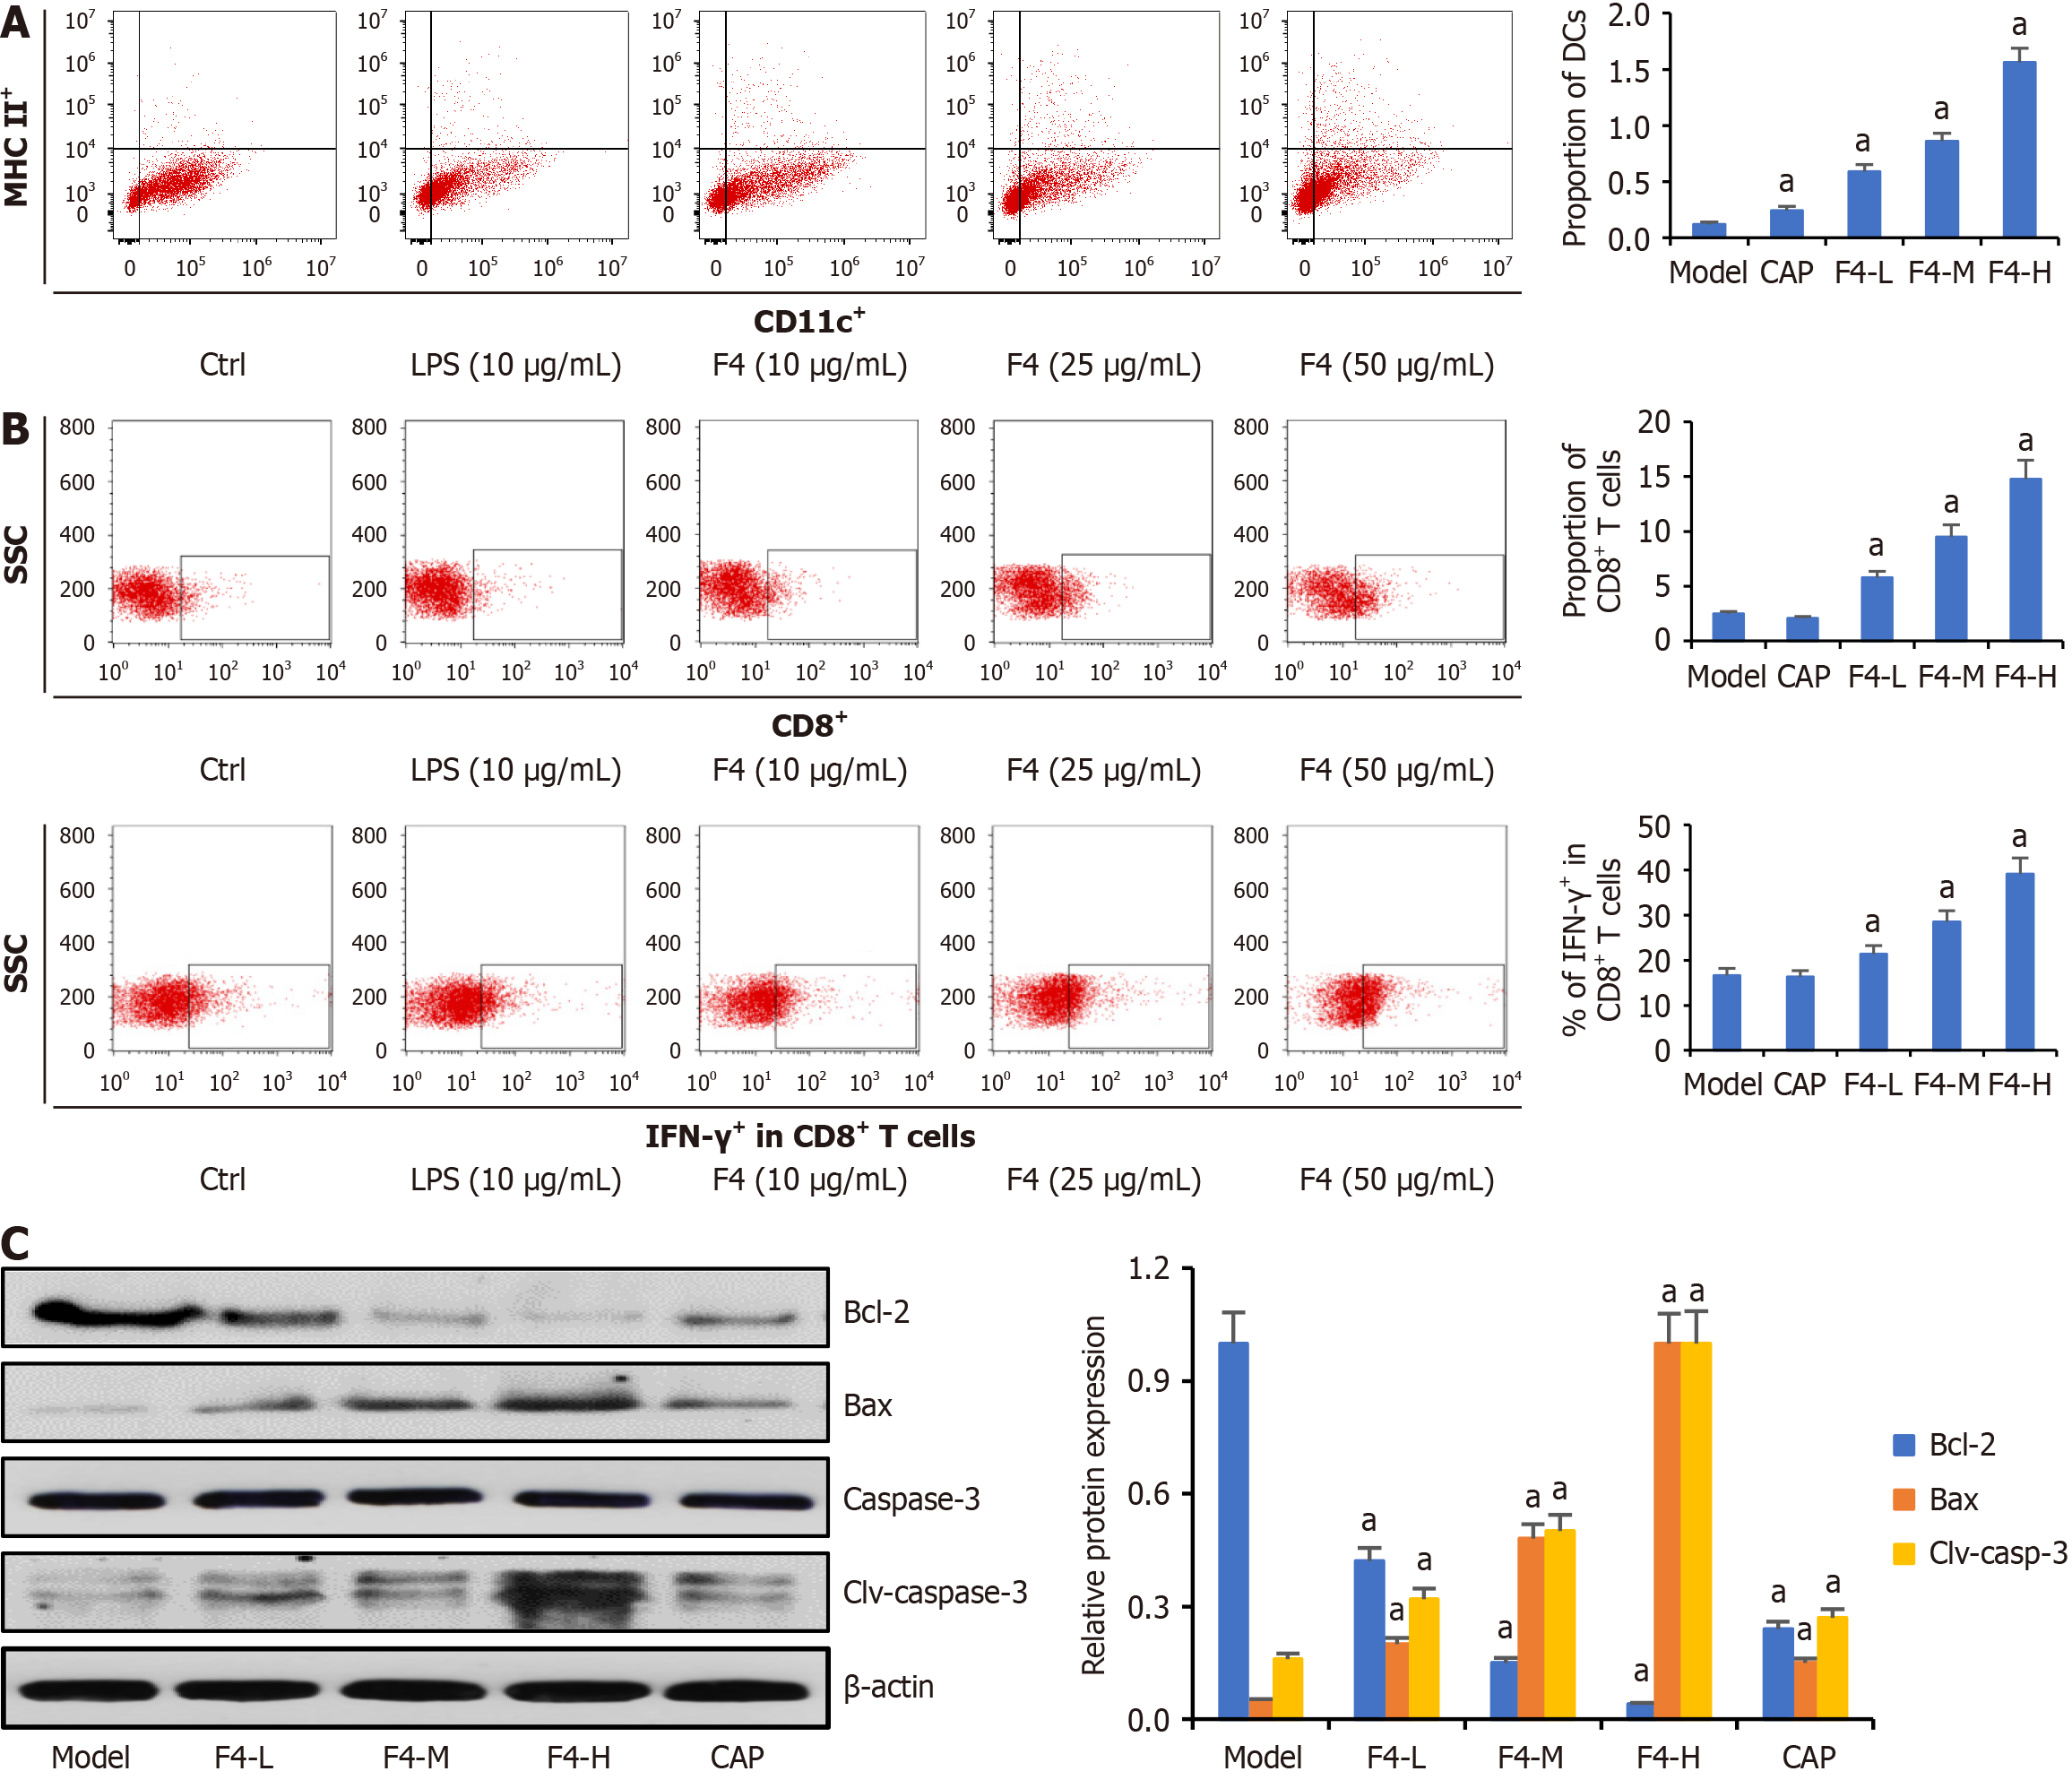
Figure 7 F4-enhanced cytotoxic T lymphocyte induced the apoptosis of CT26 cells.
A: The proportions of dendritic cells in the tumor tissues, which were detected by flow cytometry; B: The proportions of cluster of differentiation (CD) 8+ T cells in the tumor tissues, and the interferon-γ expression in the CD8+ T cells, which were detected by flow cytometry; C: The expressions of apoptosis-related proteins in the tumor tissues of CT26-bearing mice. All data were shown as mean ± SD (n = 5). aP < 0.05. P vs model group. MHC: Major histocompatibility complex; Ctrl: Control; CD: Cluster of differentiation; CAP: Capecitabine; L: Low; M: Middle; H: High; LPS: Lipopolysaccharides; SSC: Side scatter; IFN: Interferon.
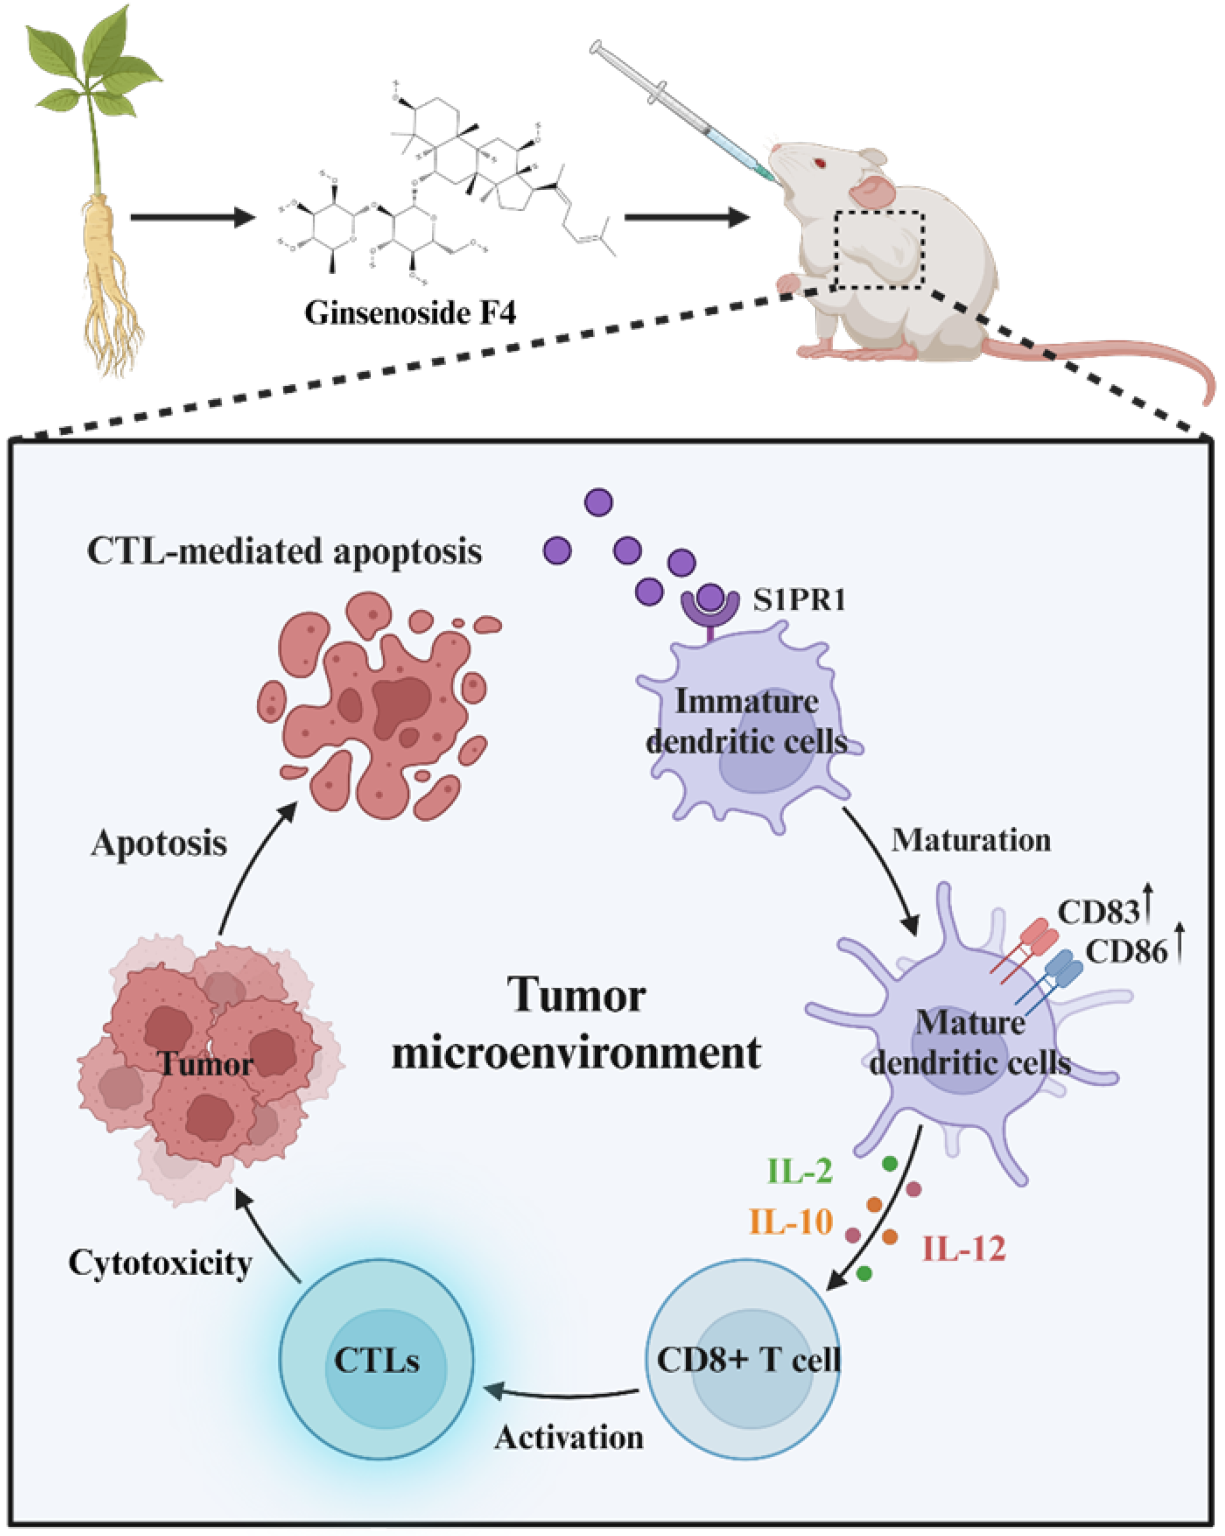
Figure 8 Schematic diagram of antitumor effects of ginsenoside F4 on colorectal cancer progression by boosting dendritic cell matu
- Citation: Xie W, Li XJ, Zhong YS, Fang J, Qi H, Yang M, Ying HZ, Yu CH. Ginsenoside F4 inhibits colorectal cancer progression by boosting dendritic cell maturation and remodeling the tumor microenvironment. World J Gastrointest Oncol 2025; 17(9): 108892
- URL: https://www.wjgnet.com/1948-5204/full/v17/i9/108892.htm
- DOI: https://dx.doi.org/10.4251/wjgo.v17.i9.108892


