Copyright
©The Author(s) 2025.
World J Gastrointest Oncol. Sep 15, 2025; 17(9): 108277
Published online Sep 15, 2025. doi: 10.4251/wjgo.v17.i9.108277
Published online Sep 15, 2025. doi: 10.4251/wjgo.v17.i9.108277
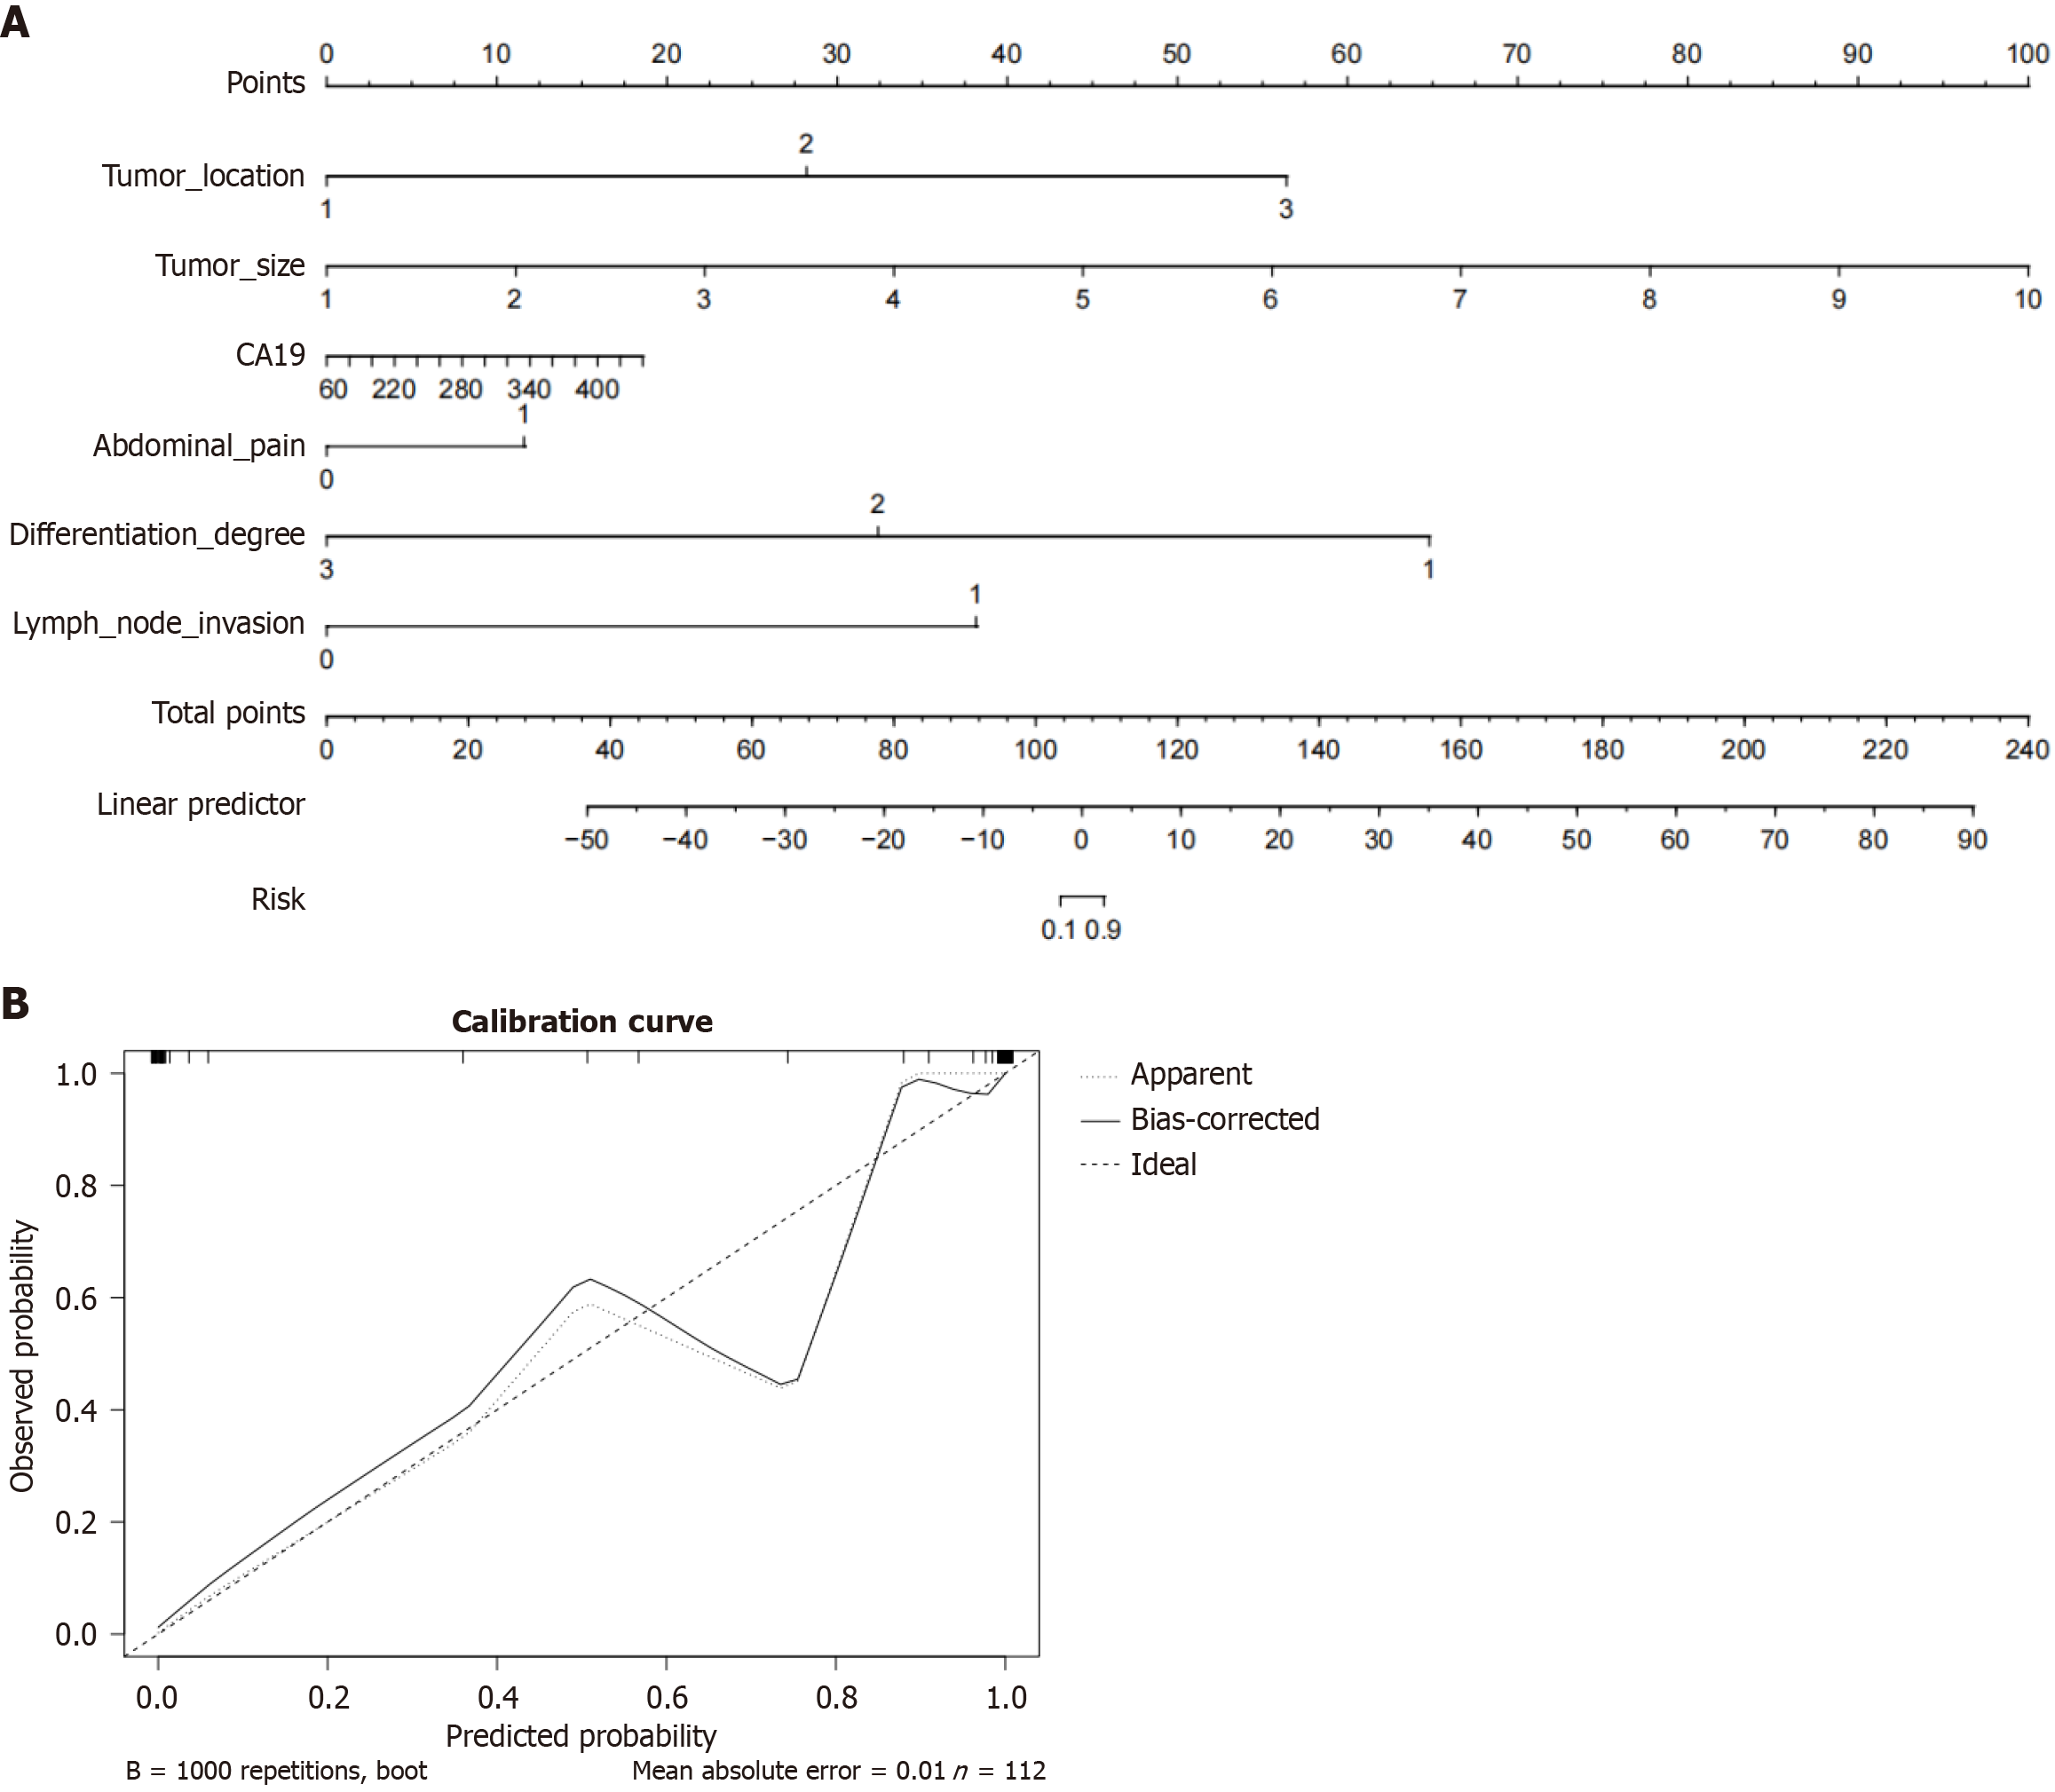
Figure 1 Construction and validation of a line chart model for neuroinvasion of pancreatic cancer.
A: Line chart predictive model for the occurrence rate of neuroinvasion in pancreatic cancer; B: Calibration curve of the predictive model for the occurrence rate of neuroinvasion in pancreatic cancer. CA19: Carbohydrate antigen 19.
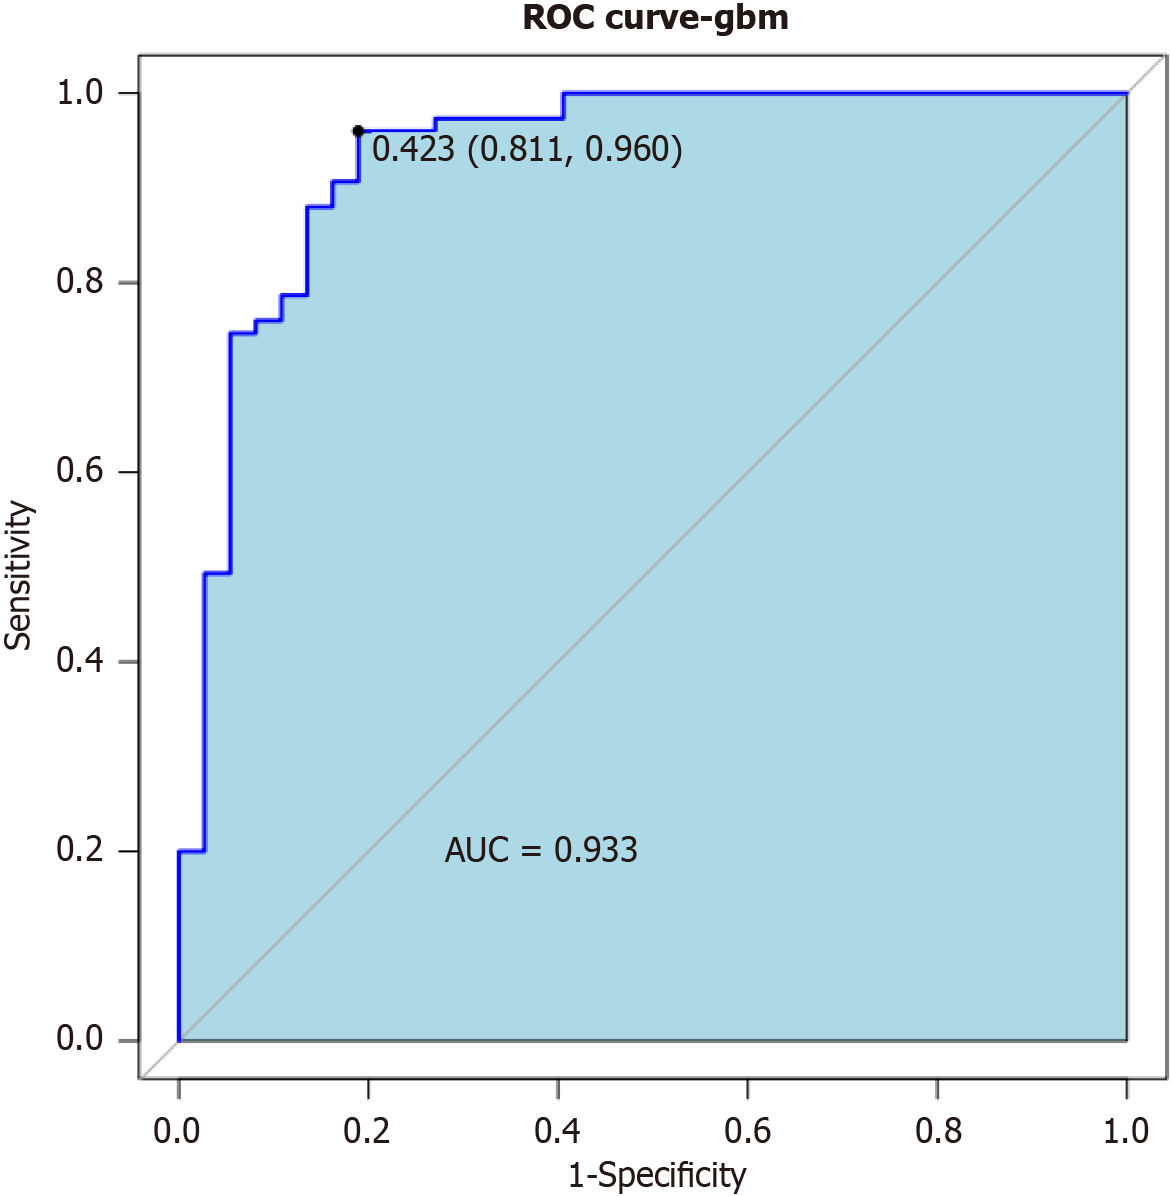
Figure 2 Combination model of pathological characteristics.
ROC: Receiver operating characteristic; AUC: Area under curve.
- Citation: Lu XL, Ge C, Wang RC, Zang H. Correlation between perineural invasion and clinicopathological characteristics in pancreatic cancer. World J Gastrointest Oncol 2025; 17(9): 108277
- URL: https://www.wjgnet.com/1948-5204/full/v17/i9/108277.htm
- DOI: https://dx.doi.org/10.4251/wjgo.v17.i9.108277


