Copyright
©The Author(s) 2025.
World J Gastrointest Oncol. Sep 15, 2025; 17(9): 107651
Published online Sep 15, 2025. doi: 10.4251/wjgo.v17.i9.107651
Published online Sep 15, 2025. doi: 10.4251/wjgo.v17.i9.107651
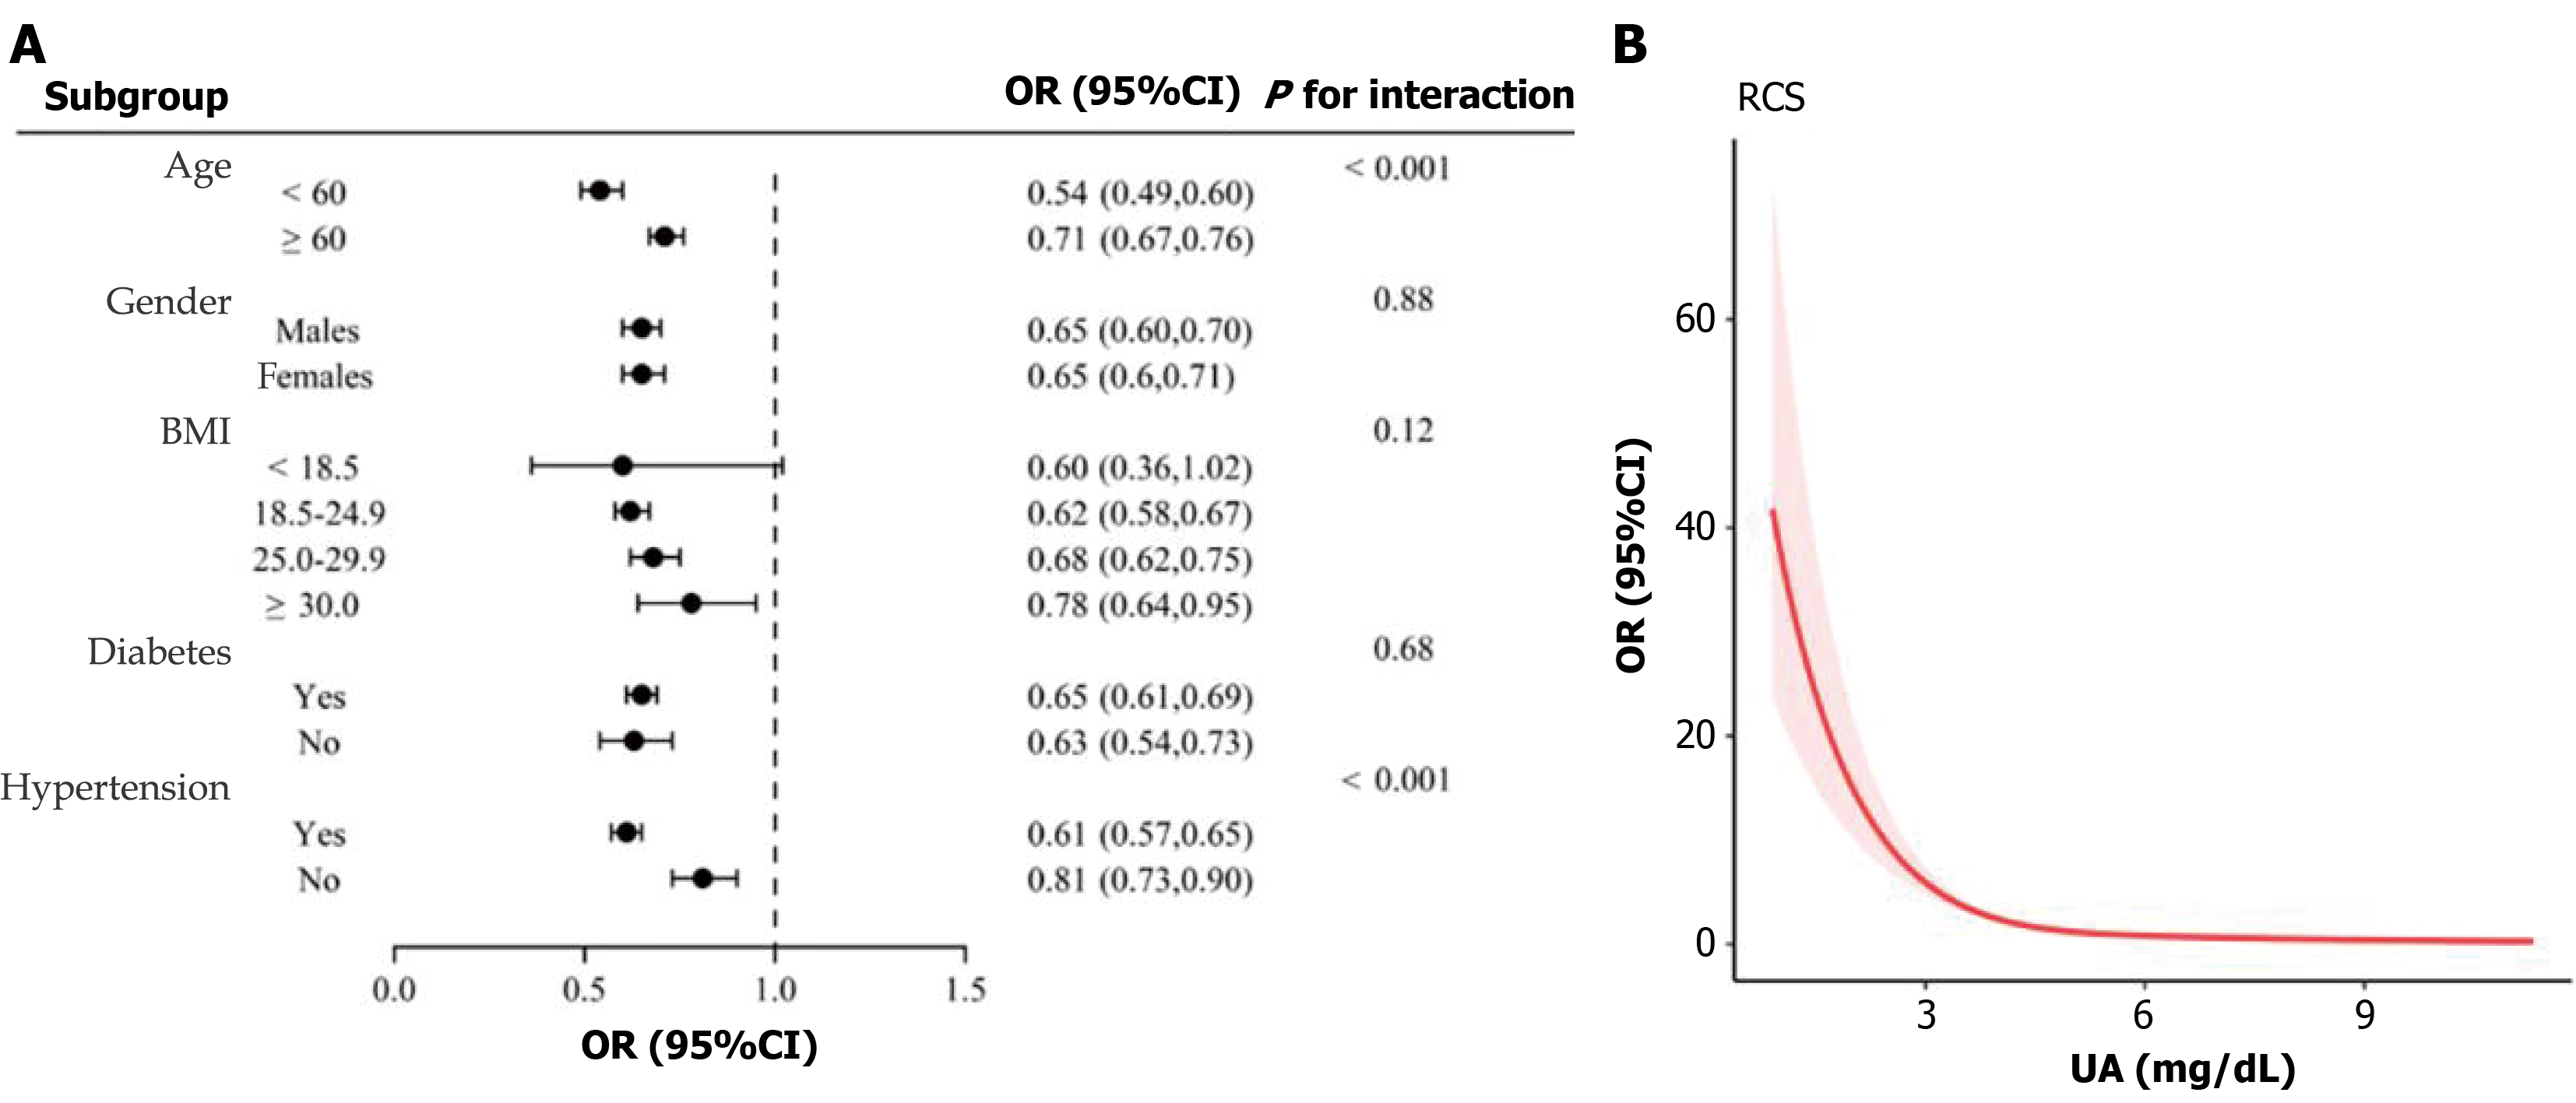
Figure 1 Association between uric acid and colon cancer risk.
A: Forest plot of interaction analysis; B: Nonlinear relationship between uric acid and colon cancer risk. BMI: Body mass index; OR: Odds ratio; CI: Confidence interval; RCS: Restricted cubic spline; UA: Uric acid.
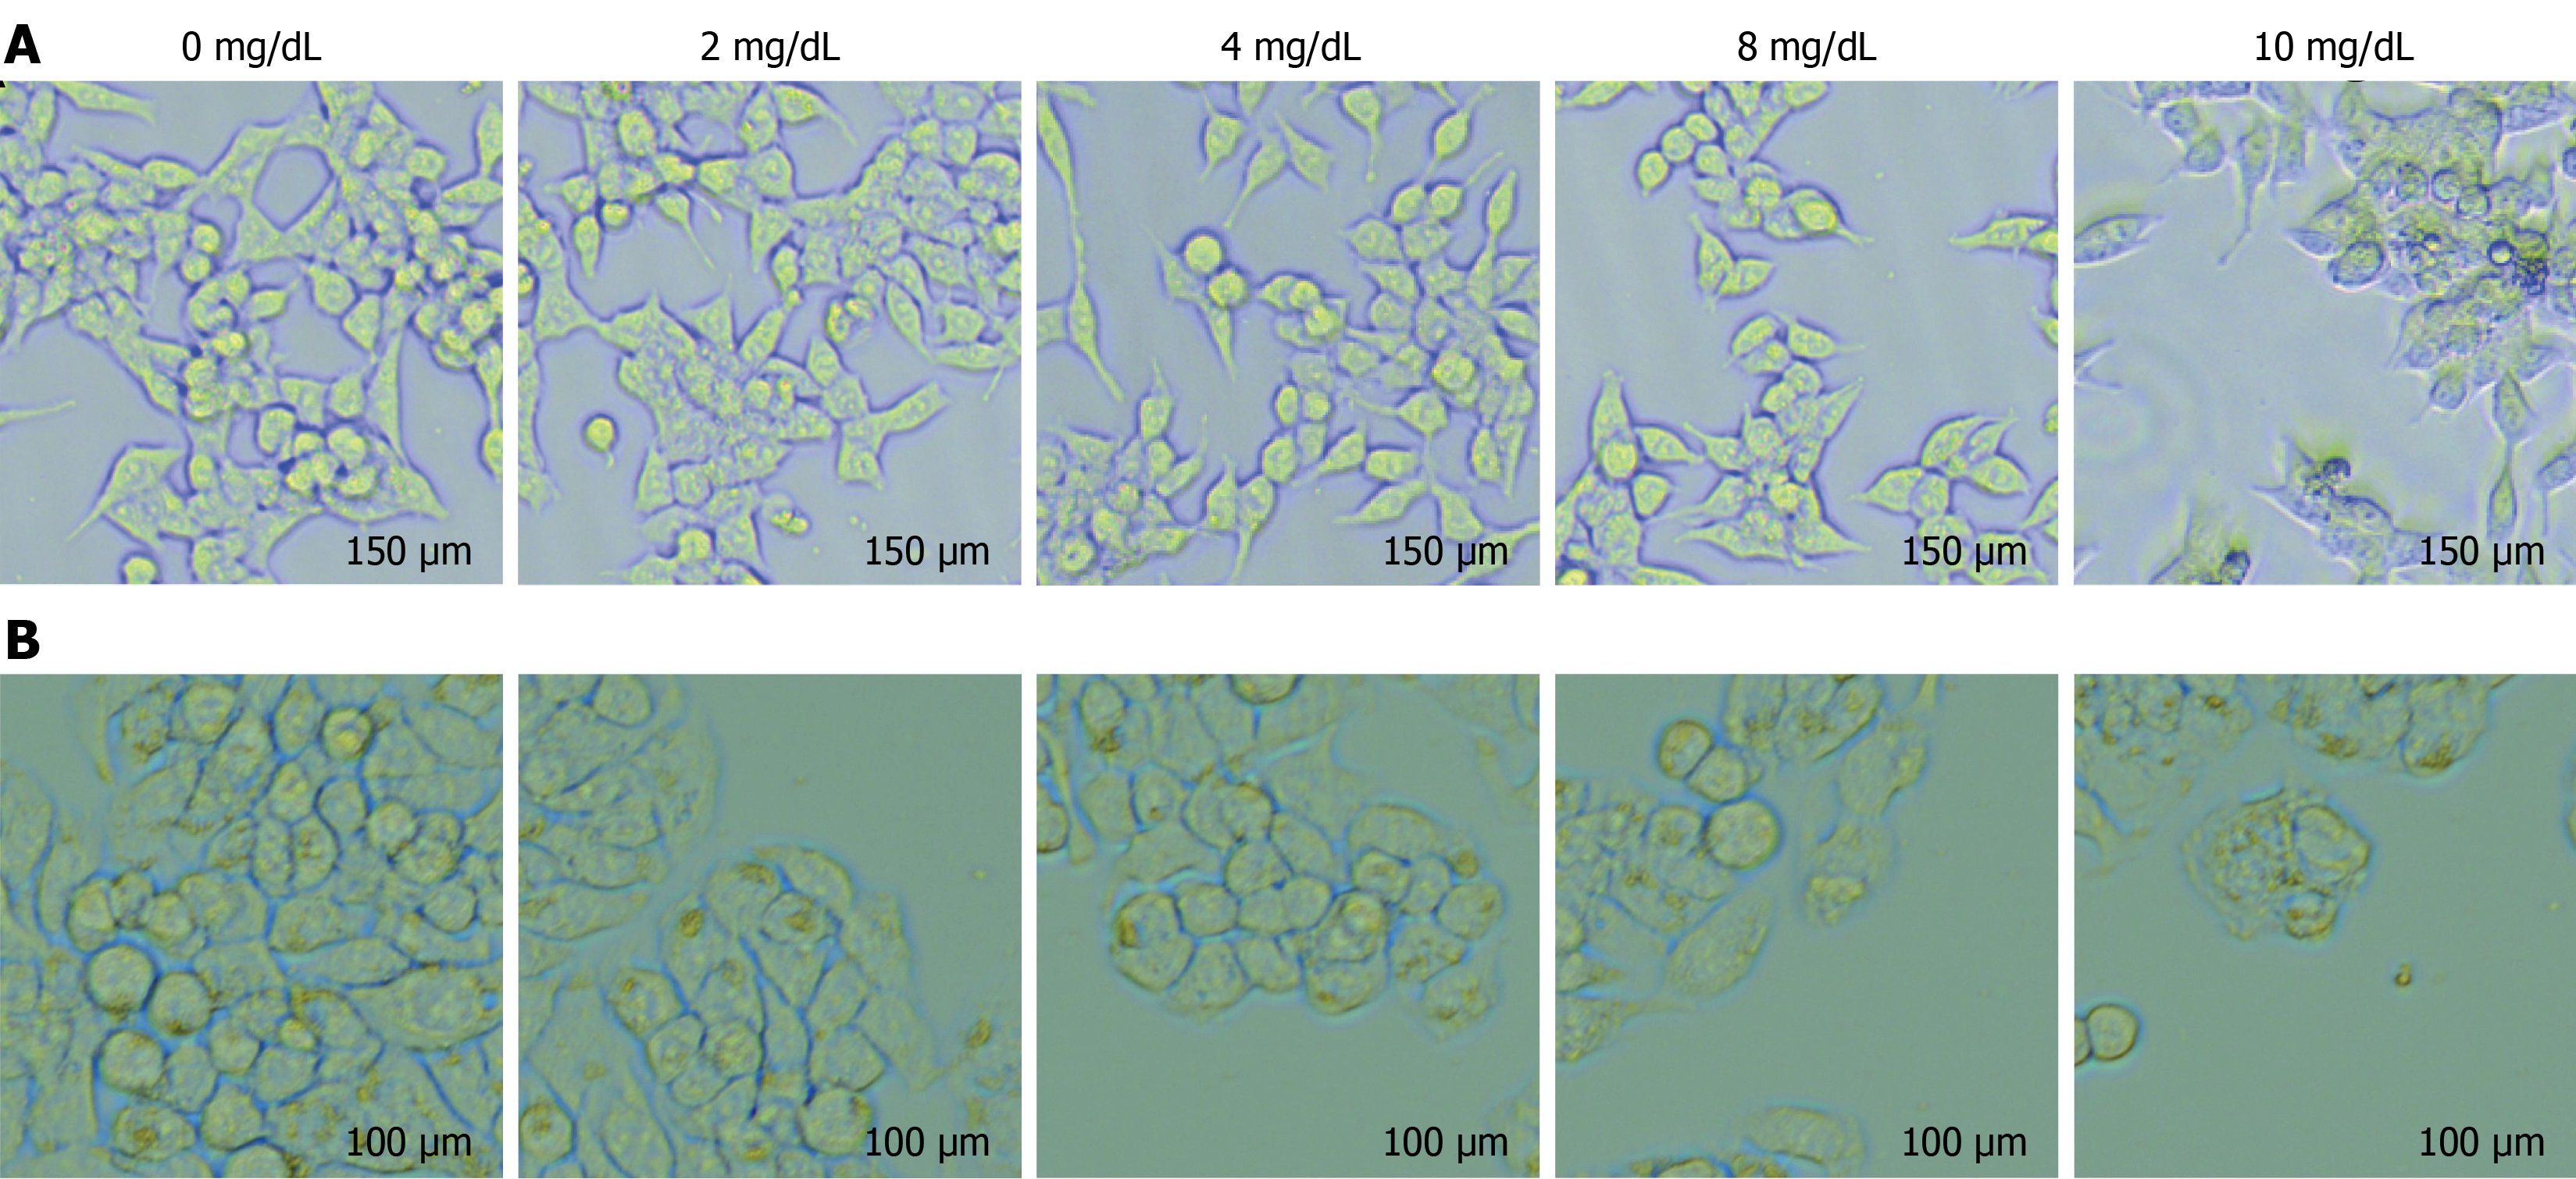
Figure 2 Cell morphology of colon cells after intervention with different concentrations of uric acid.
A: Cell morphology of HCT-116 cells after intervention with different concentrations of uric acid; B: Cell morphology of HT29 cells after intervention with different concentrations of uric acid.
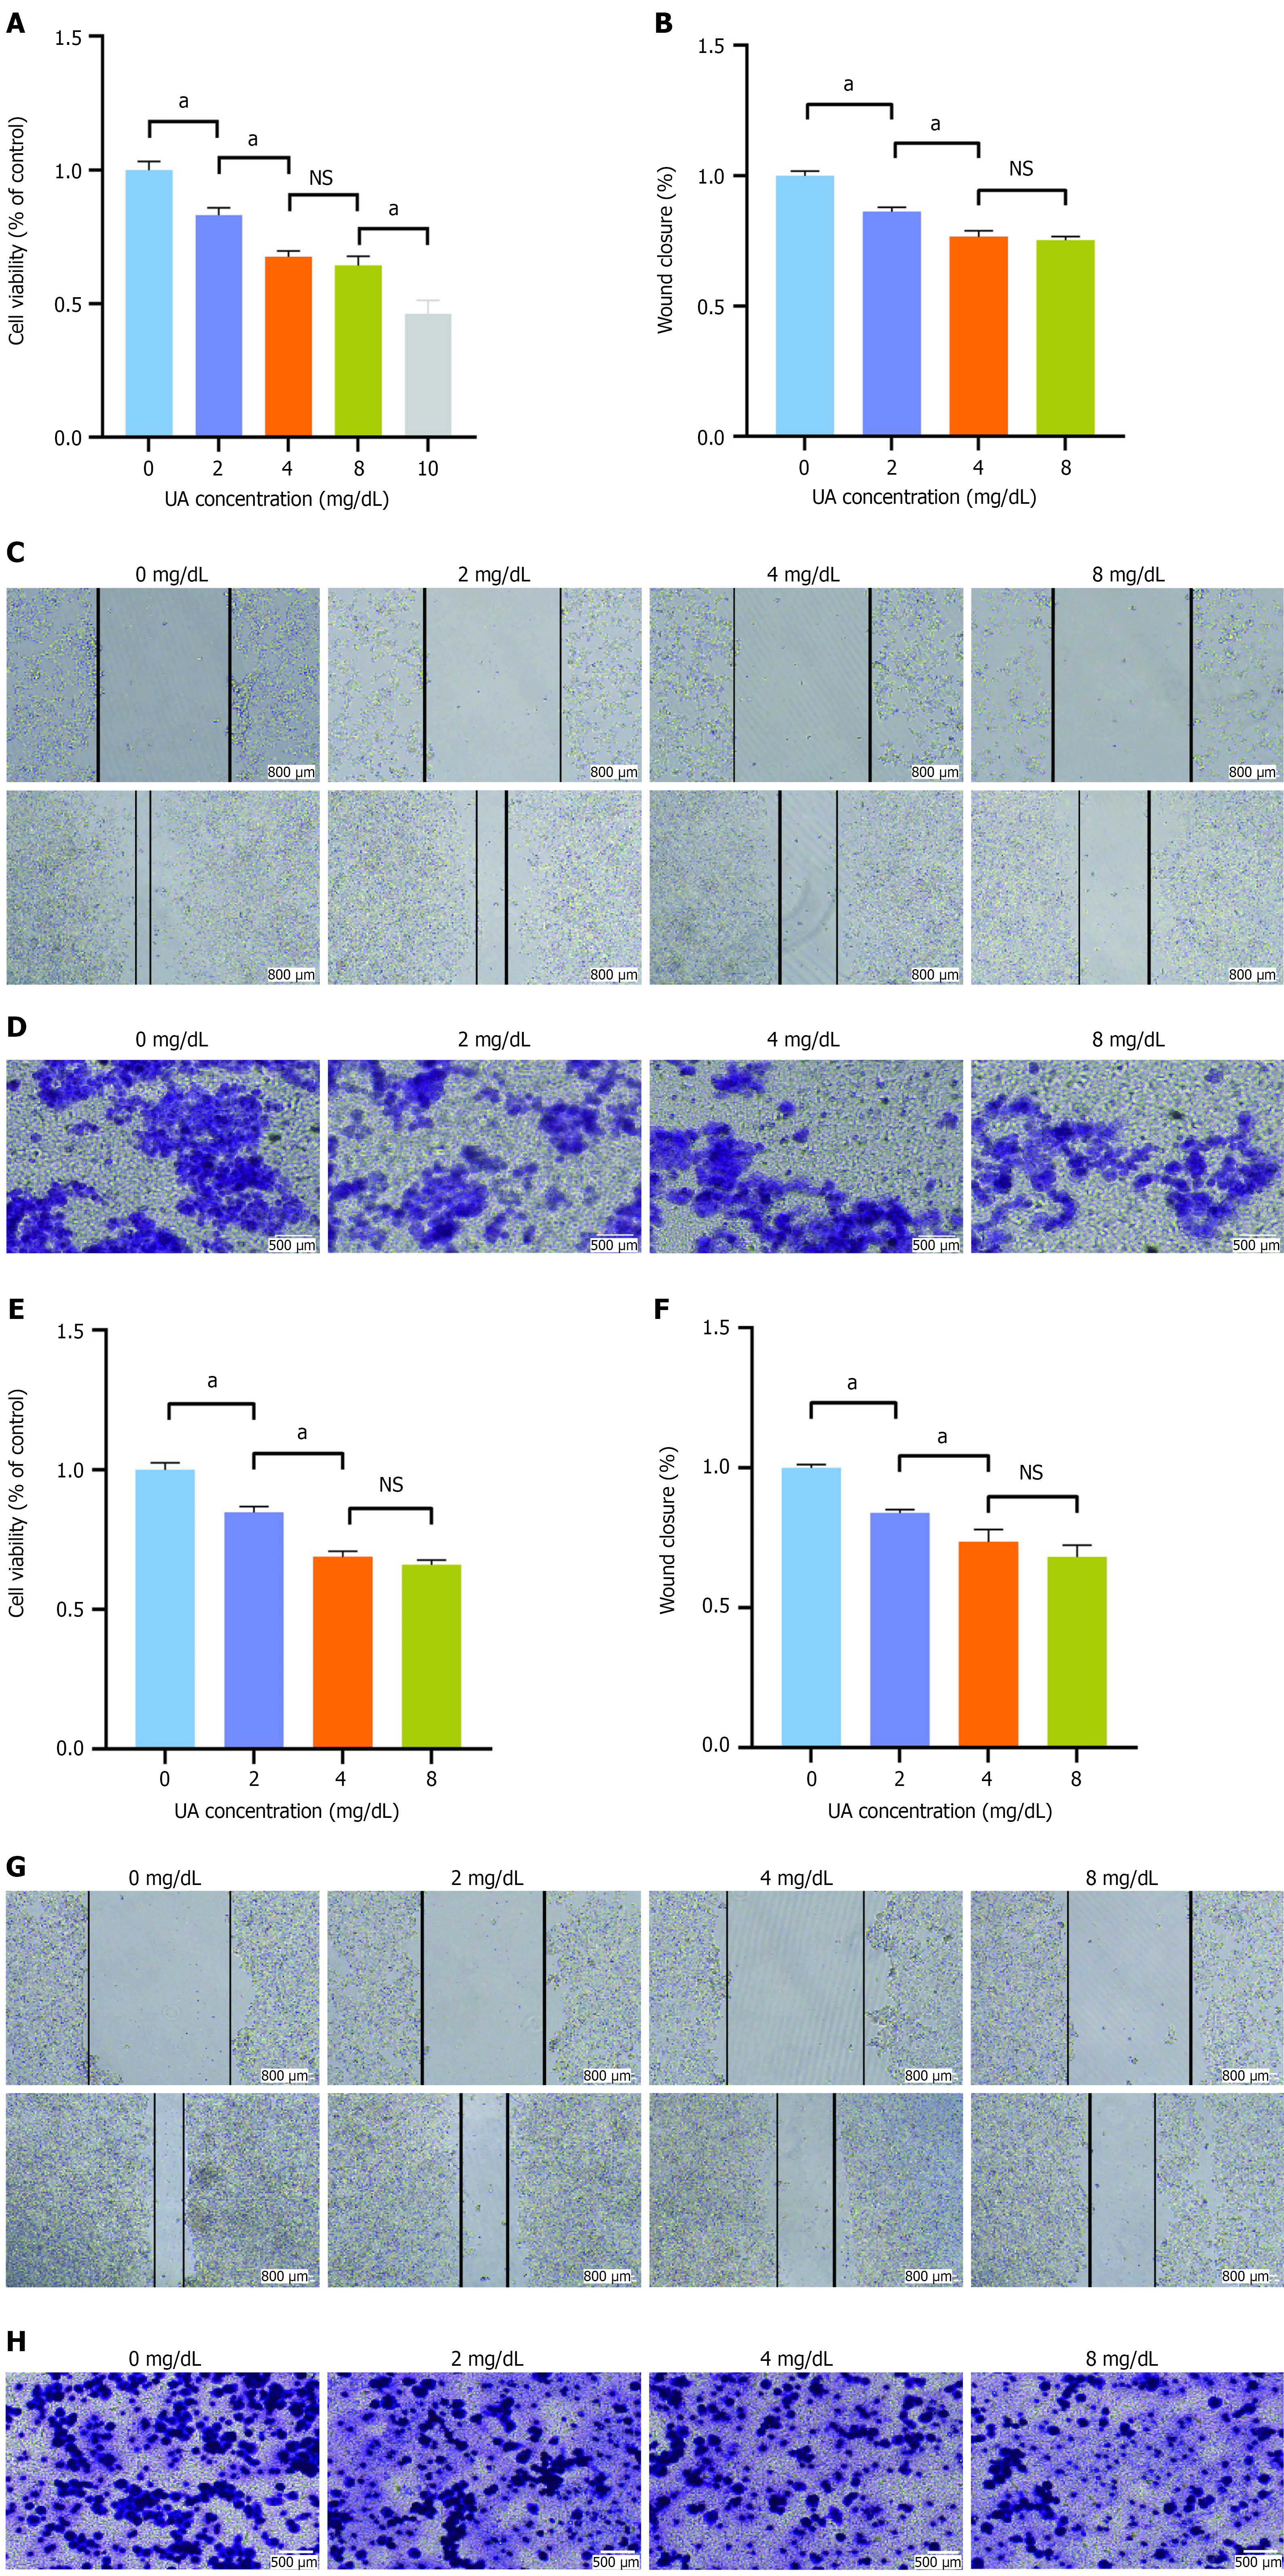
Figure 3 Effect of uric acid on the proliferation and migration of HCT-116 and HT29 cells.
A: Effect of uric acid (UA) on the proliferation of HCT-116 cells; B and C: Effect of UA on the migration of HCT-116 cells detected by wound assay; D: Effect of UA on the migration of HCT-116 cells detected by transwell assay; E: Effect of UA on the proliferation of HT29 cells; F and G: Effect of UA on the migration of HT29 cells detected by wound assay; H: Effect of UA on the migration of HT29 cells detected by transwell assay. aP < 0.05; NS: Not statistically significant. UA: Uric acid.
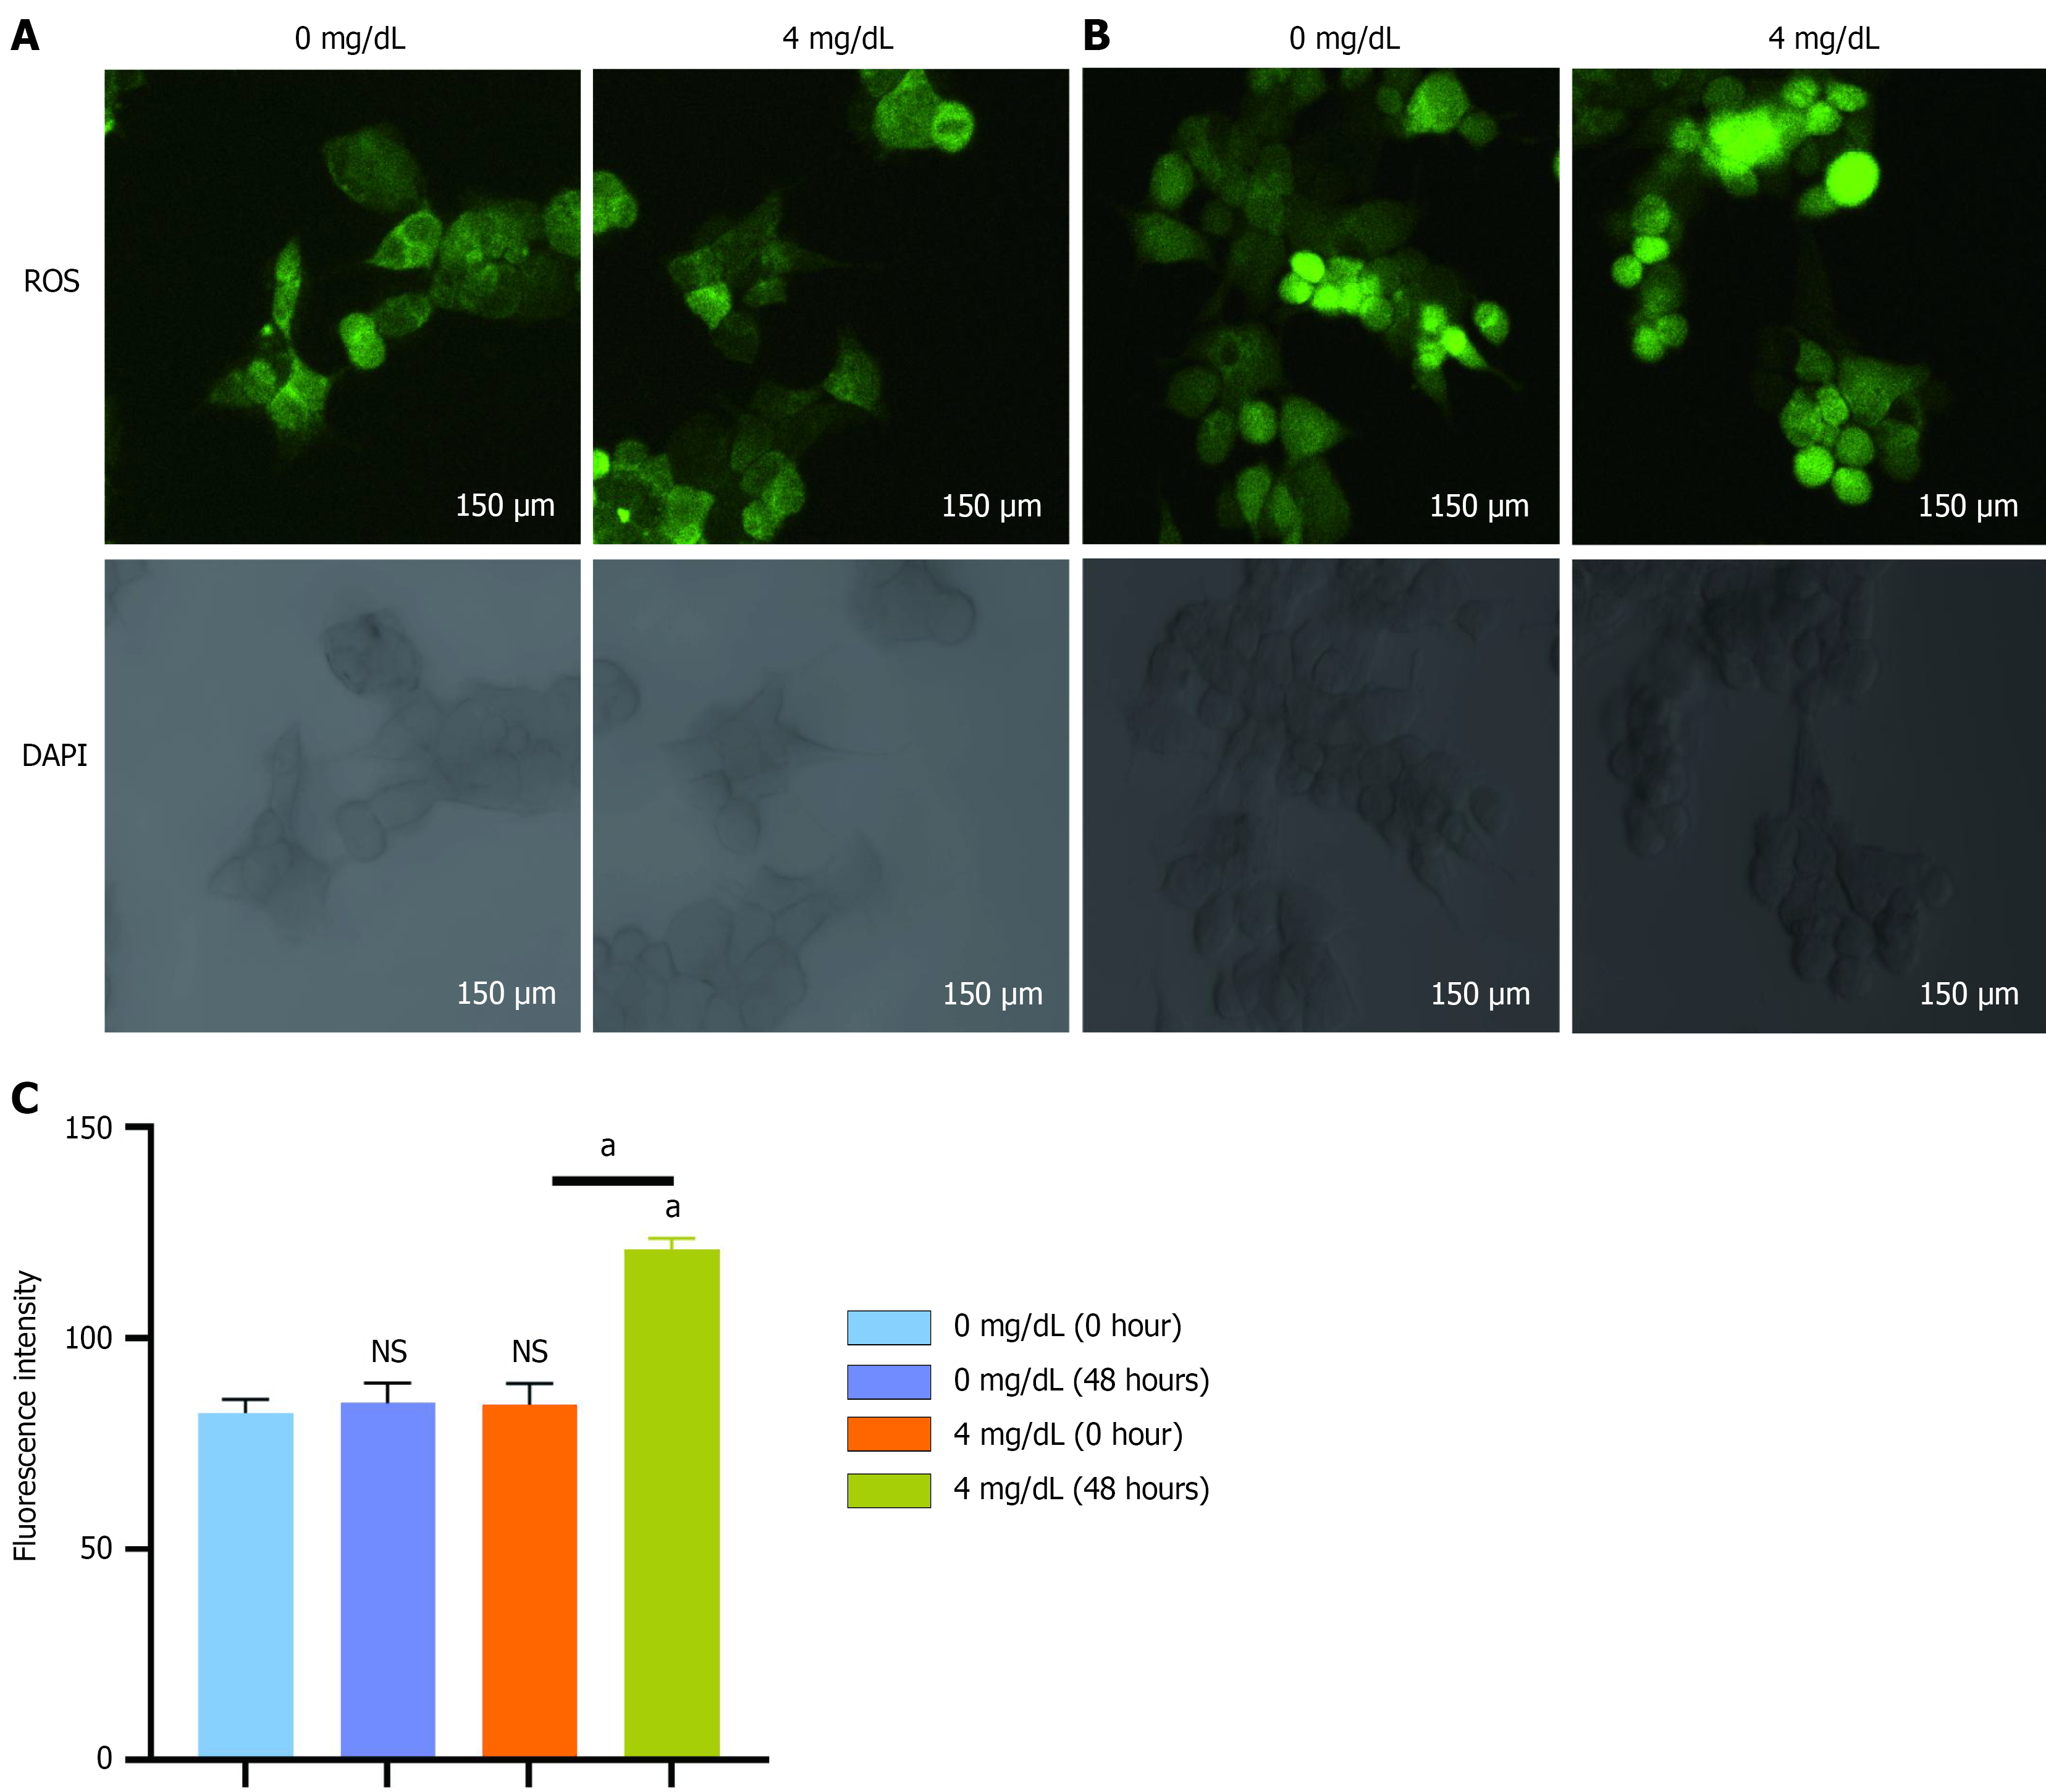
Figure 4 Effect of uric acid on reactive oxygen species in HCT-116 cells.
A: Reactive oxygen species (ROS) expression in HCT-116 cells before uric acid intervention; B: ROS expression in HCT-116 cells after uric acid intervention for 48 hours; C: Comparison of different groups of ROS expression. aP < 0.05 vs 0 mg/dL group or between groups; NS: Not statistically significant, compared with the 0 mg/dL group. ROS: Reactive oxygen species; DAPI: 4'-6-diamidino-2-phenylindole.
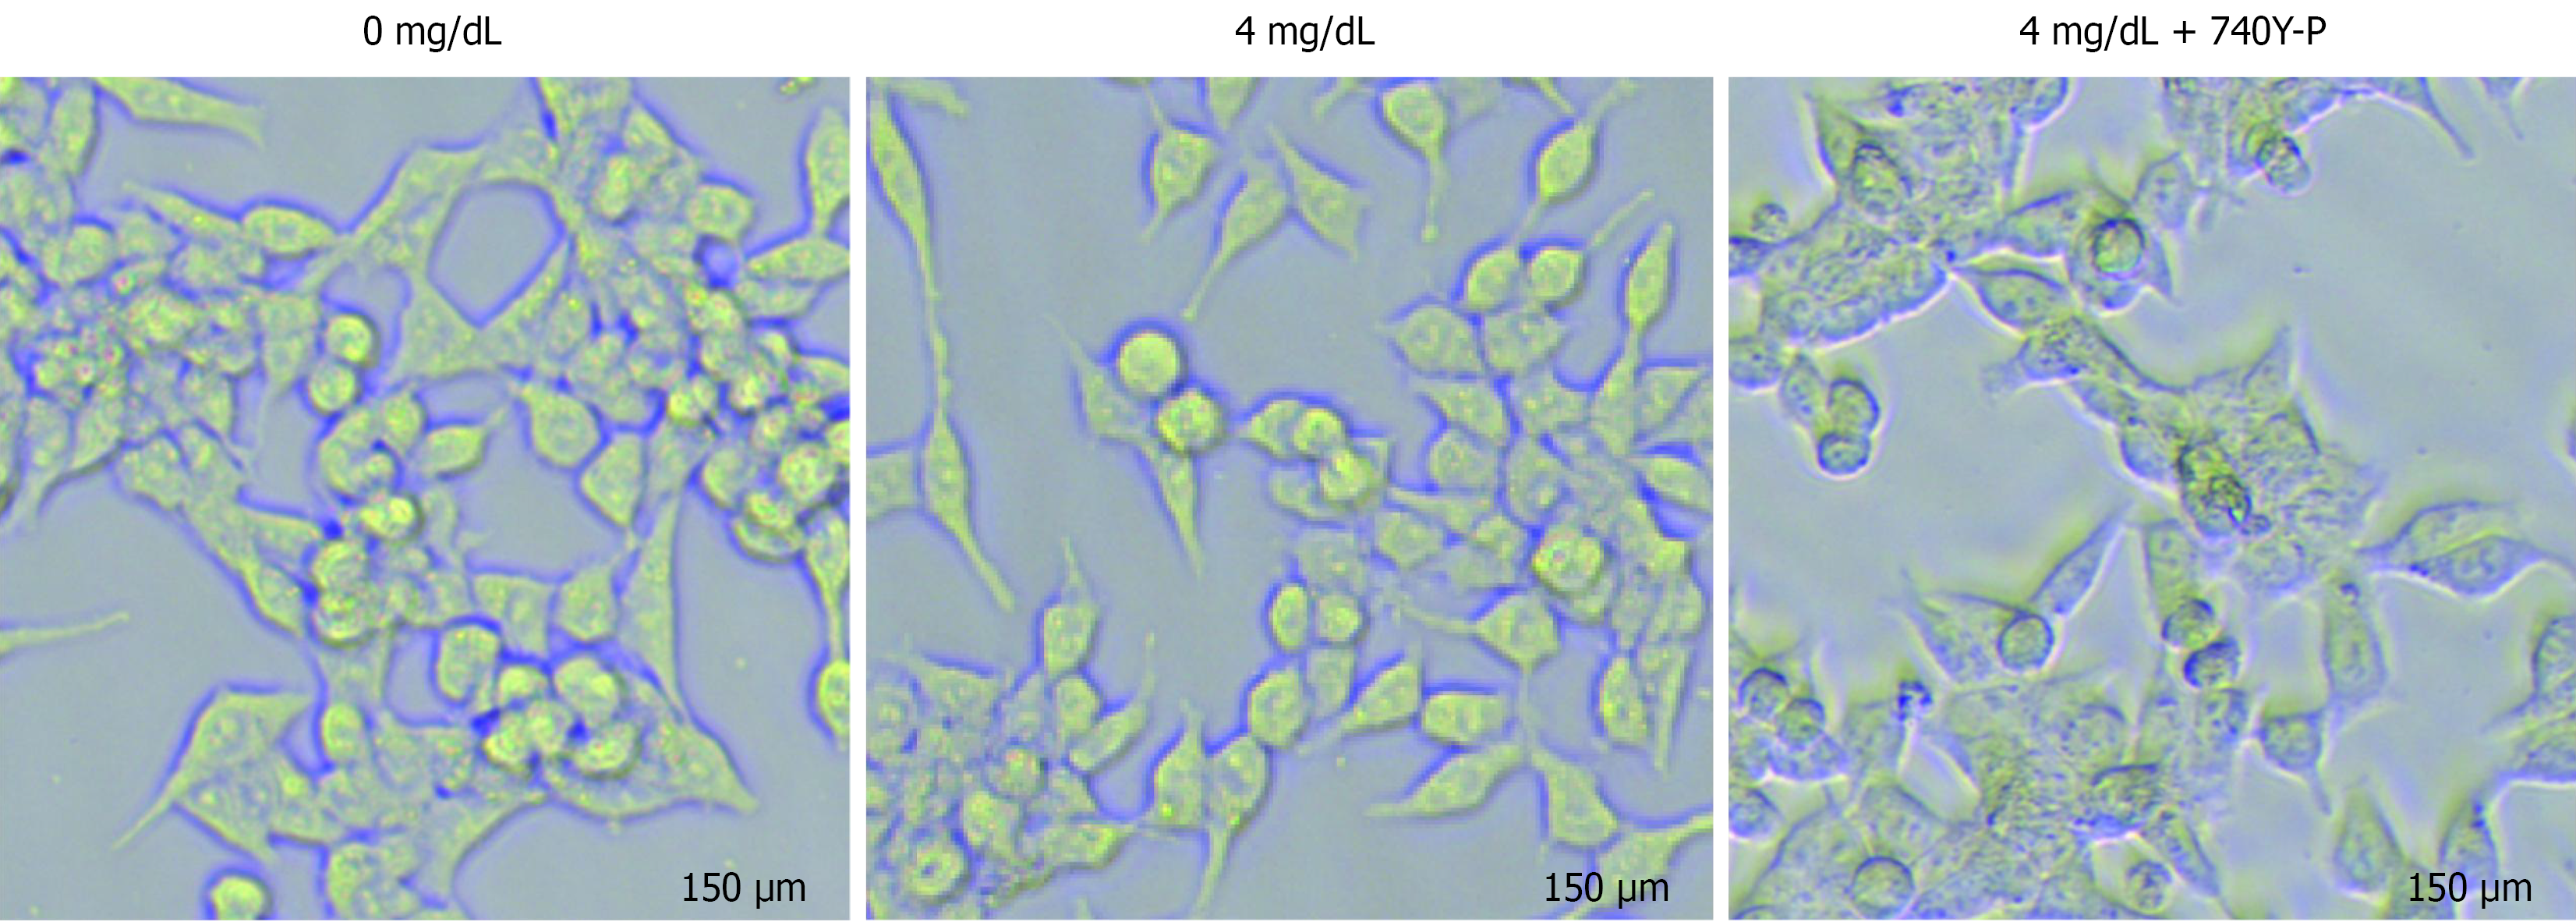
Figure 5
Cell morphology of HCT-116 cells after intervention with uric acid and 740Y-P.
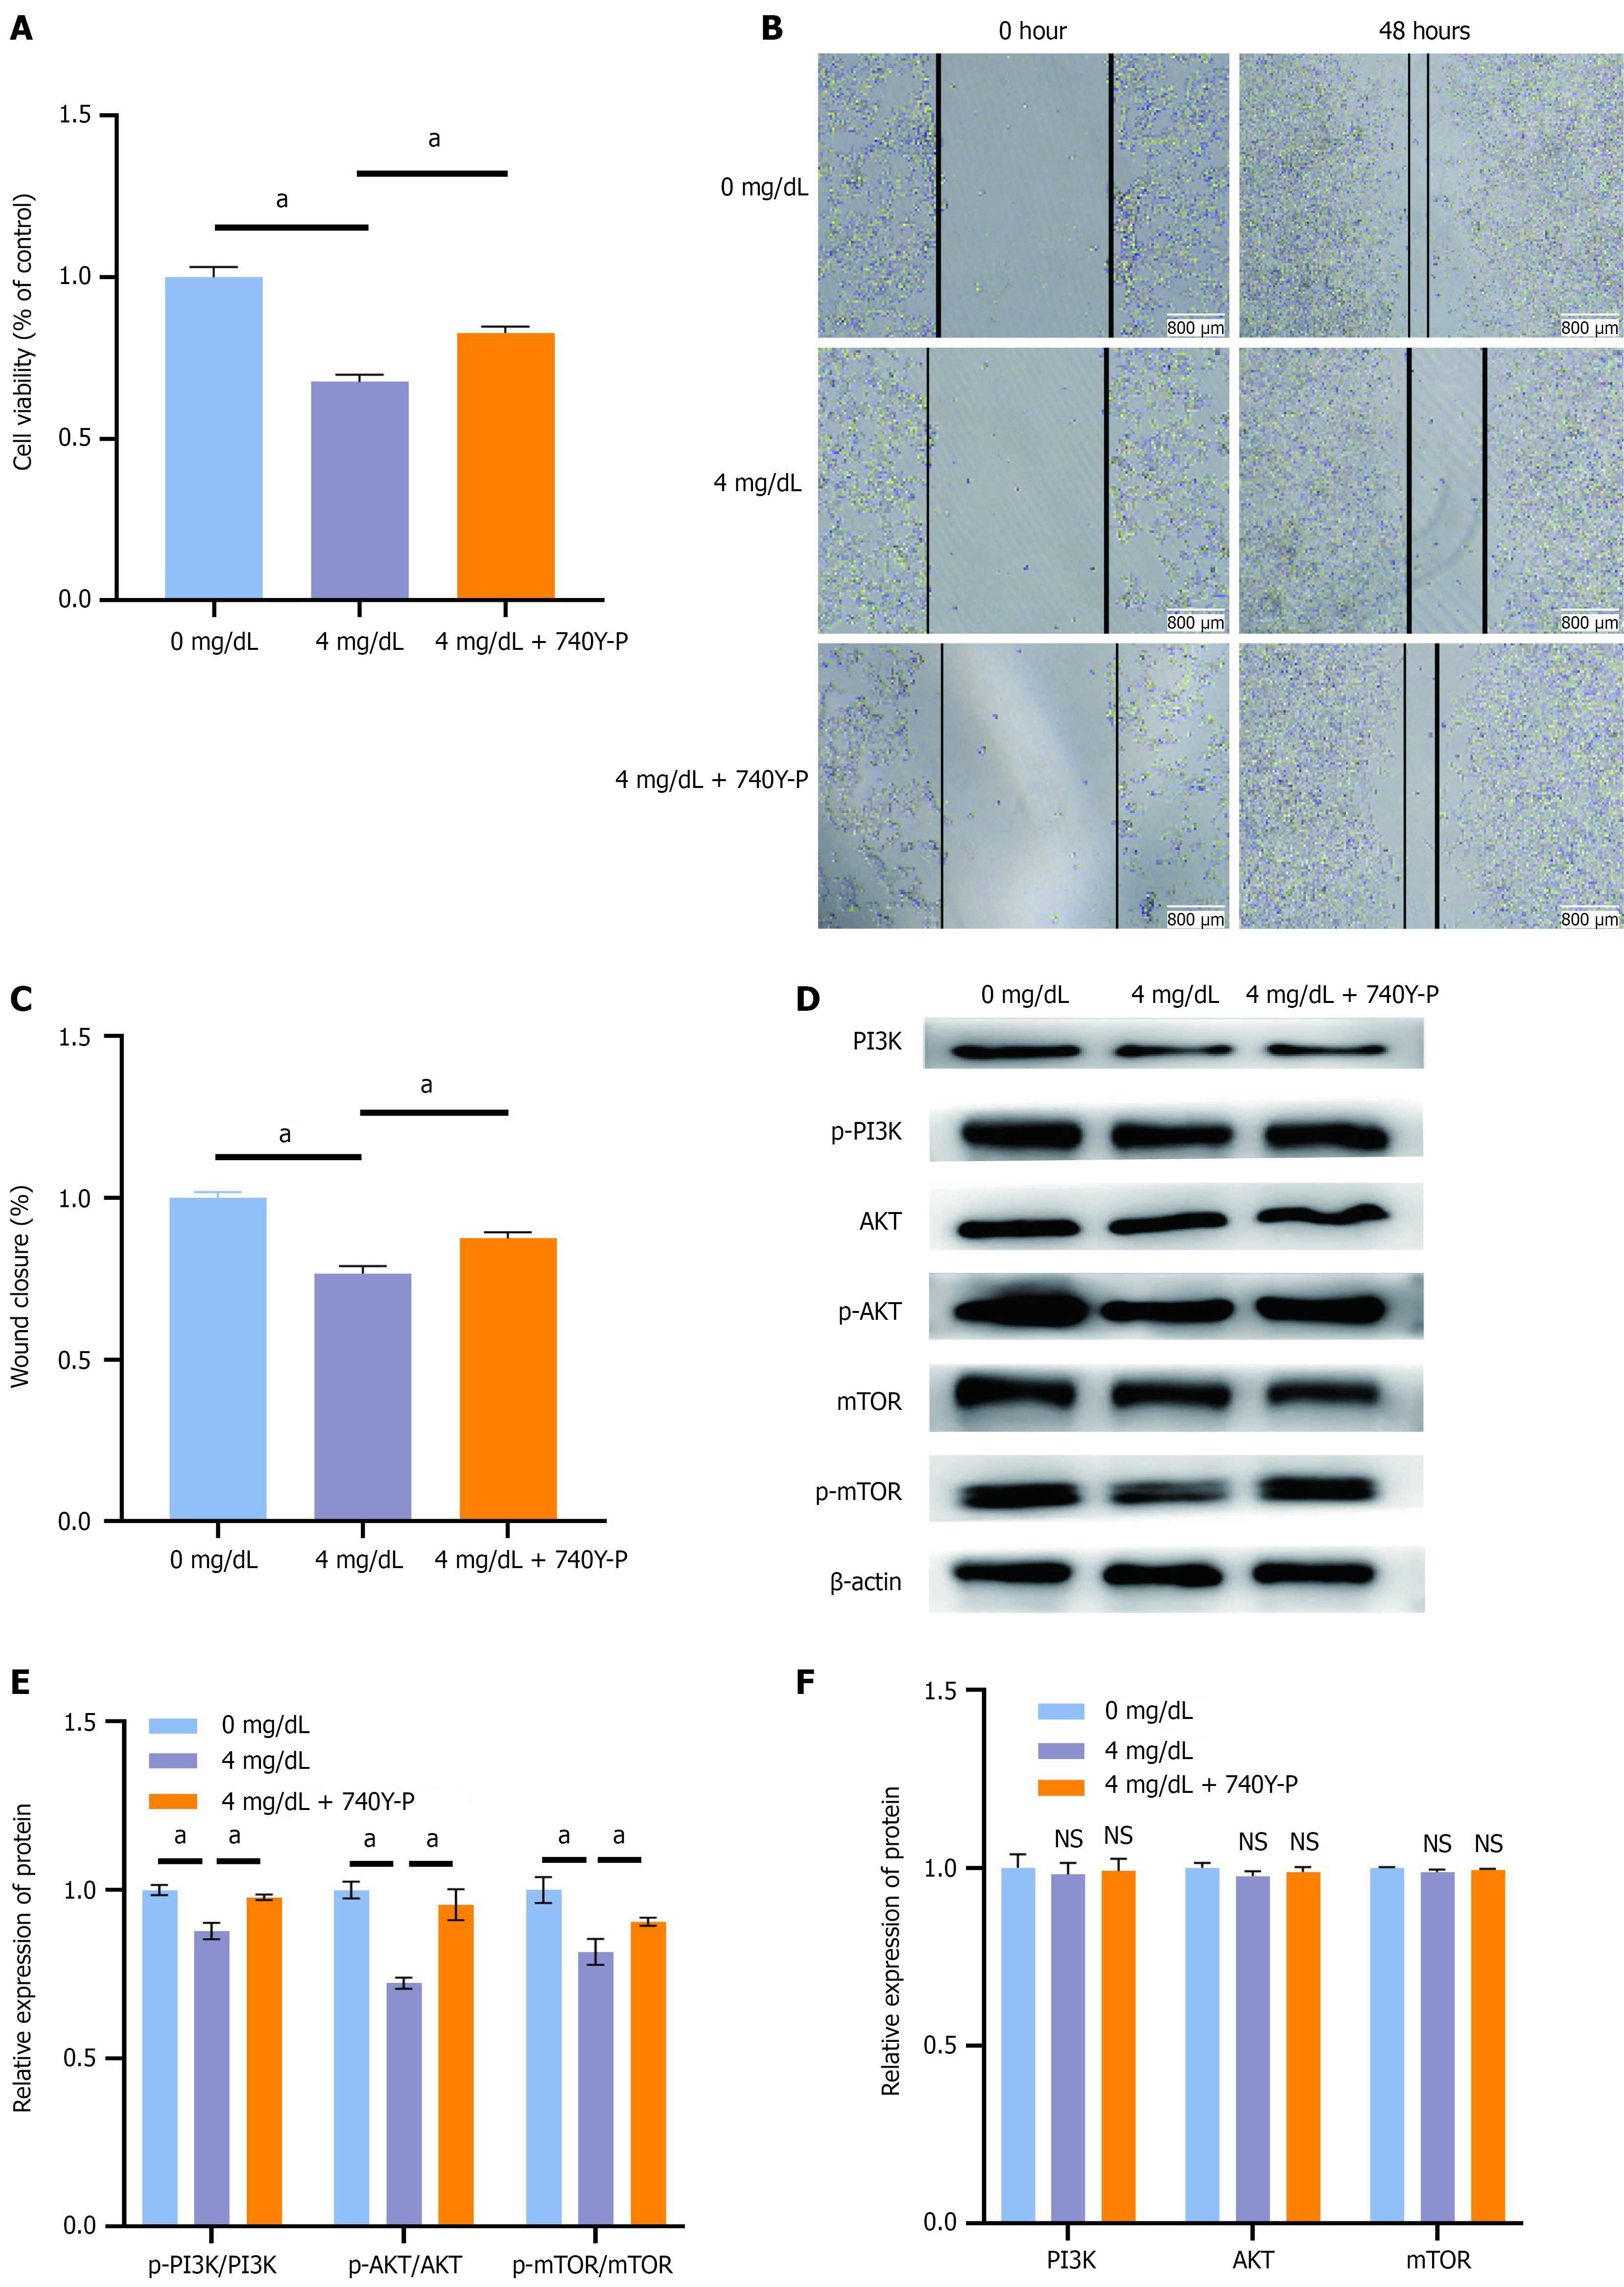
Figure 6 Effects of 740Y-P on the proliferation and migration of HCT-116 cells and the phosphoinositide 3-kinases/protein kinase B/mammalian target of rapamycin signaling pathway.
A: Effect of phosphoinositide 3-kinases activator 740Y-P on the proliferation of HCT-116 cells; B and C: Effect of 740Y-P on HCT-116 cell migration; D-F: Effect of 740Y-P on phosphoinositide 3-kinases/protein kinase B/mammalian target of rapamycin signaling pathway. aP < 0.05 vs 0 mg/dL group or between groups; NS: Not statistically significant vs 0 mg/dL group. PI3K: Phosphoinositide 3-kinases; p-PI3K: Phosphorylation-phosphoinositide 3-kinases; AKT: Protein kinase B; p-AKT: Phosphorylation-protein kinase B; mTOR: Mammalian target of rapamycin; p-mTOR: Phosphorylation-mammalian target of rapamycin.
- Citation: Sun TF, Fan KX, Luo YX, Song J, Han ZX, Zhang XL. Relationship between uric acid and colon cancer risk: Dose-response analysis and mechanisms. World J Gastrointest Oncol 2025; 17(9): 107651
- URL: https://www.wjgnet.com/1948-5204/full/v17/i9/107651.htm
- DOI: https://dx.doi.org/10.4251/wjgo.v17.i9.107651


