©The Author(s) 2025.
World J Gastrointest Oncol. Feb 15, 2025; 17(2): 95423
Published online Feb 15, 2025. doi: 10.4251/wjgo.v17.i2.95423
Published online Feb 15, 2025. doi: 10.4251/wjgo.v17.i2.95423
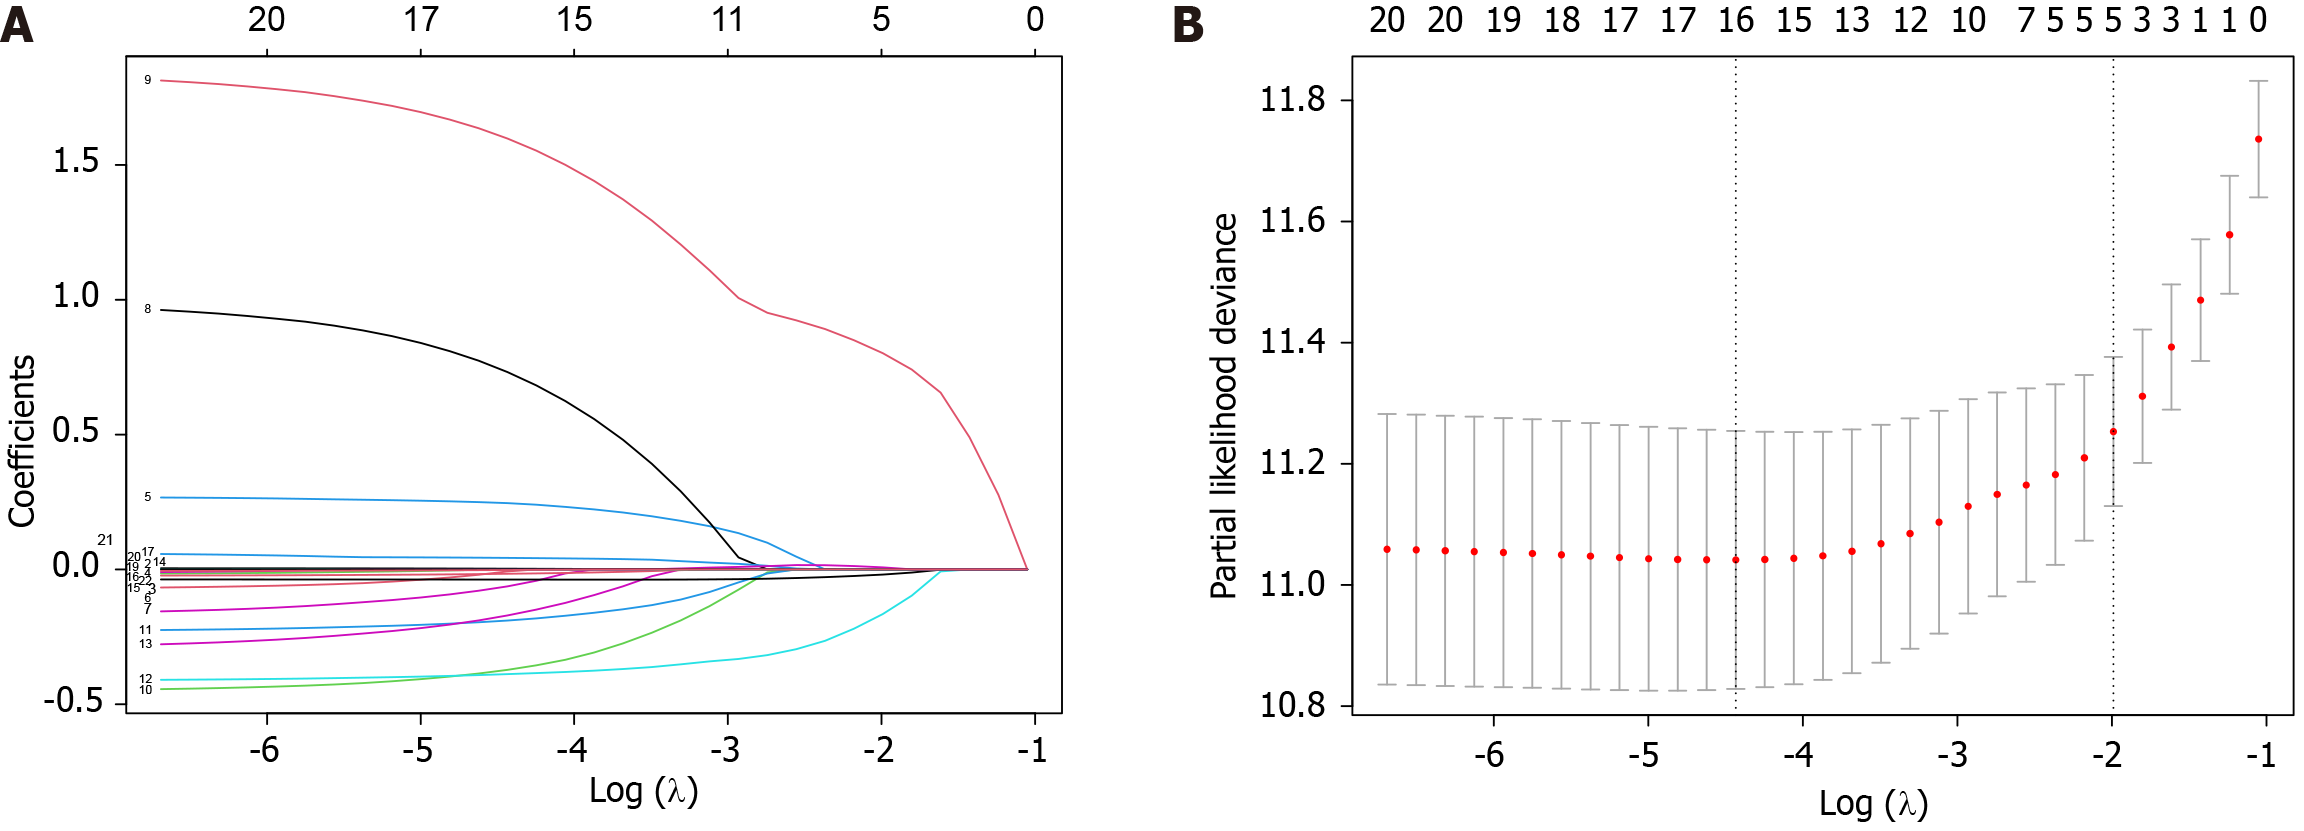
Figure 1 Clinical predictor selection via least absolute shrinkage and selection operator Cox regression with 10-fold cross-validation.
A: Plot of the least absolute shrinkage and selection operator (LASSO) coefficient distribution for 20 risk factors; B: LASSO regression cross-validation graph.
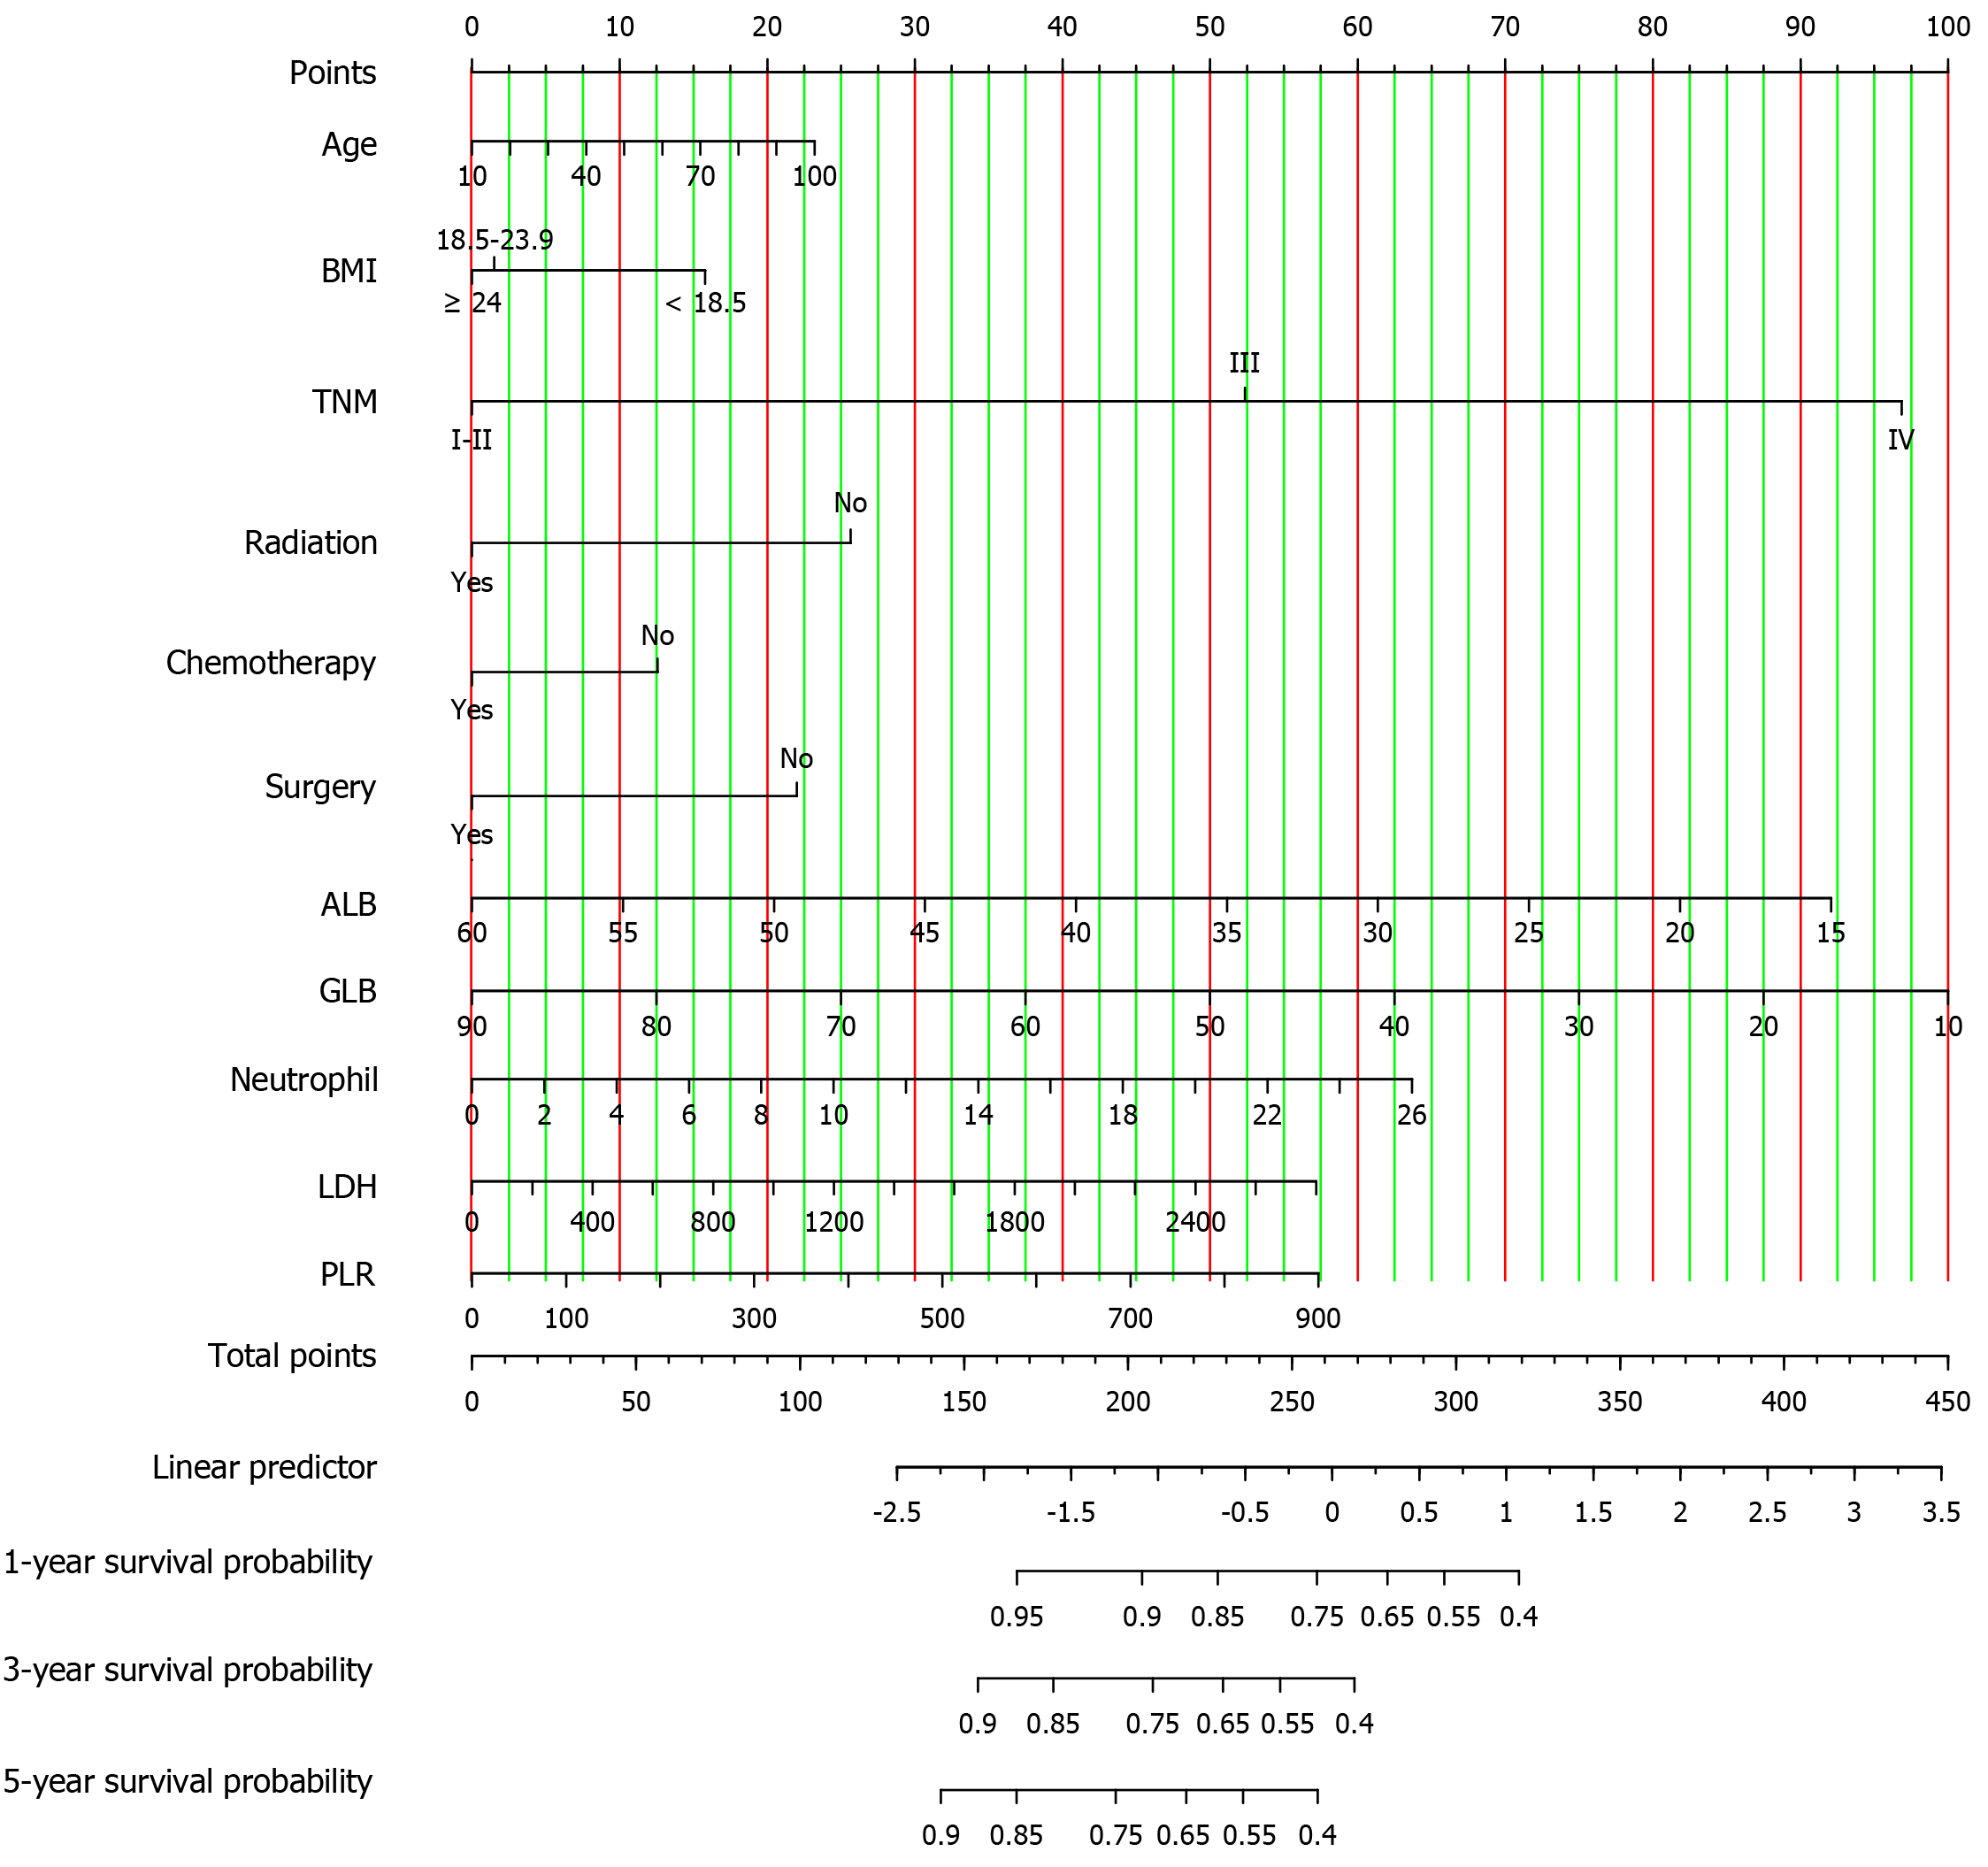
Figure 2 The nomogram model illustrates the overall survival of gastric cancer patients in the training set.
BMI: Body mass index; TNM: Tumor-node-metastasis; ALB: Albumin; GLB: Globulin; LDH: Lactate dehydrogenase; PLR: Platelet-lymphocyte ratio.
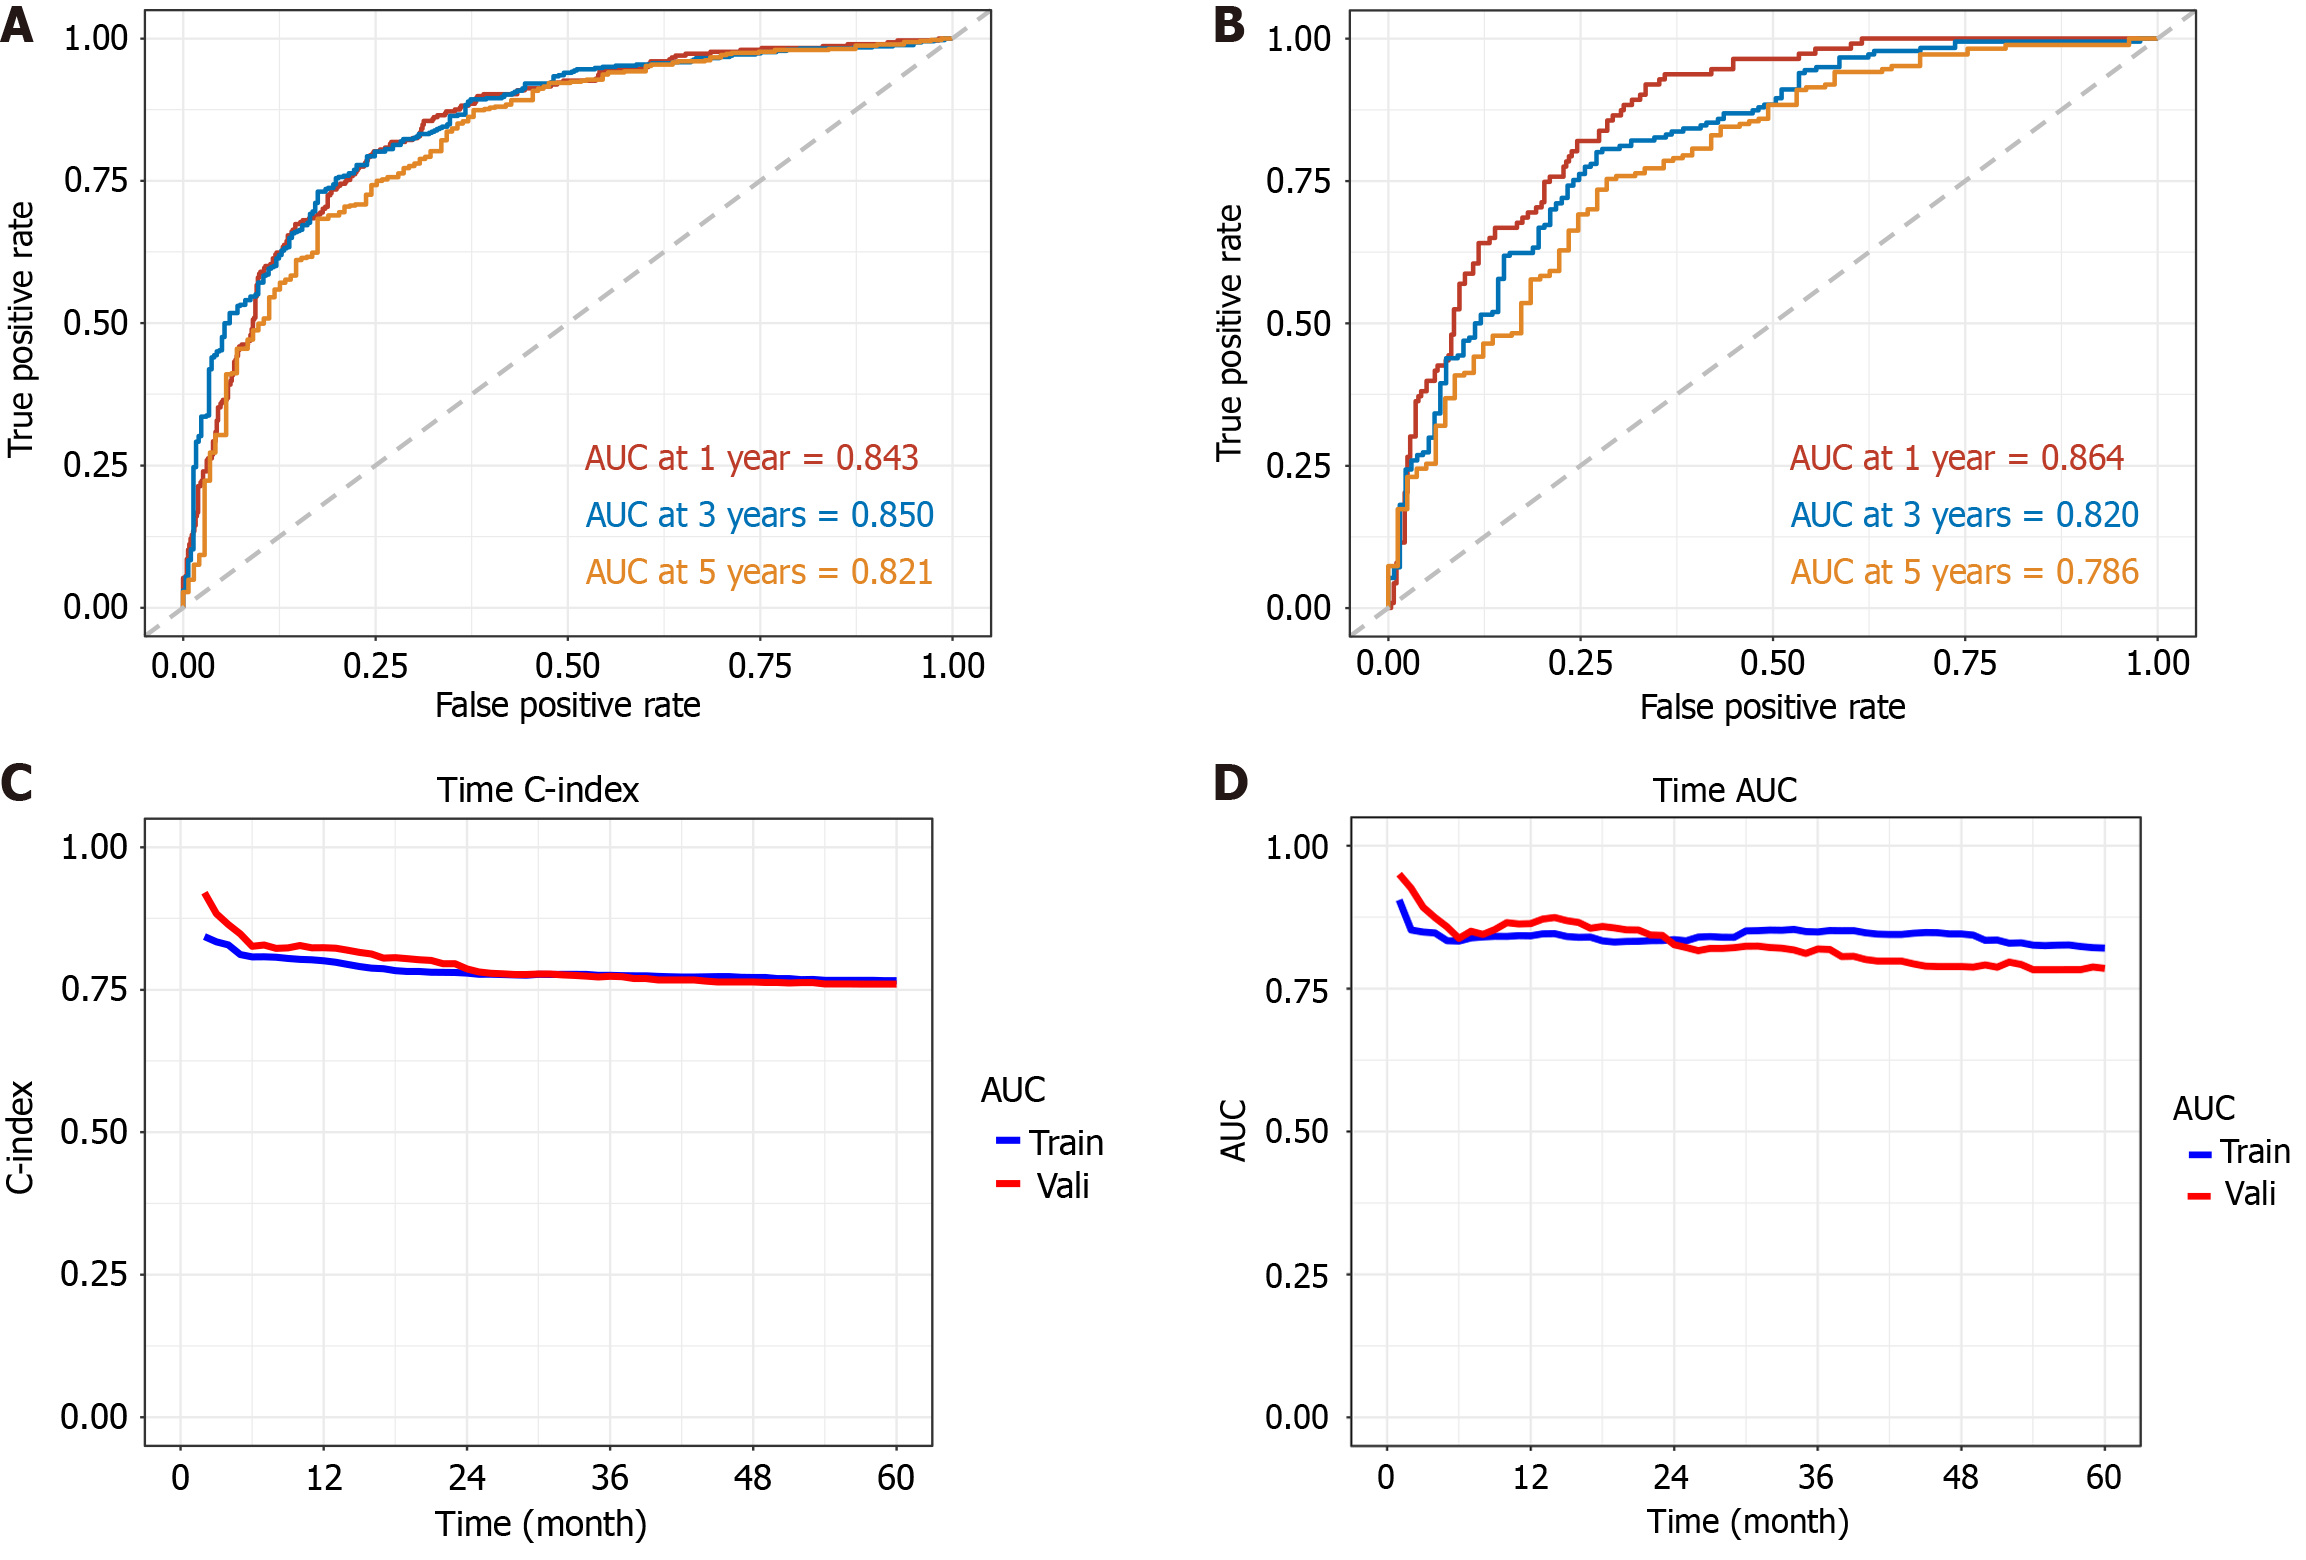
Figure 3 The model's receiver operating characteristic curves and area under the curve results.
A: Receiver operating characteristic (ROC) curve for the training set; B: ROC curve for the validation set; C: Time area under the curve of the model; D: Time C index of the model. AUC: Area under the curve.
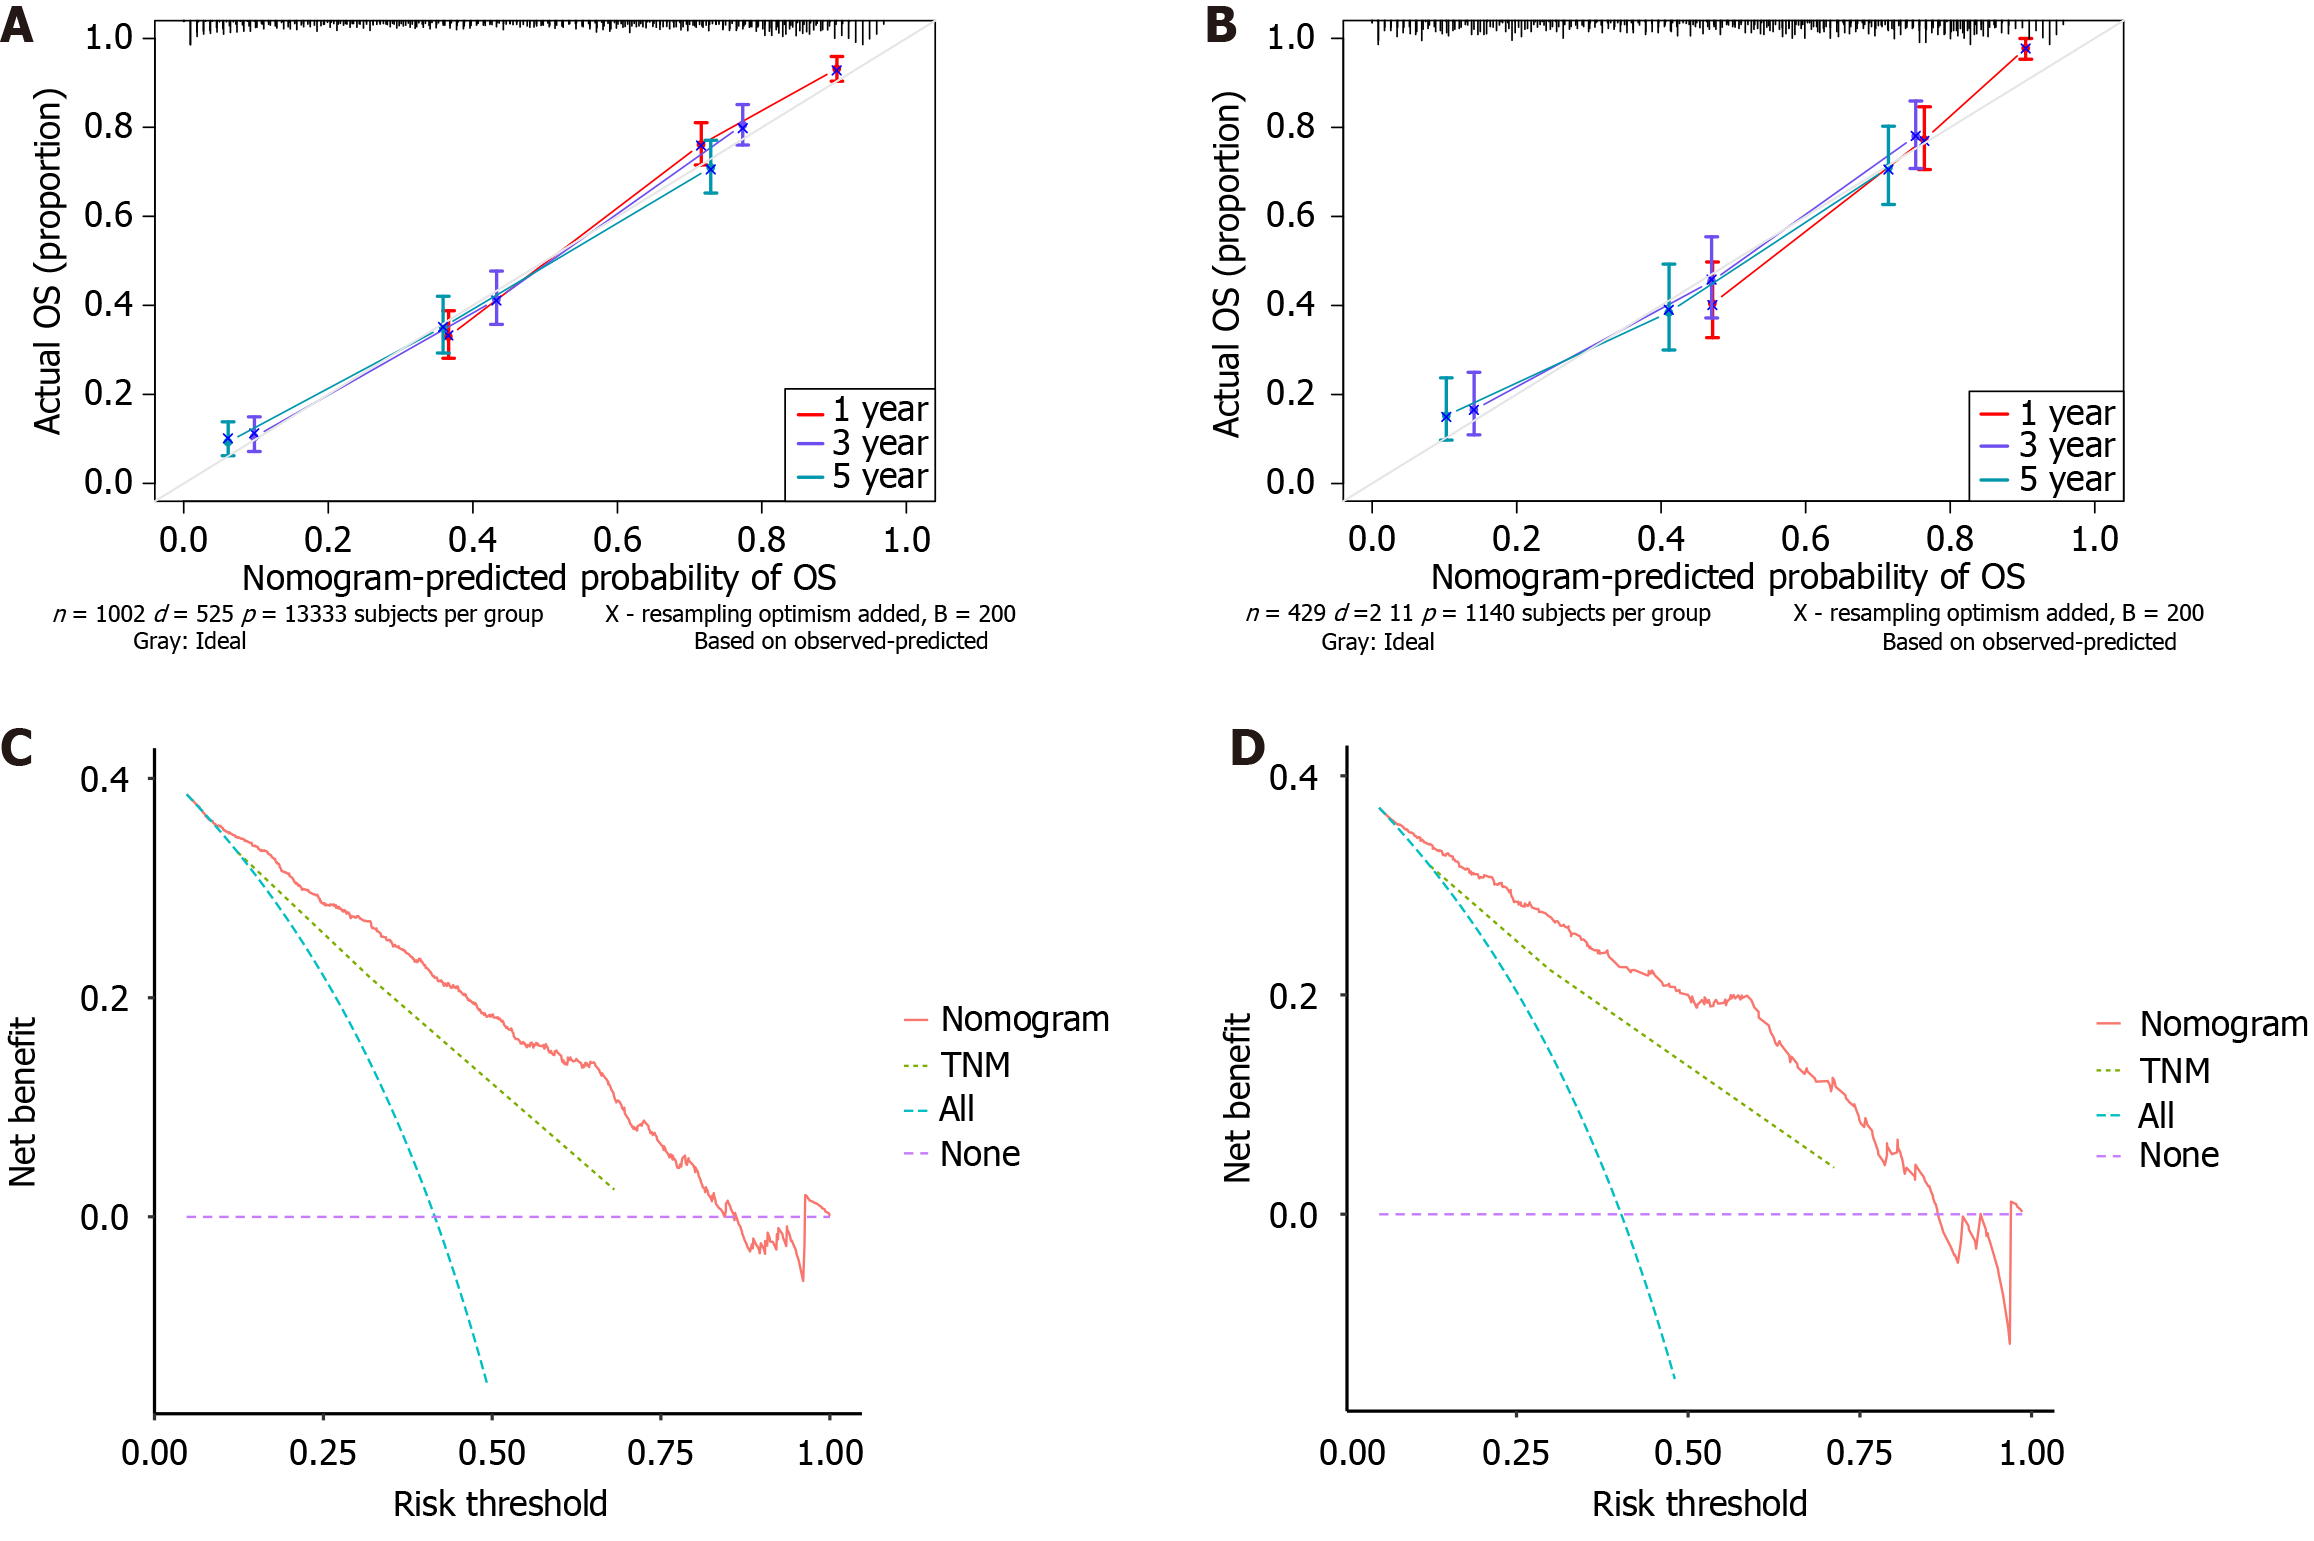
Figure 4 Calibration curve and decision curve analysis curve of the model.
A: Calibration curve for the training set; B: Calibration curve for the validation set; C: Decision curve analysis (DCA) curve for the training set; D: DCA curve for the validation set. OS: Overall survival; TNM: Tumor-node-metastasis.
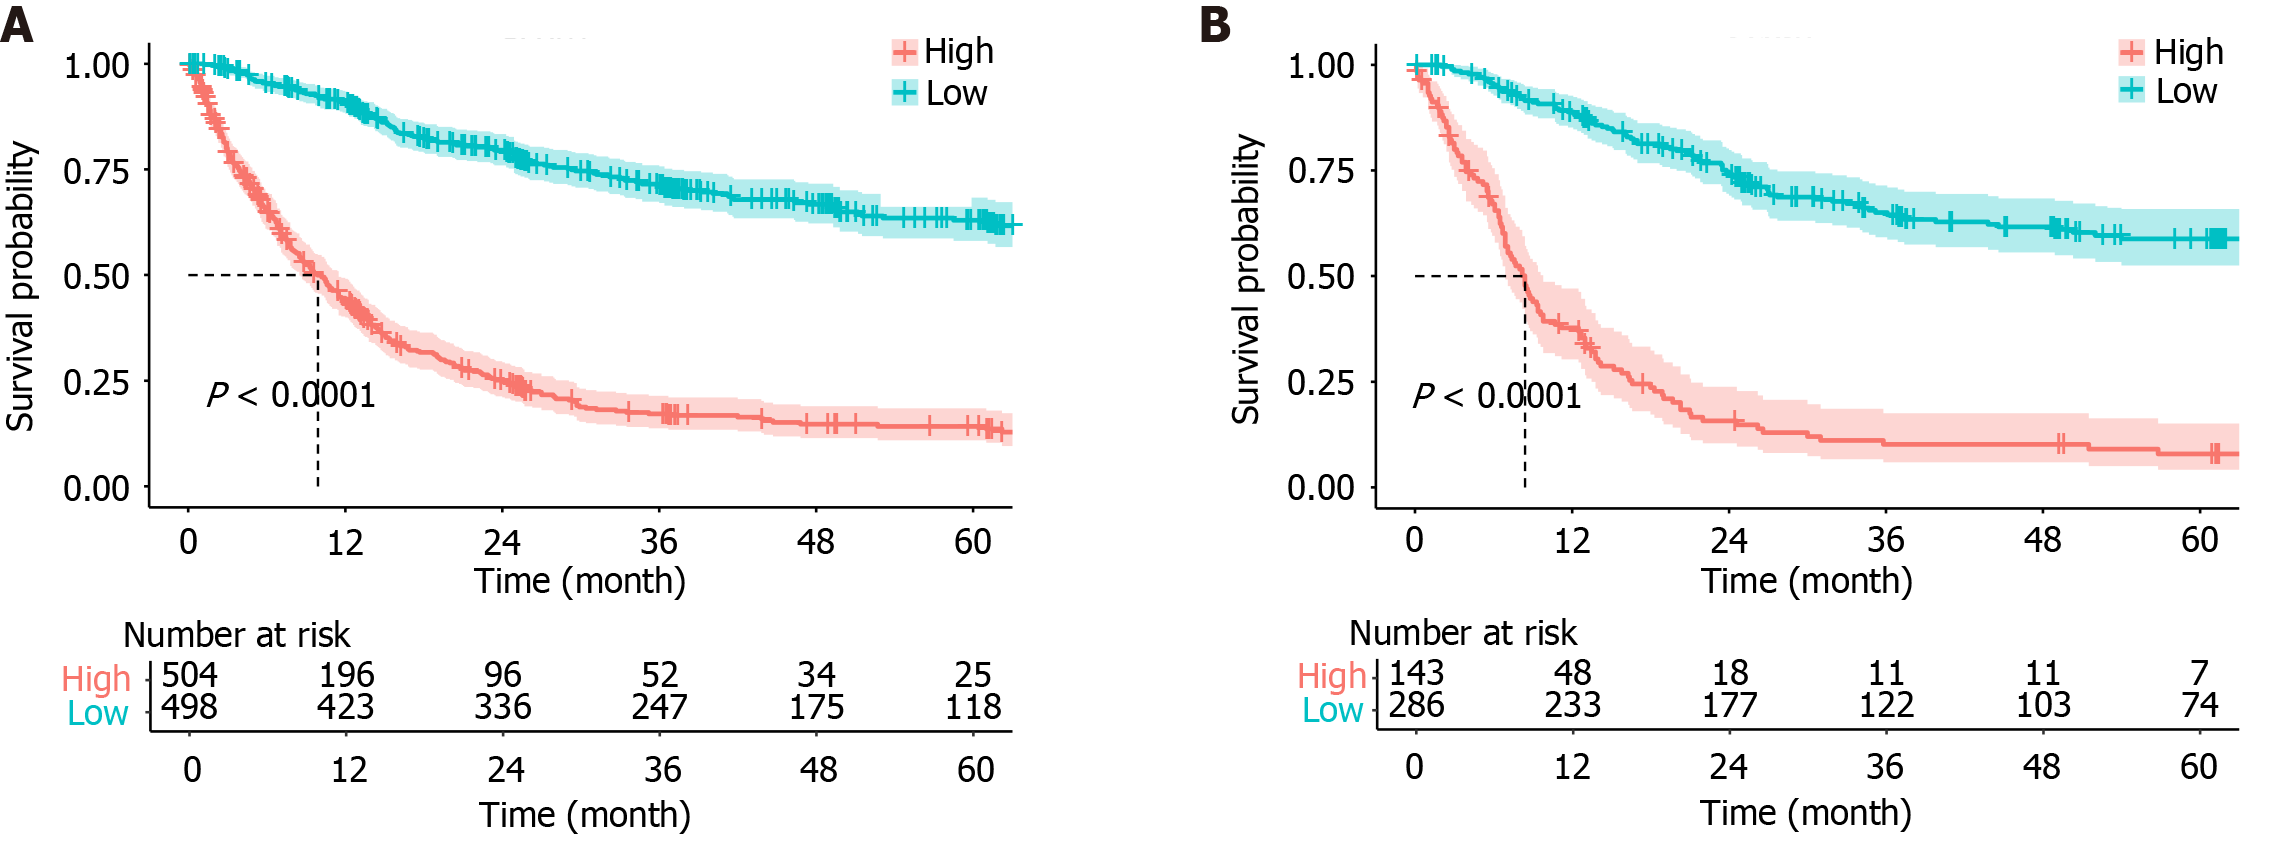
Figure 5 Survival analysis of high- and low-risk populations.
A: Training set; B: Validation set.
- Citation: Liang GZ, Li XS, Hu ZH, Xu QJ, Wu F, Wu XL, Lei HK. Development and validation of a nomogram model for predicting overall survival in patients with gastric carcinoma. World J Gastrointest Oncol 2025; 17(2): 95423
- URL: https://www.wjgnet.com/1948-5204/full/v17/i2/95423.htm
- DOI: https://dx.doi.org/10.4251/wjgo.v17.i2.95423


