Copyright
©The Author(s) 2025.
World J Gastrointest Oncol. Nov 15, 2025; 17(11): 113048
Published online Nov 15, 2025. doi: 10.4251/wjgo.v17.i11.113048
Published online Nov 15, 2025. doi: 10.4251/wjgo.v17.i11.113048
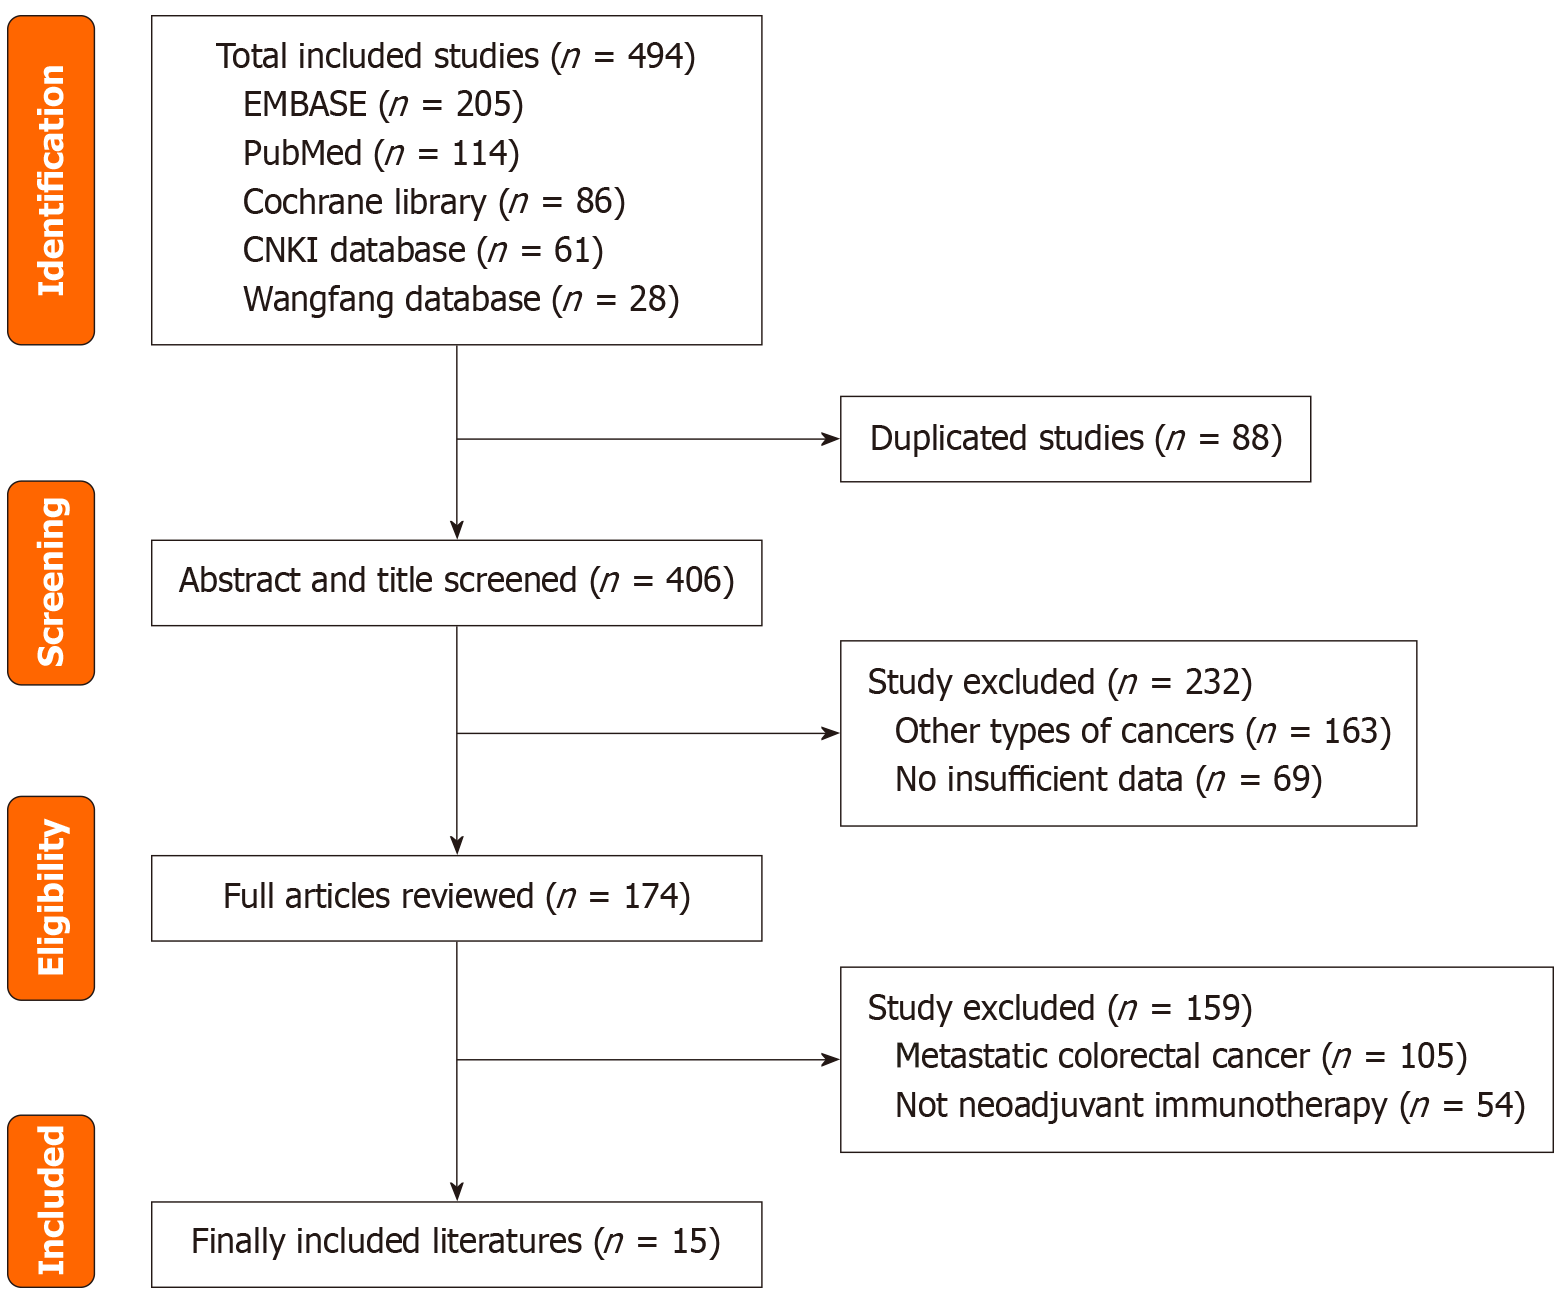
Figure 1
Study selection based on PRISMA criteria.
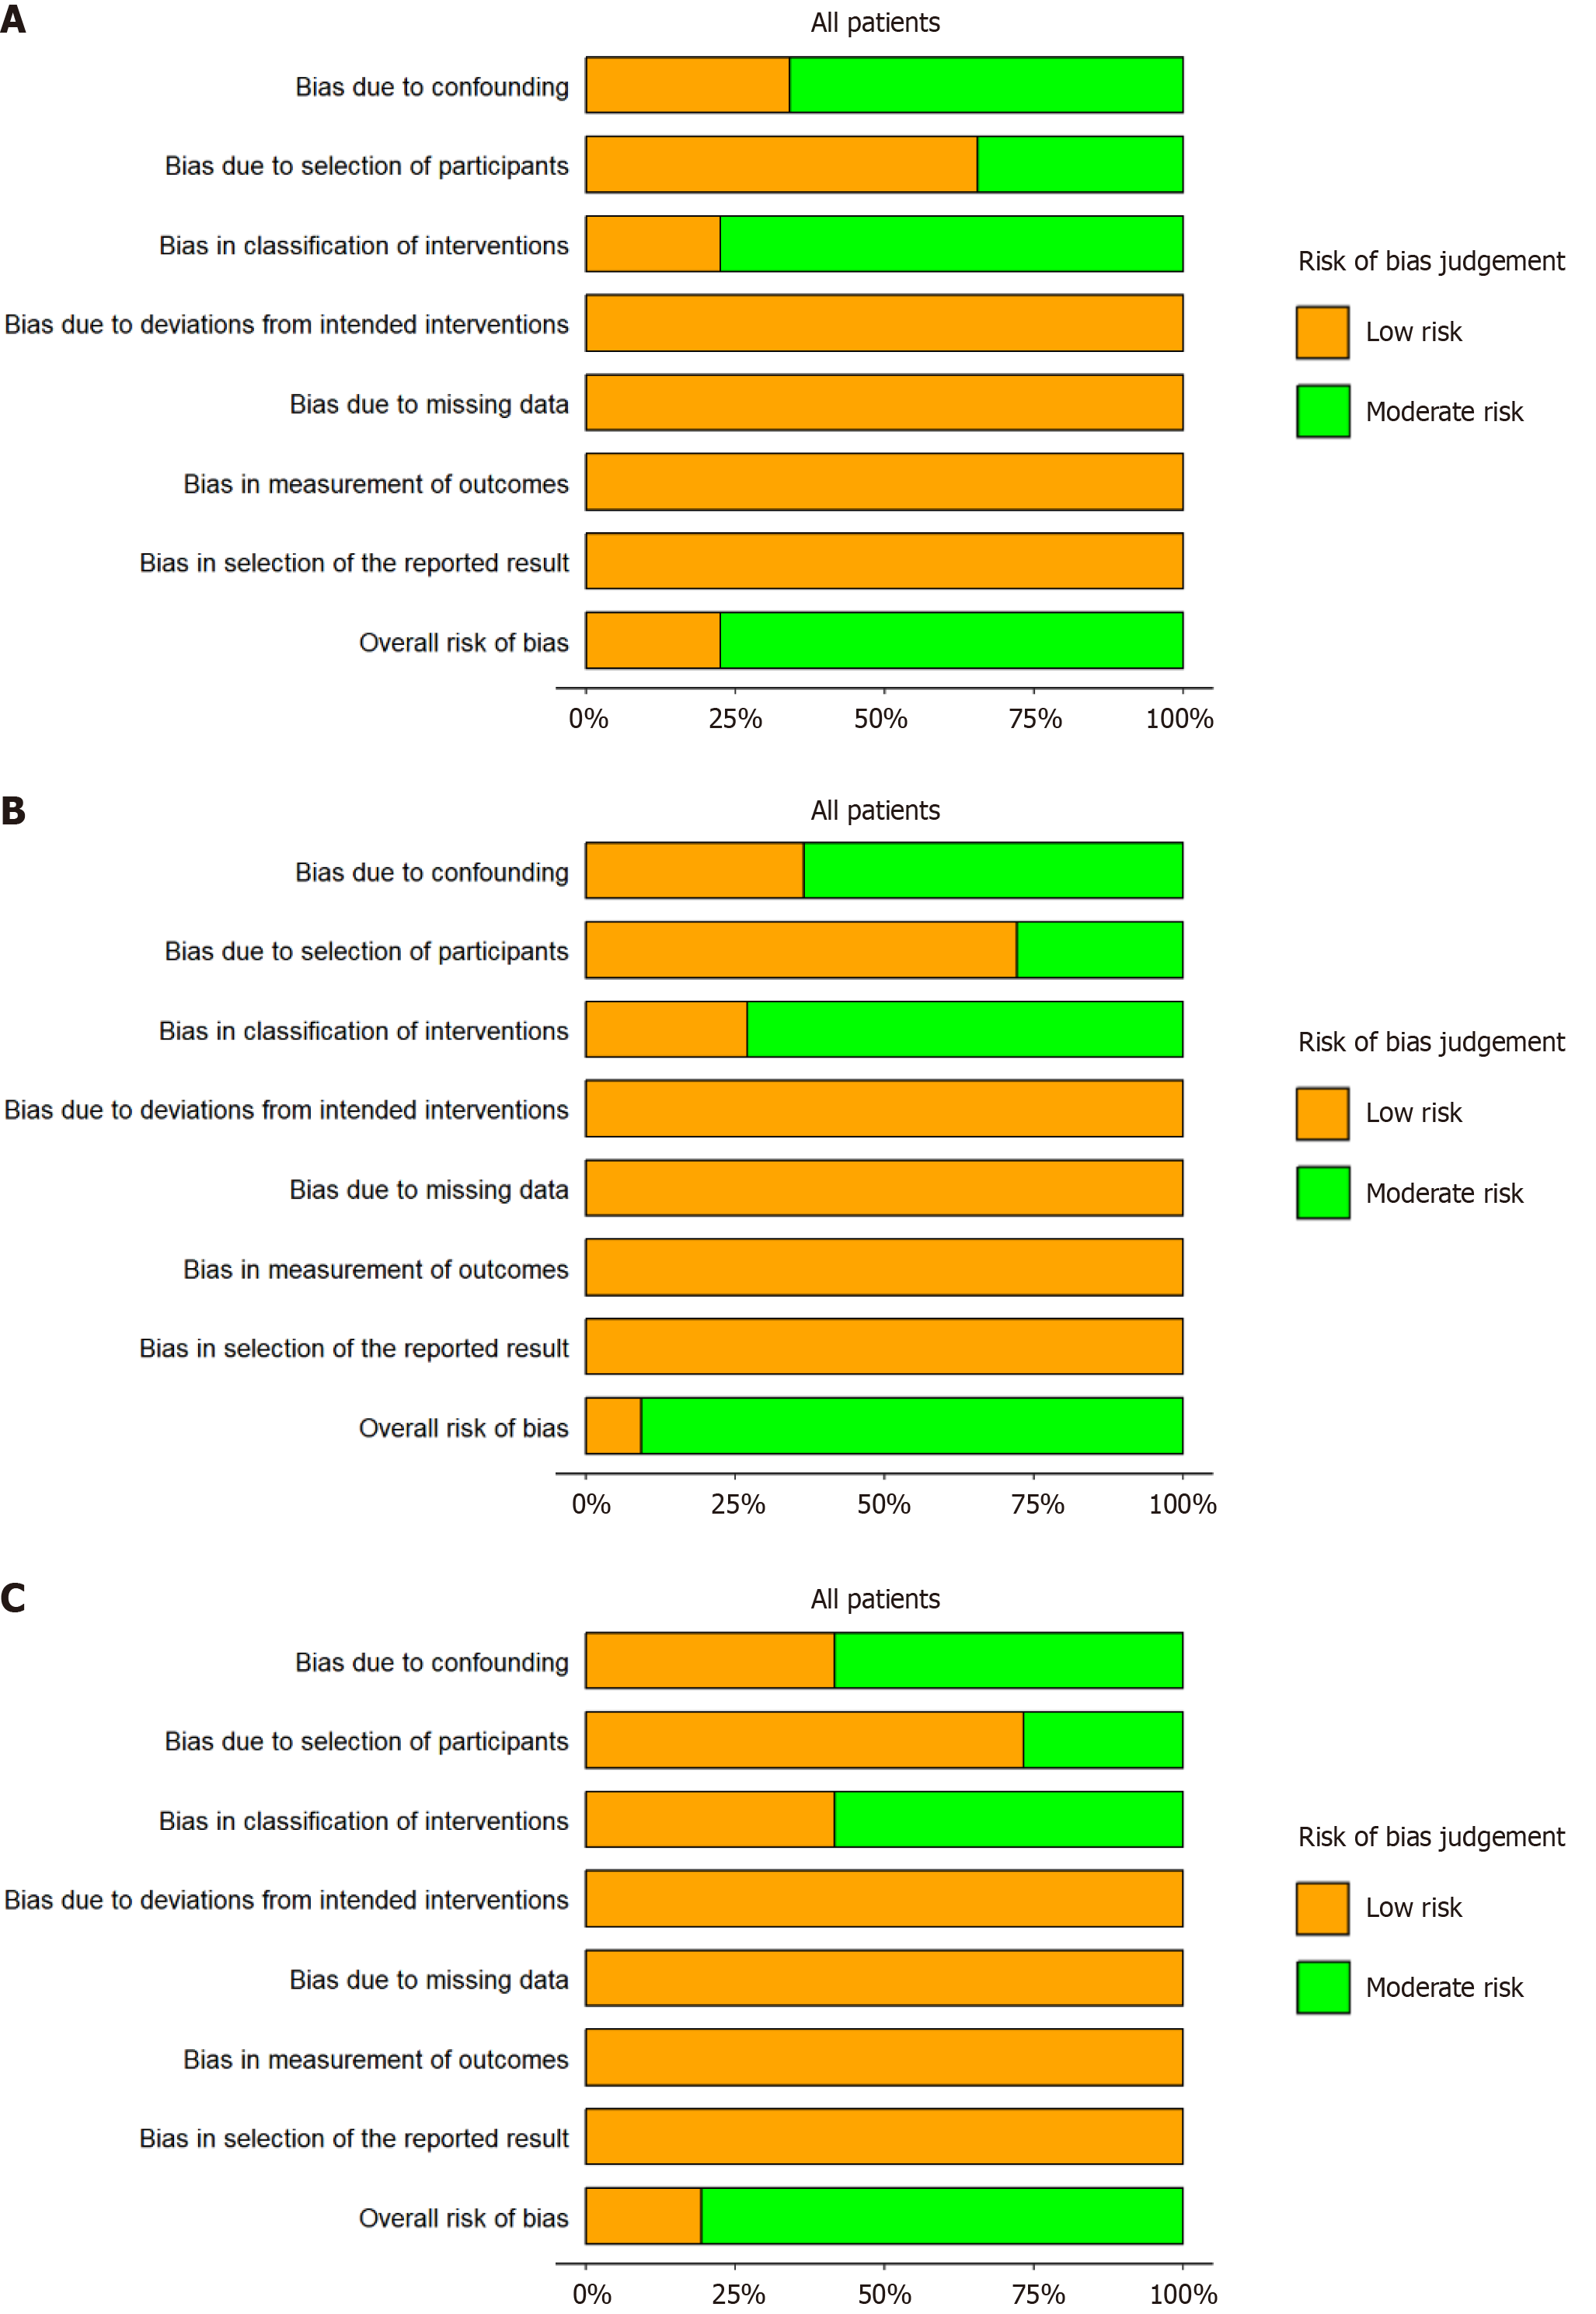
Figure 2 Risk of bias (ROBINS-I) in assessment of major pathological response, pathological complete response, and clinical complete response.
A: Major pathological response; B: Pathological complete response; C: Clinical complete response.
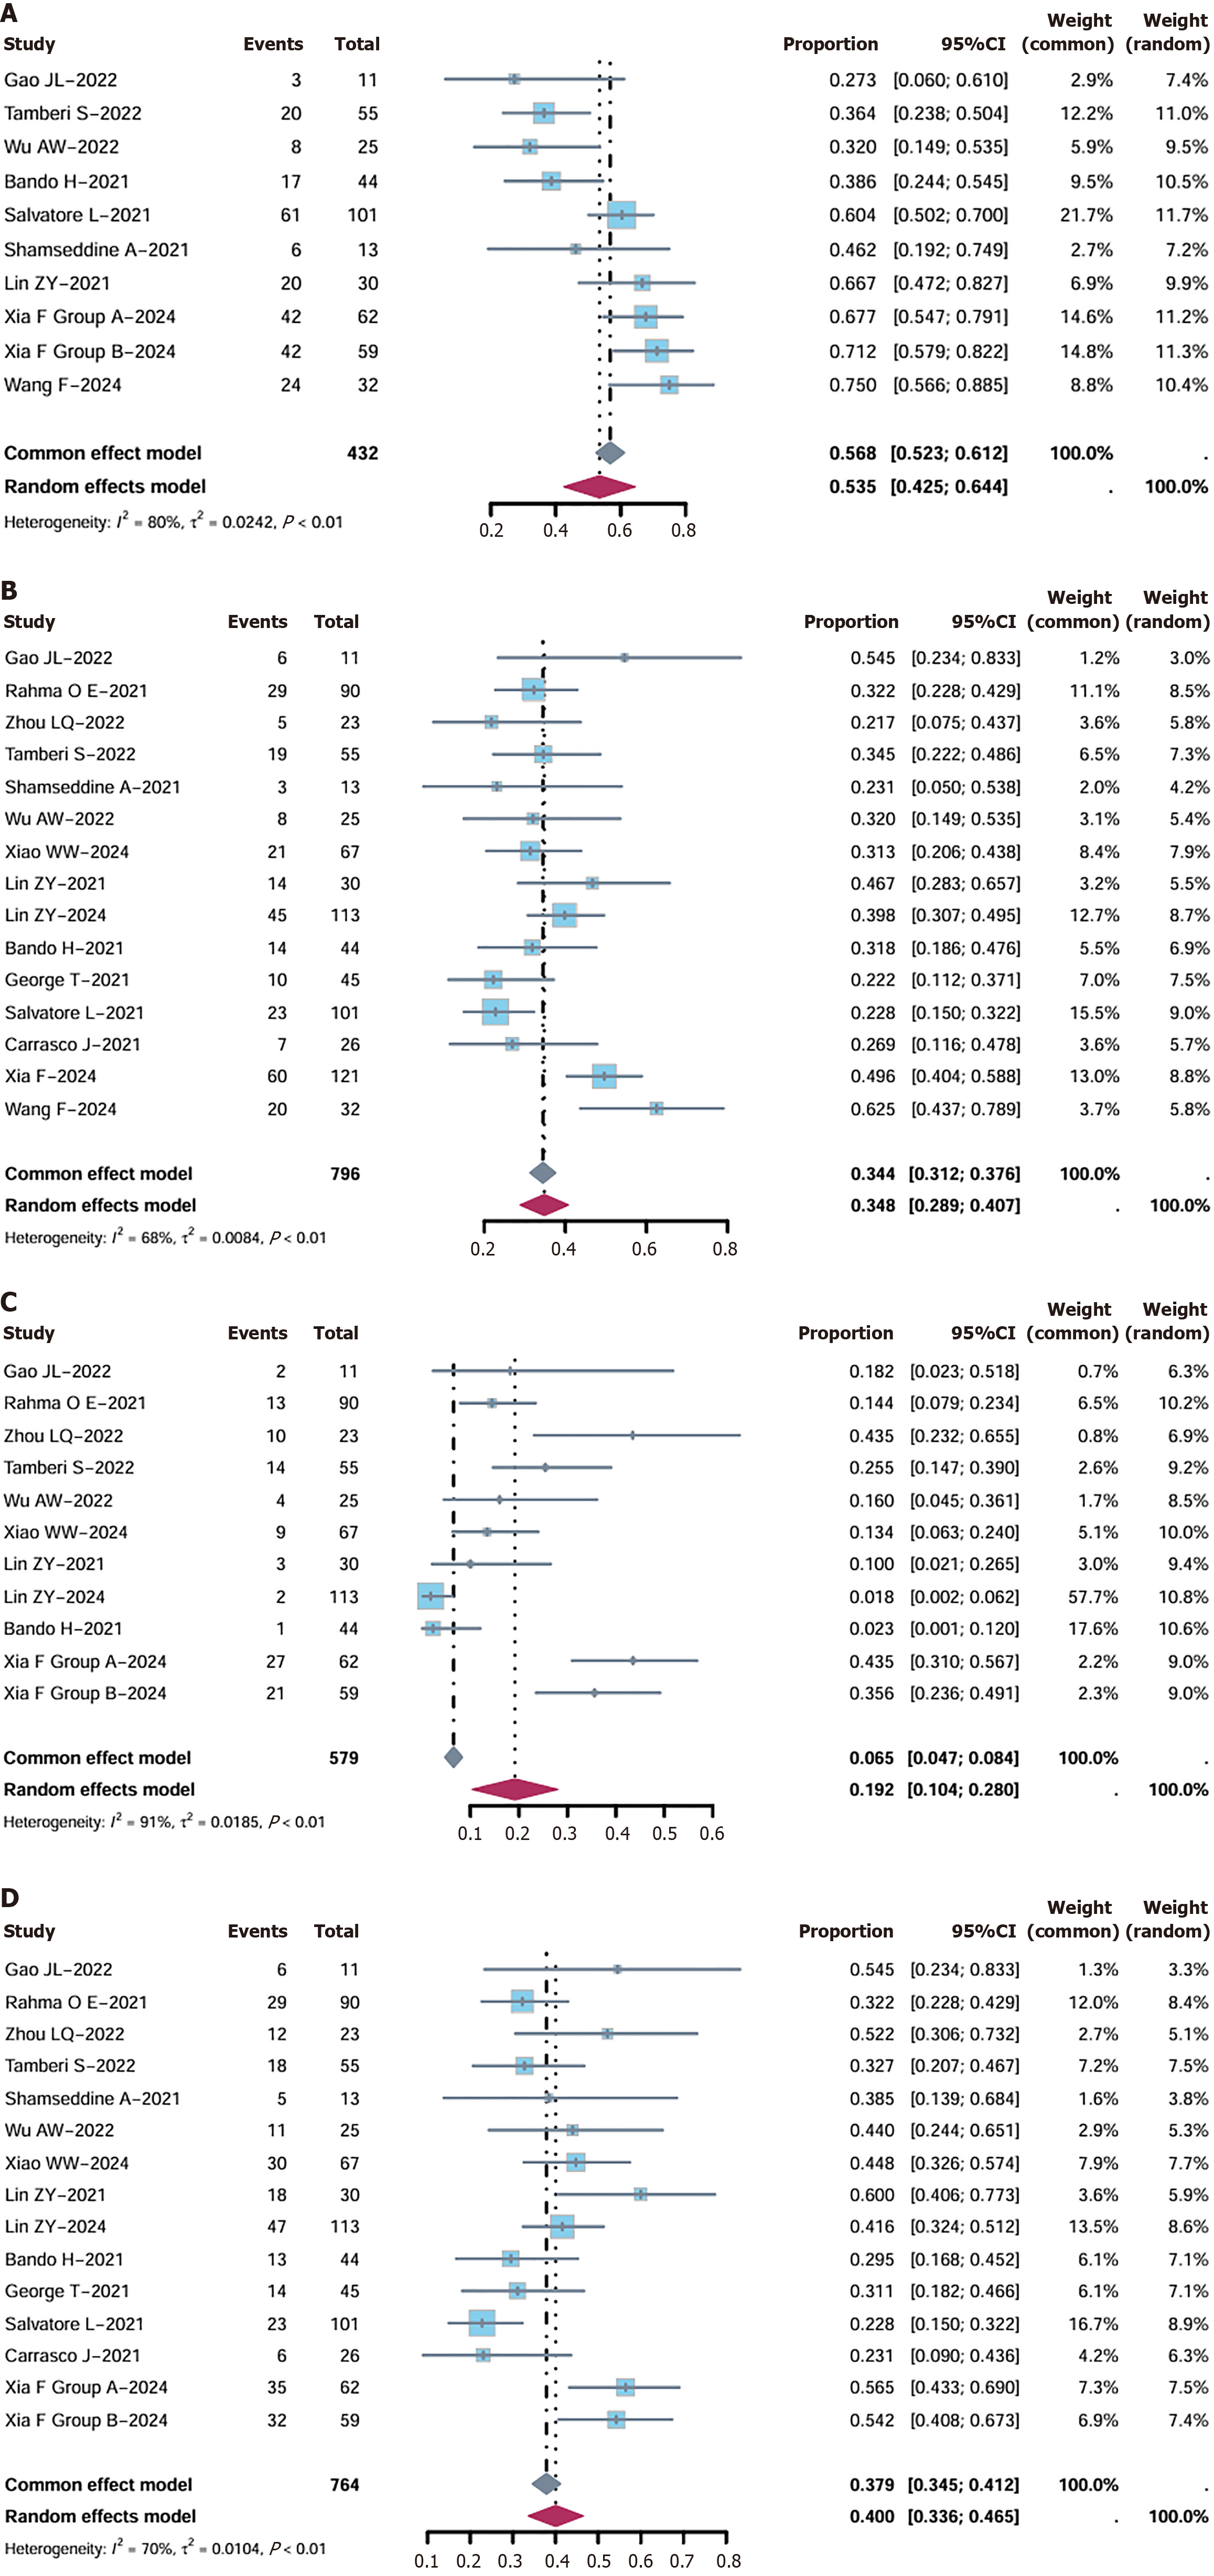
Figure 3 Forest plot of rate risk ratio.
A: Major pathological response; B: Pathological complete response (pCR); C: Clinical complete response (CCR); D: PCR + CCR.
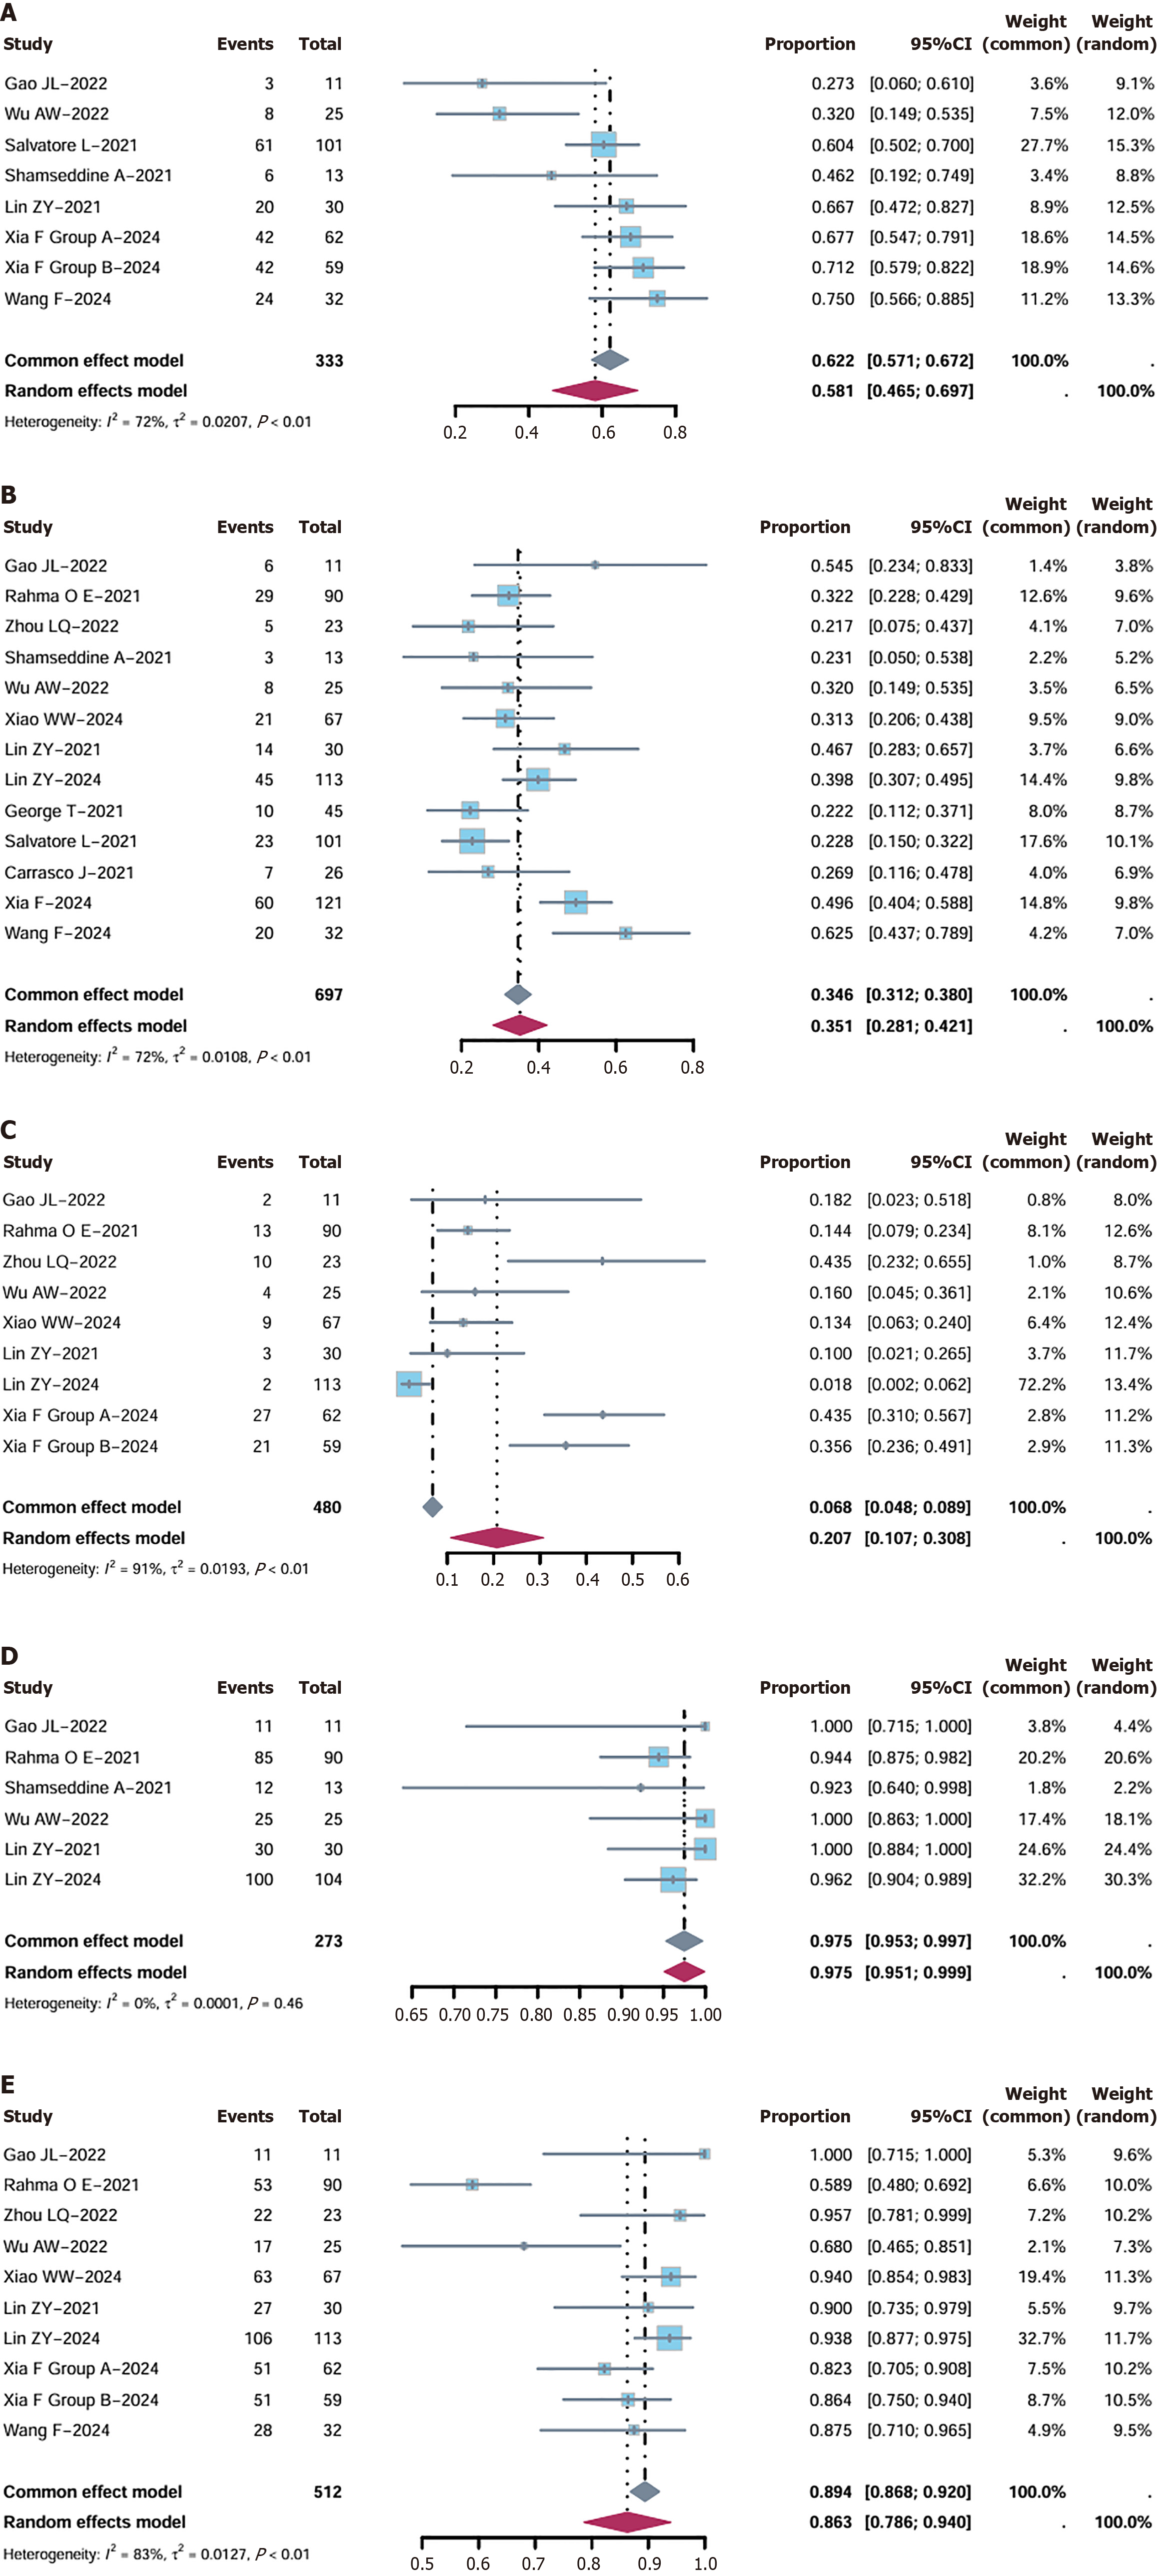
Figure 4 Subgroup analysis of major pathological response, pathological complete response, and clinical complete response in patients with proficient mismatch repair status.
A-C: Forest plot of major pathological response rate risk ratio in the subgroup of patients with proficient mismatch repair (pMMR; A), pathological complete response rate risk ratio in the subgroup of patients with pMMR (B), and clinical complete response rate risk ratio in the subgroup of patients with pMMR (C); D and E: Forest plot of R0 resection (D) and the sphincter preservation (E) rate risk ratio.
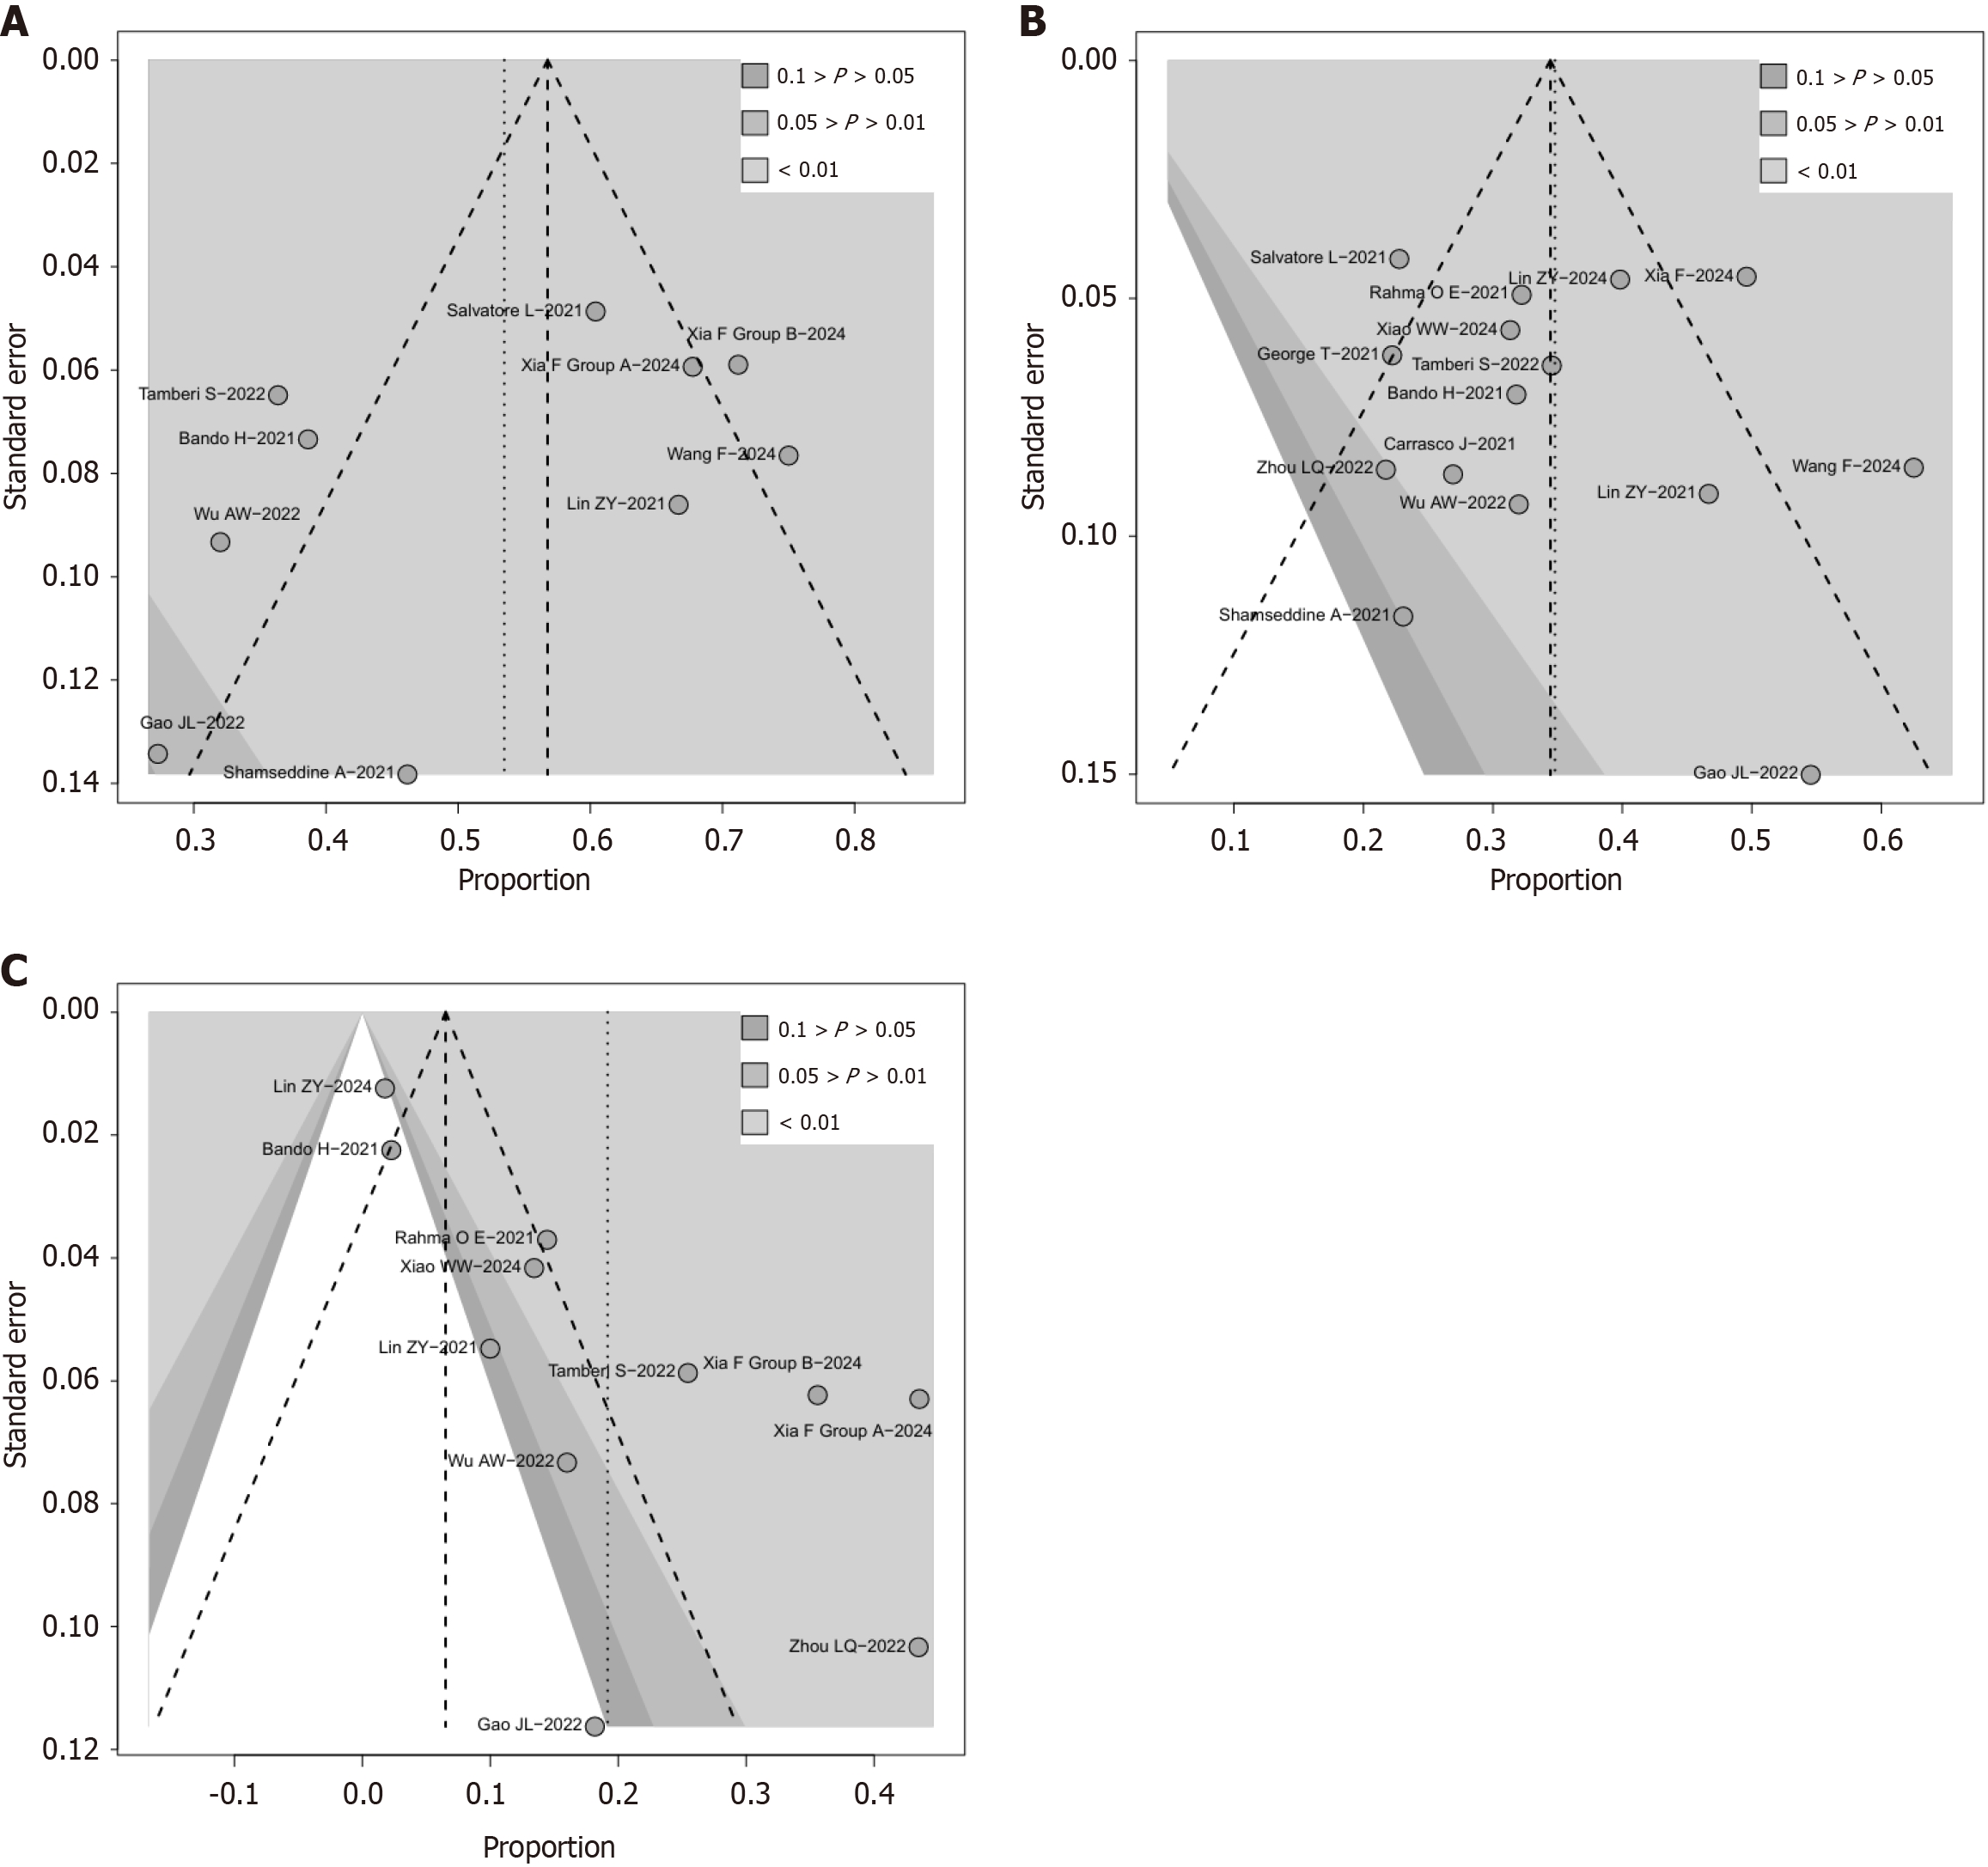
Figure 5 Funnel plot analysis of publication bias for major pathological response, pathological complete response, and clinical complete response.
A: Major pathological response; B: Pathological complete response; C: Clinical complete response.
- Citation: Yan WX, Yuan HQ, Xiong ZY, Qin LJ, Wu J, He J, Mu J, Li J, Li N. Meta-analysis of the efficacy of neoadjuvant immunotherapy combined with radiotherapy and chemotherapy for locally advanced rectal cancer. World J Gastrointest Oncol 2025; 17(11): 113048
- URL: https://www.wjgnet.com/1948-5204/full/v17/i11/113048.htm
- DOI: https://dx.doi.org/10.4251/wjgo.v17.i11.113048


