Copyright
©The Author(s) 2025.
World J Gastrointest Oncol. Nov 15, 2025; 17(11): 111142
Published online Nov 15, 2025. doi: 10.4251/wjgo.v17.i11.111142
Published online Nov 15, 2025. doi: 10.4251/wjgo.v17.i11.111142
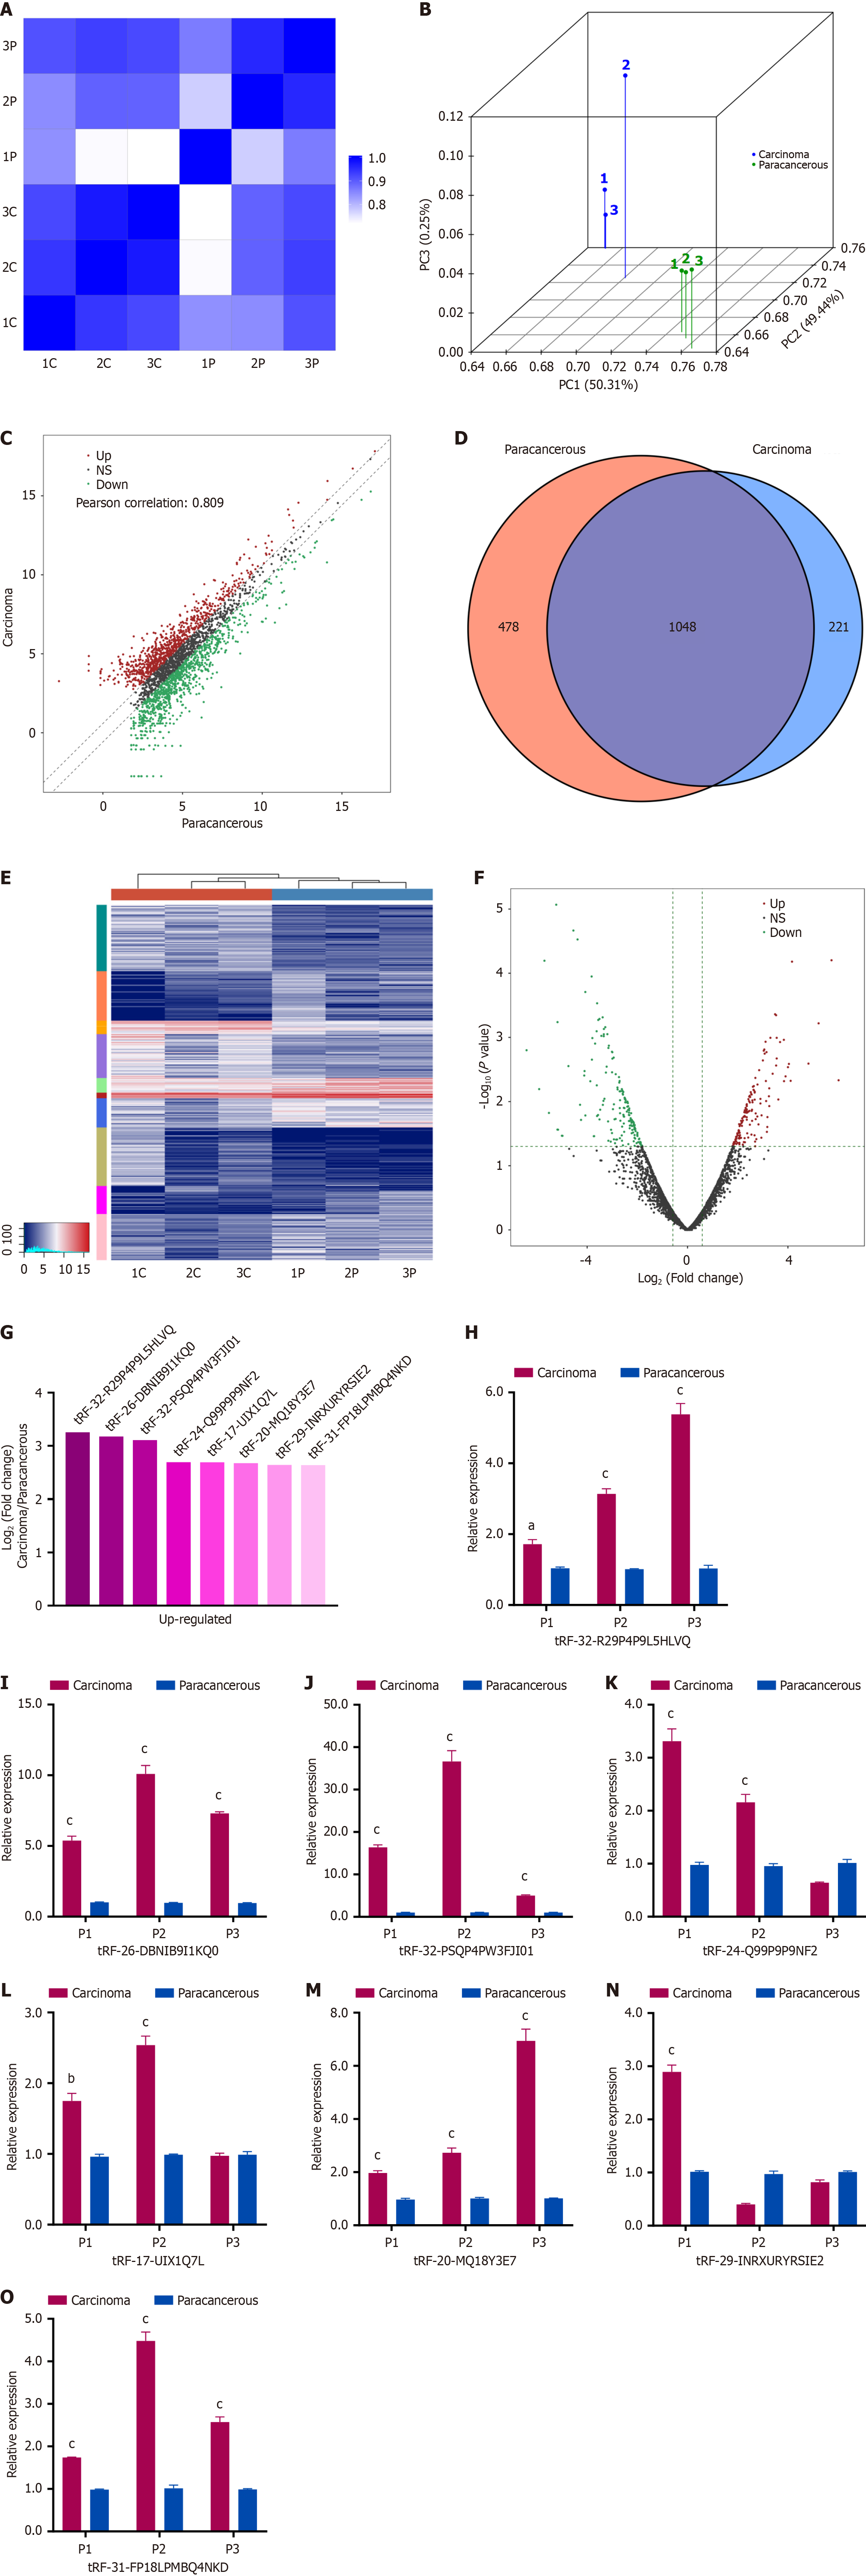
Figure 1 Expression profiling and preliminary validation of transfer RNA-derived small RNAs in early-stage hepatocellular carcinoma.
High-throughput sequencing was performed on three pairs of Barcelona Clinic Liver Cancer 0/A stage hepatocellular carcinoma tissues and adjacent non-tumor tissues. A: Heatmap illustrating the correlation coefficient of tissue samples; B: Principal component analysis demonstrating sample clustering; C: Scatter plot comparing transfer transfer RNA-derived small RNAs (tsRNAs) expression between tumor and non-tumor tissues; D: Venn diagram depicting the number of commonly and specifically expressed tsRNAs in each group; E: Unsupervised hierarchical clustering heatmap of tsRNAs; F: Volcano plot highlighting differentially expressed tsRNAs (P < 0.05, |log2FC| > 1.5); G: Eight candidate tsRNAs selected from the top upregulated tsRNAs based on expression level and signal homogeneity; H-O: Validation of the relative expression levels of the eight selected tsRNAs using quantitative polymerase chain reaction in the same tissue pairs. aP < 0.01; bP < 0.001; cP < 0.0001.
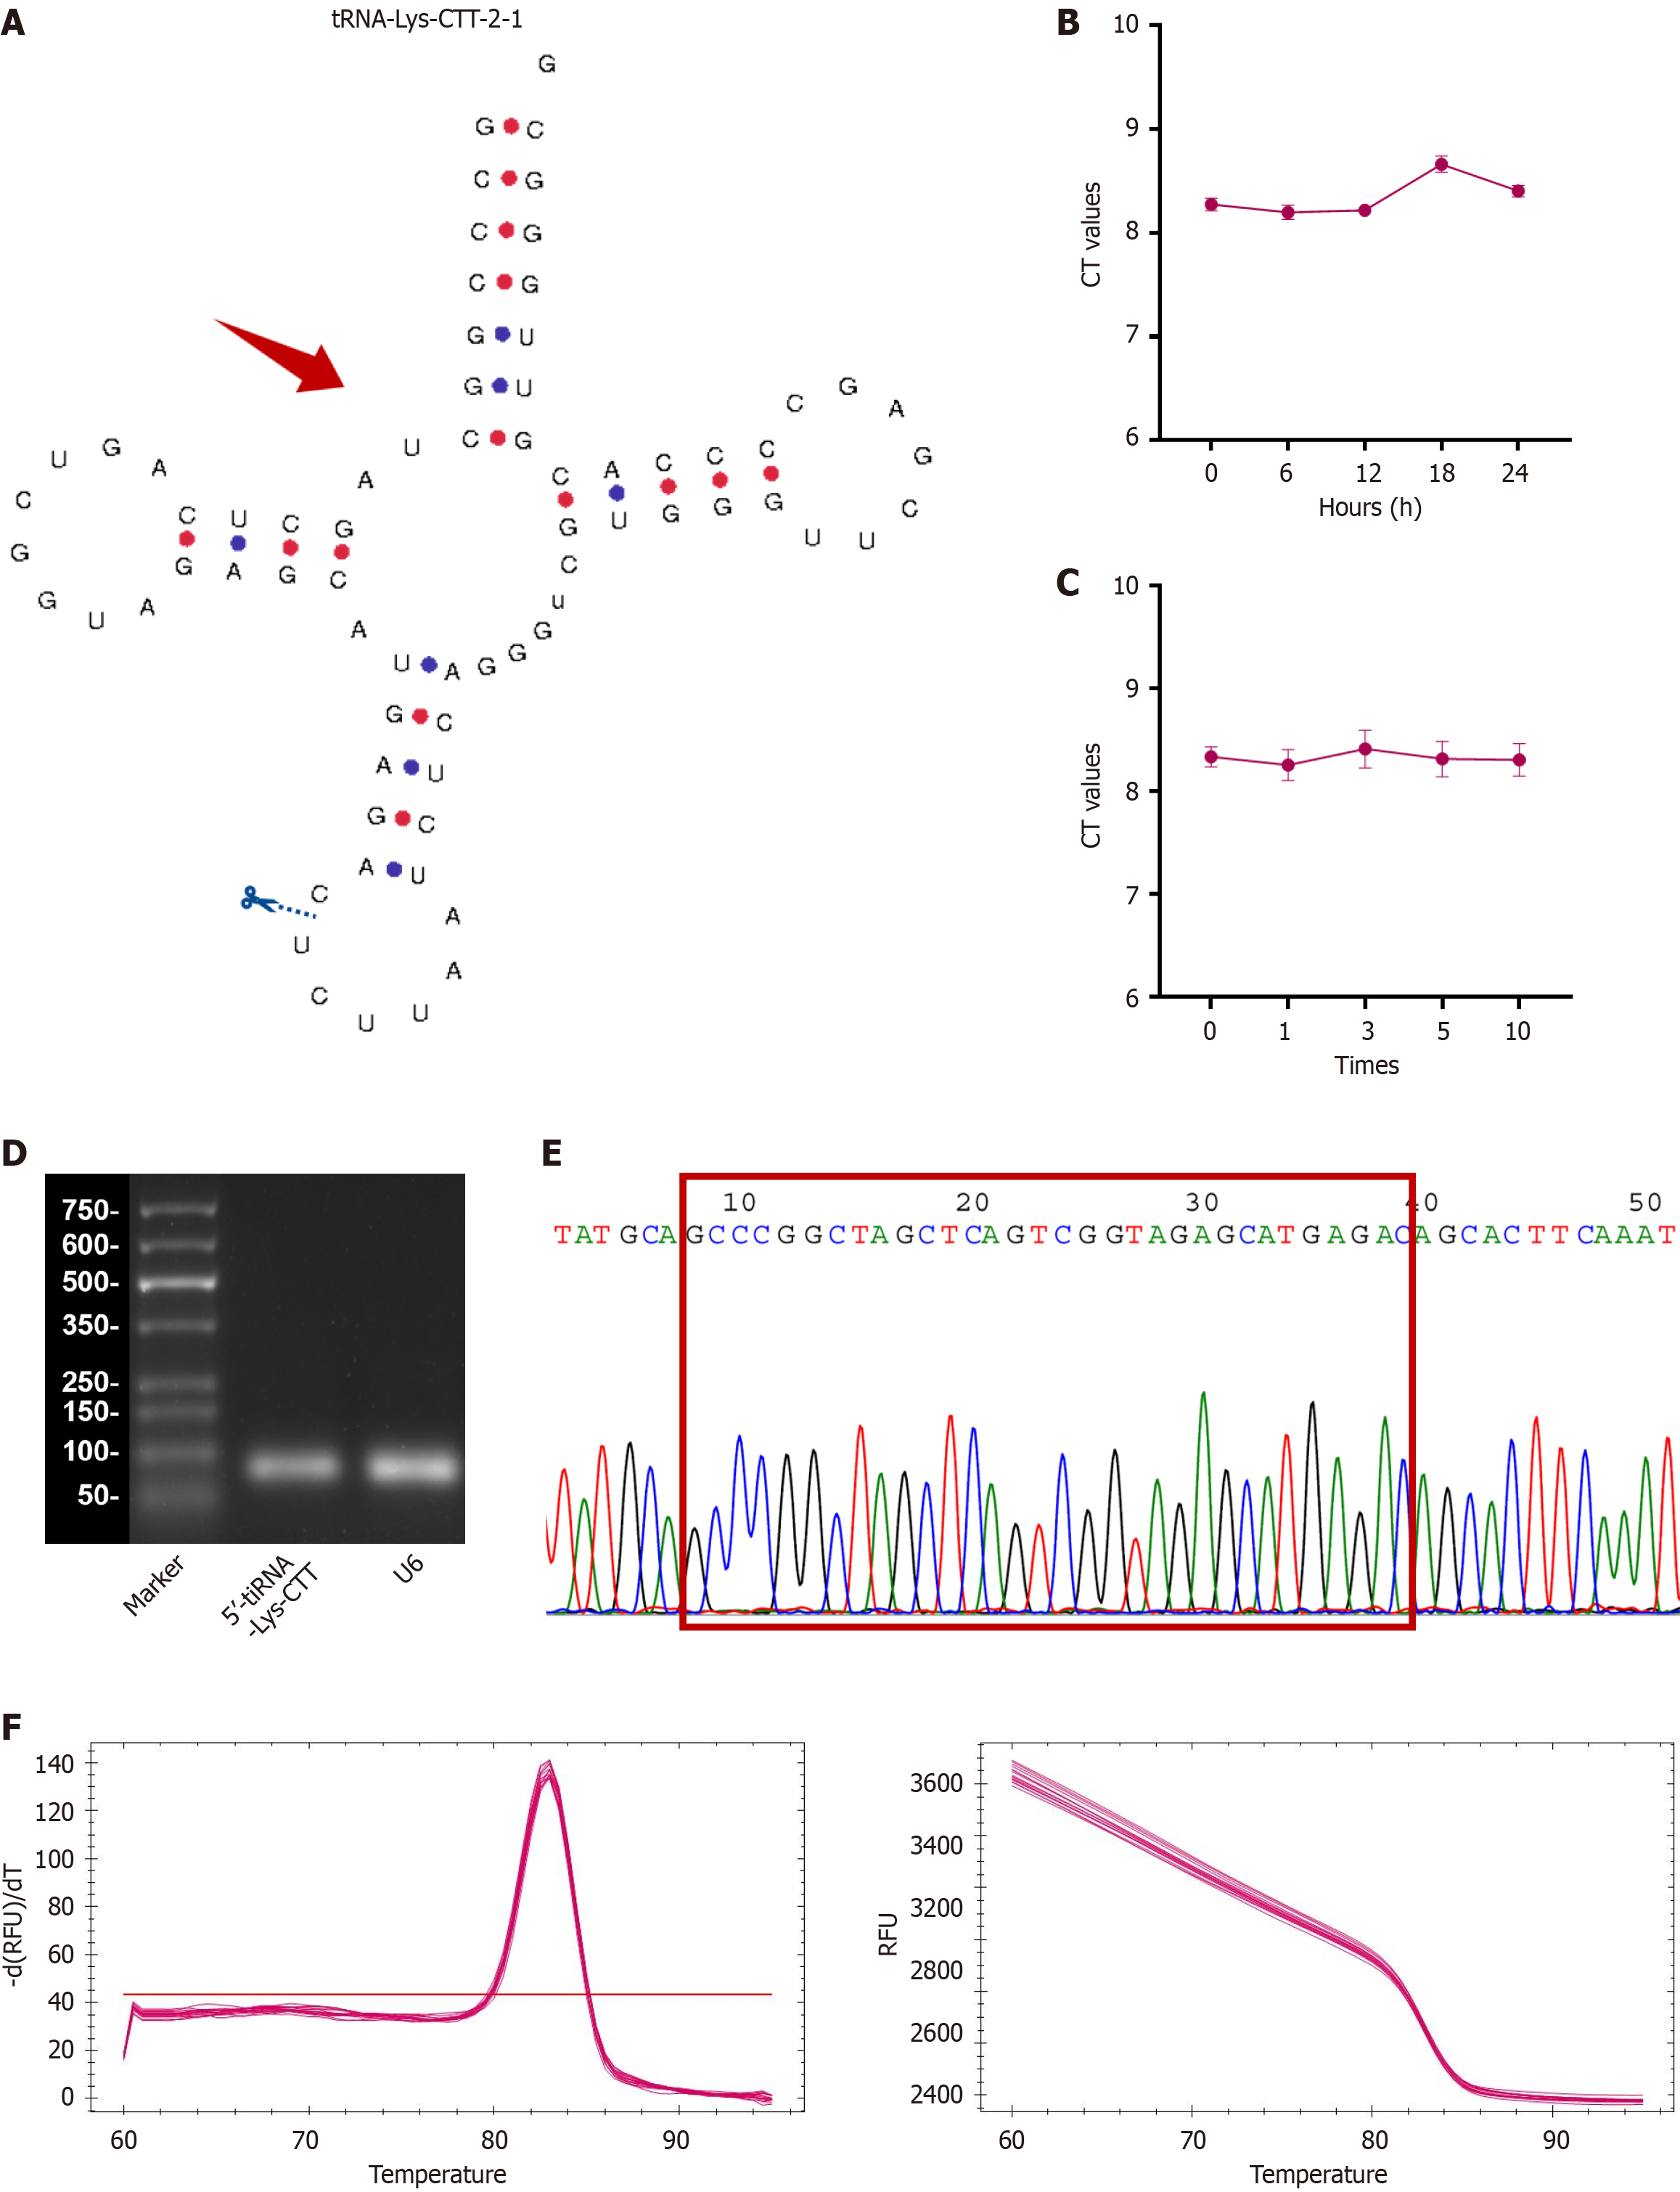
Figure 2 Validation of 5’-transfer RNA halve-lysine-CTT as a biomarker.
A: Schematic representation of the 5’-transfer RNA halve (tiRNA)-lysine (Lys)-CTT cleavage site, located above the anticodon loop; B and C: Stability of 5’-tiRNA-Lys-CTT assessed by quantitative polymerase chain reaction (qPCR) after exposure to varying durations of incubation at ambient temperature and multiple freeze-thaw cycles demonstrating consistent expression; D: Agarose gel electrophoresis of qPCR products showing a single band around 80 base pairs; E: Sanger sequencing confirmation of the qPCR product, demonstrating the full-length sequence of 5’-tiRNA-Lys-CTT; F: Representative melting curves of 5’-tiRNA-Lys-CTT, exhibiting a single peak, indicating high specificity. tiRNA: Transfer RNA halve; Lys: Lysine; CT: Cycle threshold.
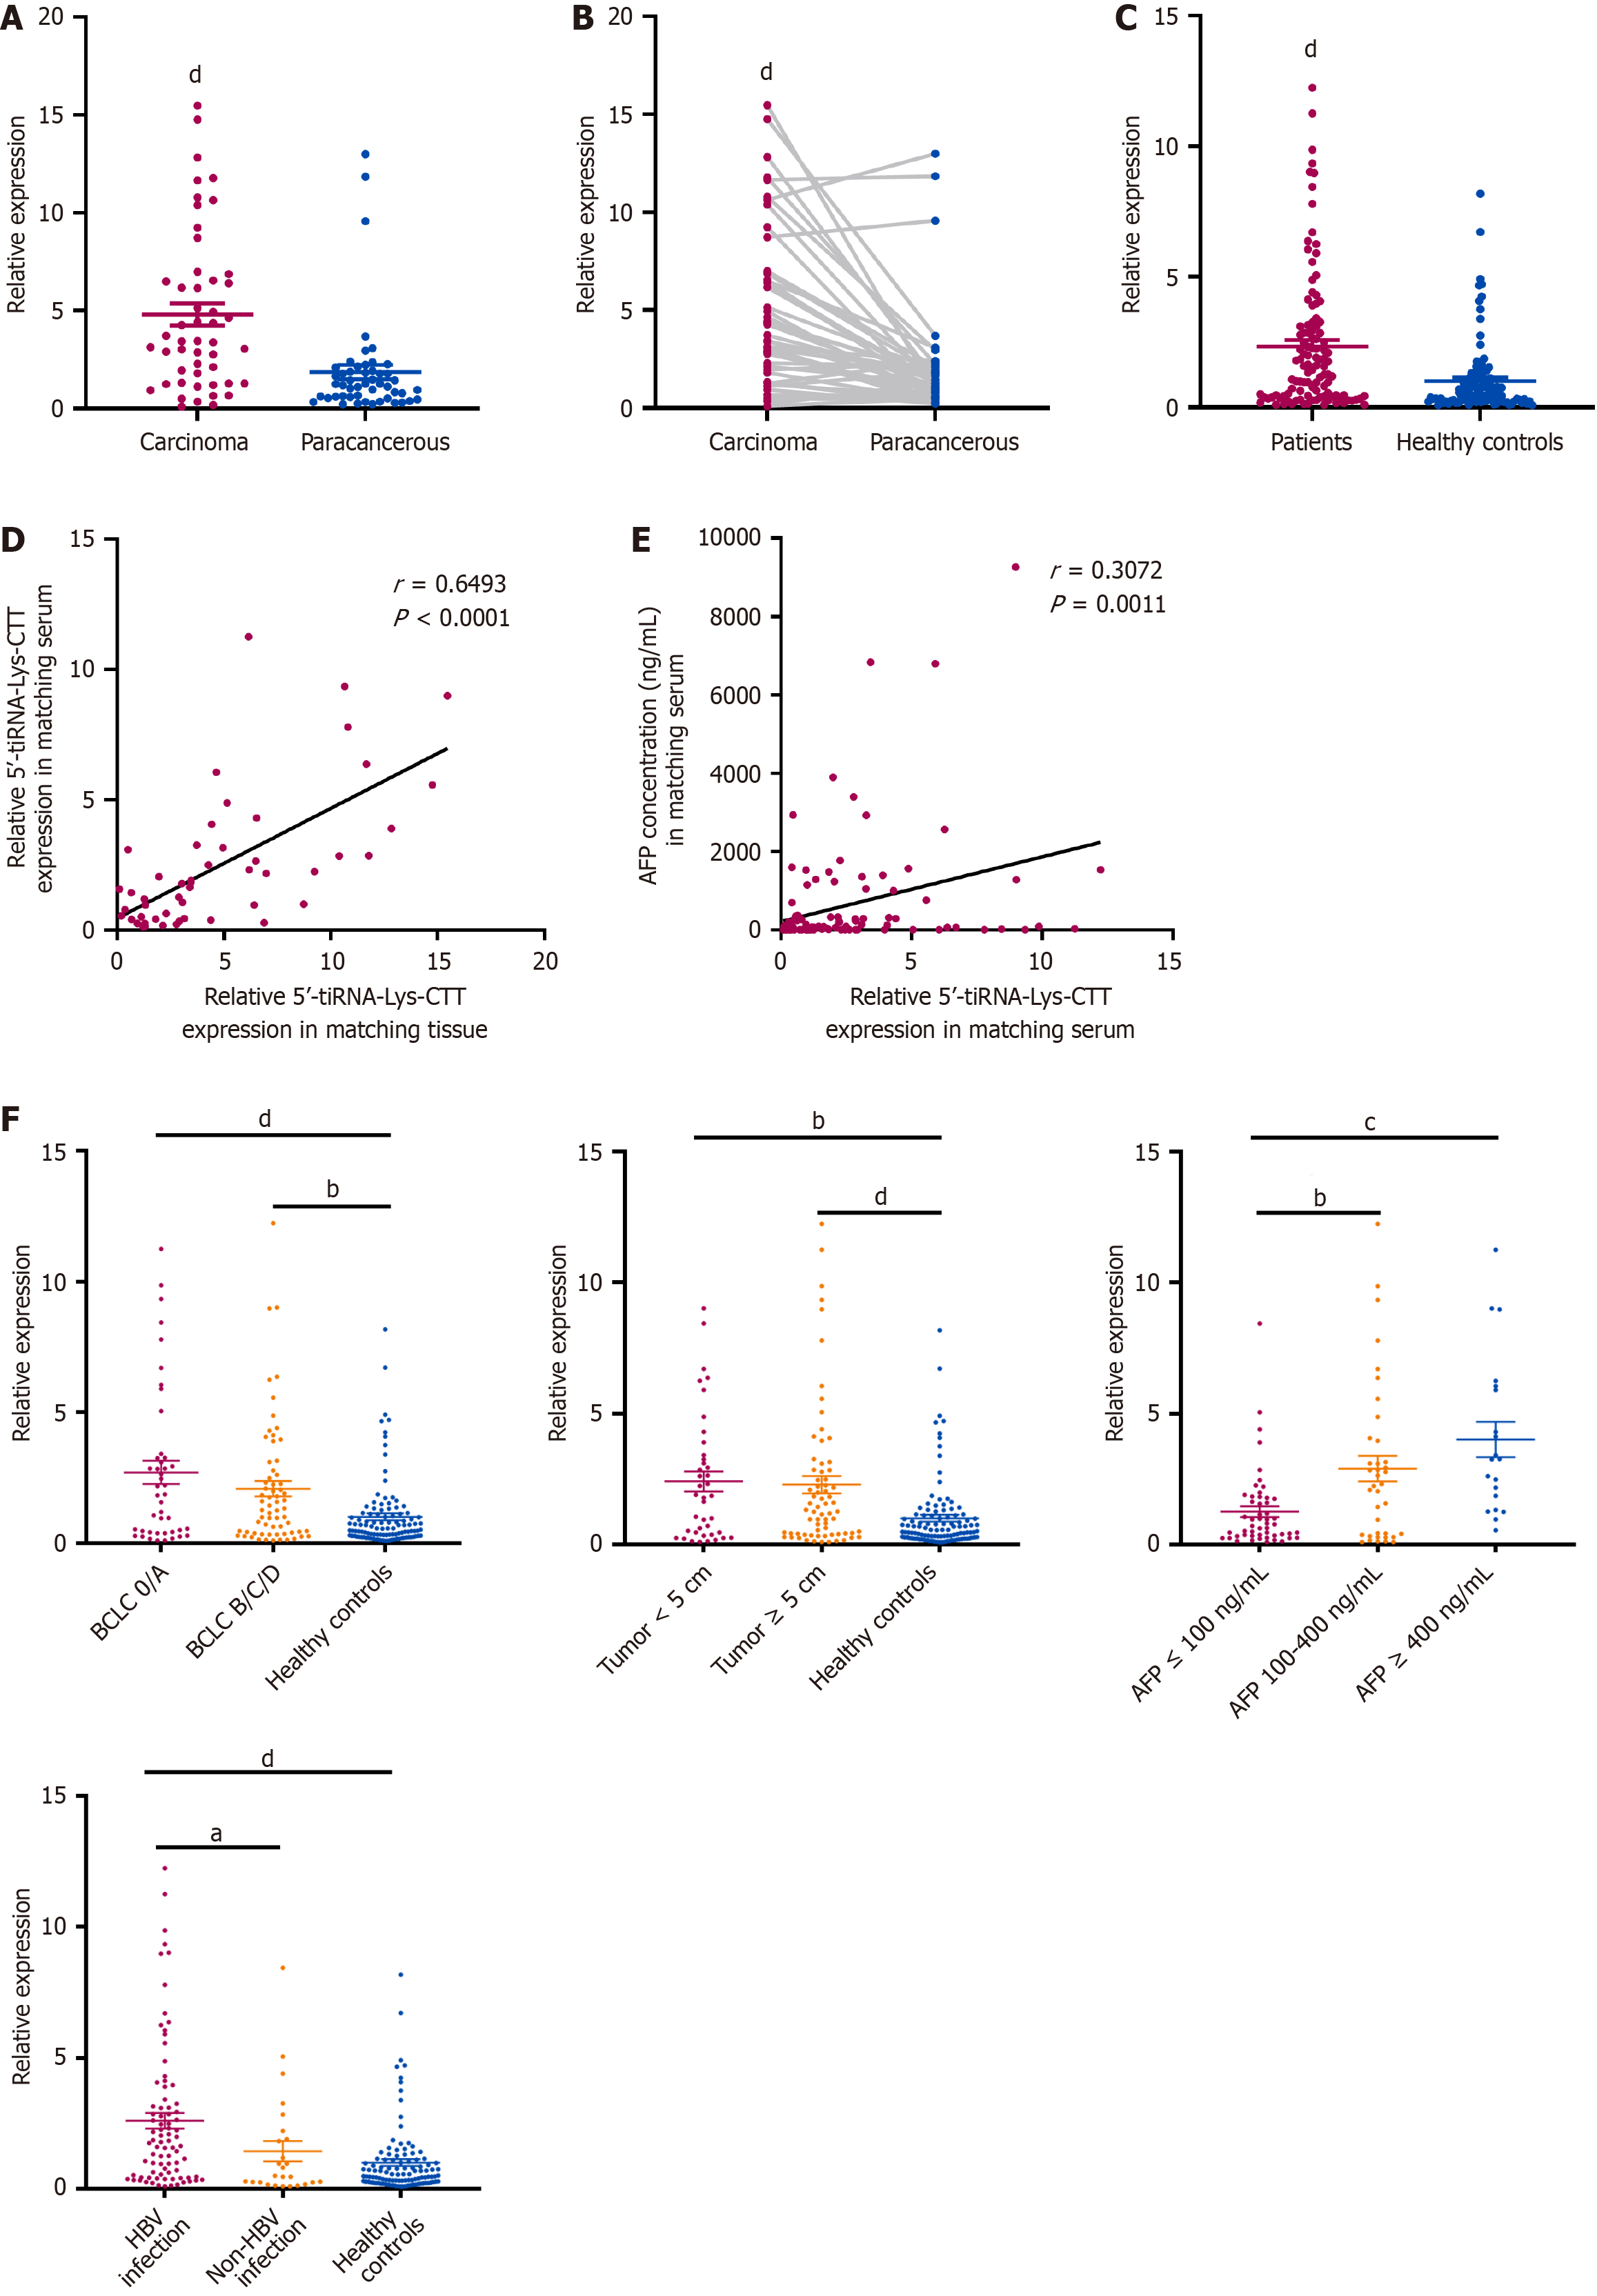
Figure 3 5’-transfer RNA halve-lysine-CTT expression in hepatocellular carcinoma and clinicopathological correlations.
A and B: 5’-transfer RNA halve (tiRNA)-lysine (Lys)-CTT expression in 50 paired hepatocellular carcinoma (HCC) and adjacent non-tumor tissues, assessed by quantitative polymerase chain reaction. Statistical significance determined by paired t-test and unpaired t-test; C: 5’-tiRNA-Lys-CTT expression in serum of 110 HCC patients and 110 healthy controls, assessed by quantitative polymerase chain reaction; D: Correlation analysis between 5’-tiRNA-Lys-CTT expression in paired tumor and serum samples (n = 50) using Pearson correlation; E: Correlation analysis between 5’-tiRNA-Lys-CTT expression in serum and alpha-fetoprotein concentration (n = 110) using Pearson correlation; F: 5’-tiRNA-Lys-CTT serum expression levels in HCC patients stratified by Barcelona Clinic Liver Cancer stage, tumor size, alpha-fetoprotein concentration, and hepatitis B virus infection status. All the values are as mean ± SD. aP < 0.05; bP < 0.01; cP < 0.001; dP < 0.0001. tiRNA: Transfer RNA halve; Lys: Lysine; AFP: Alpha-fetoprotein; BCLC: Barcelona Clinic Liver Cancer; HBV: Hepatitis B virus.
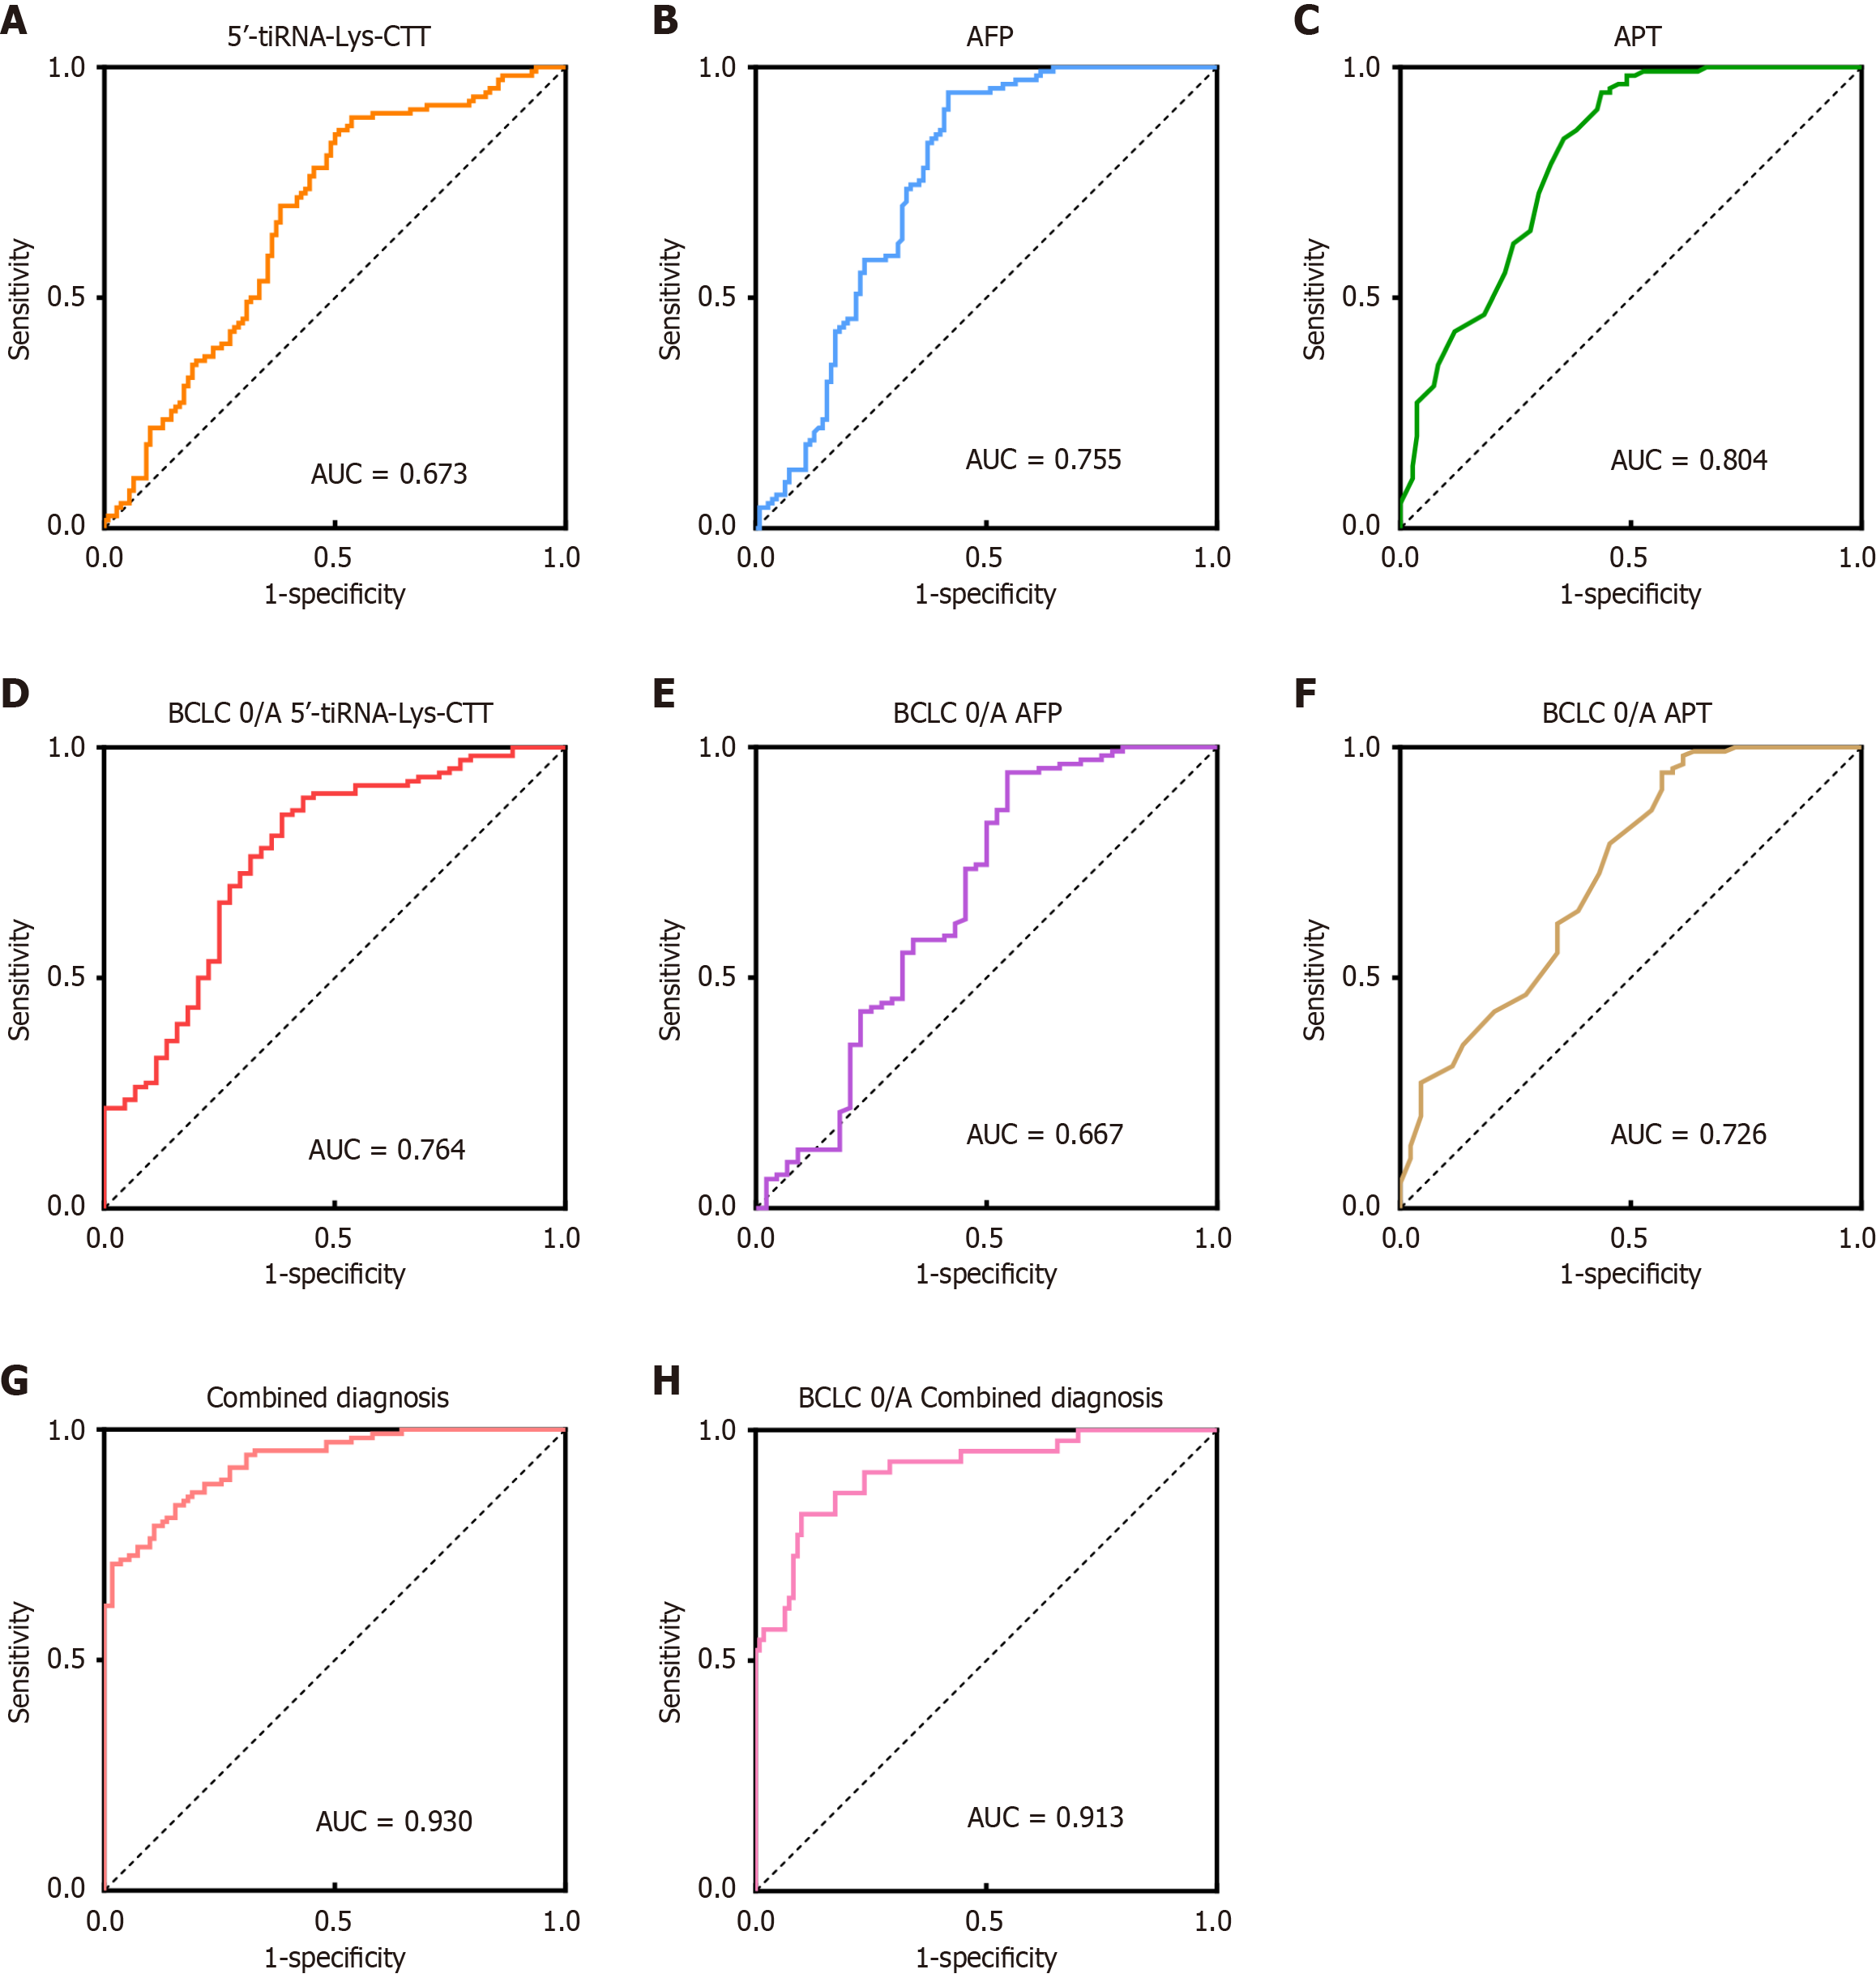
Figure 4 Diagnostic performance of serum 5’-transfer RNA halve-lysine-CTT and combined diagnostic model in hepatocellular car
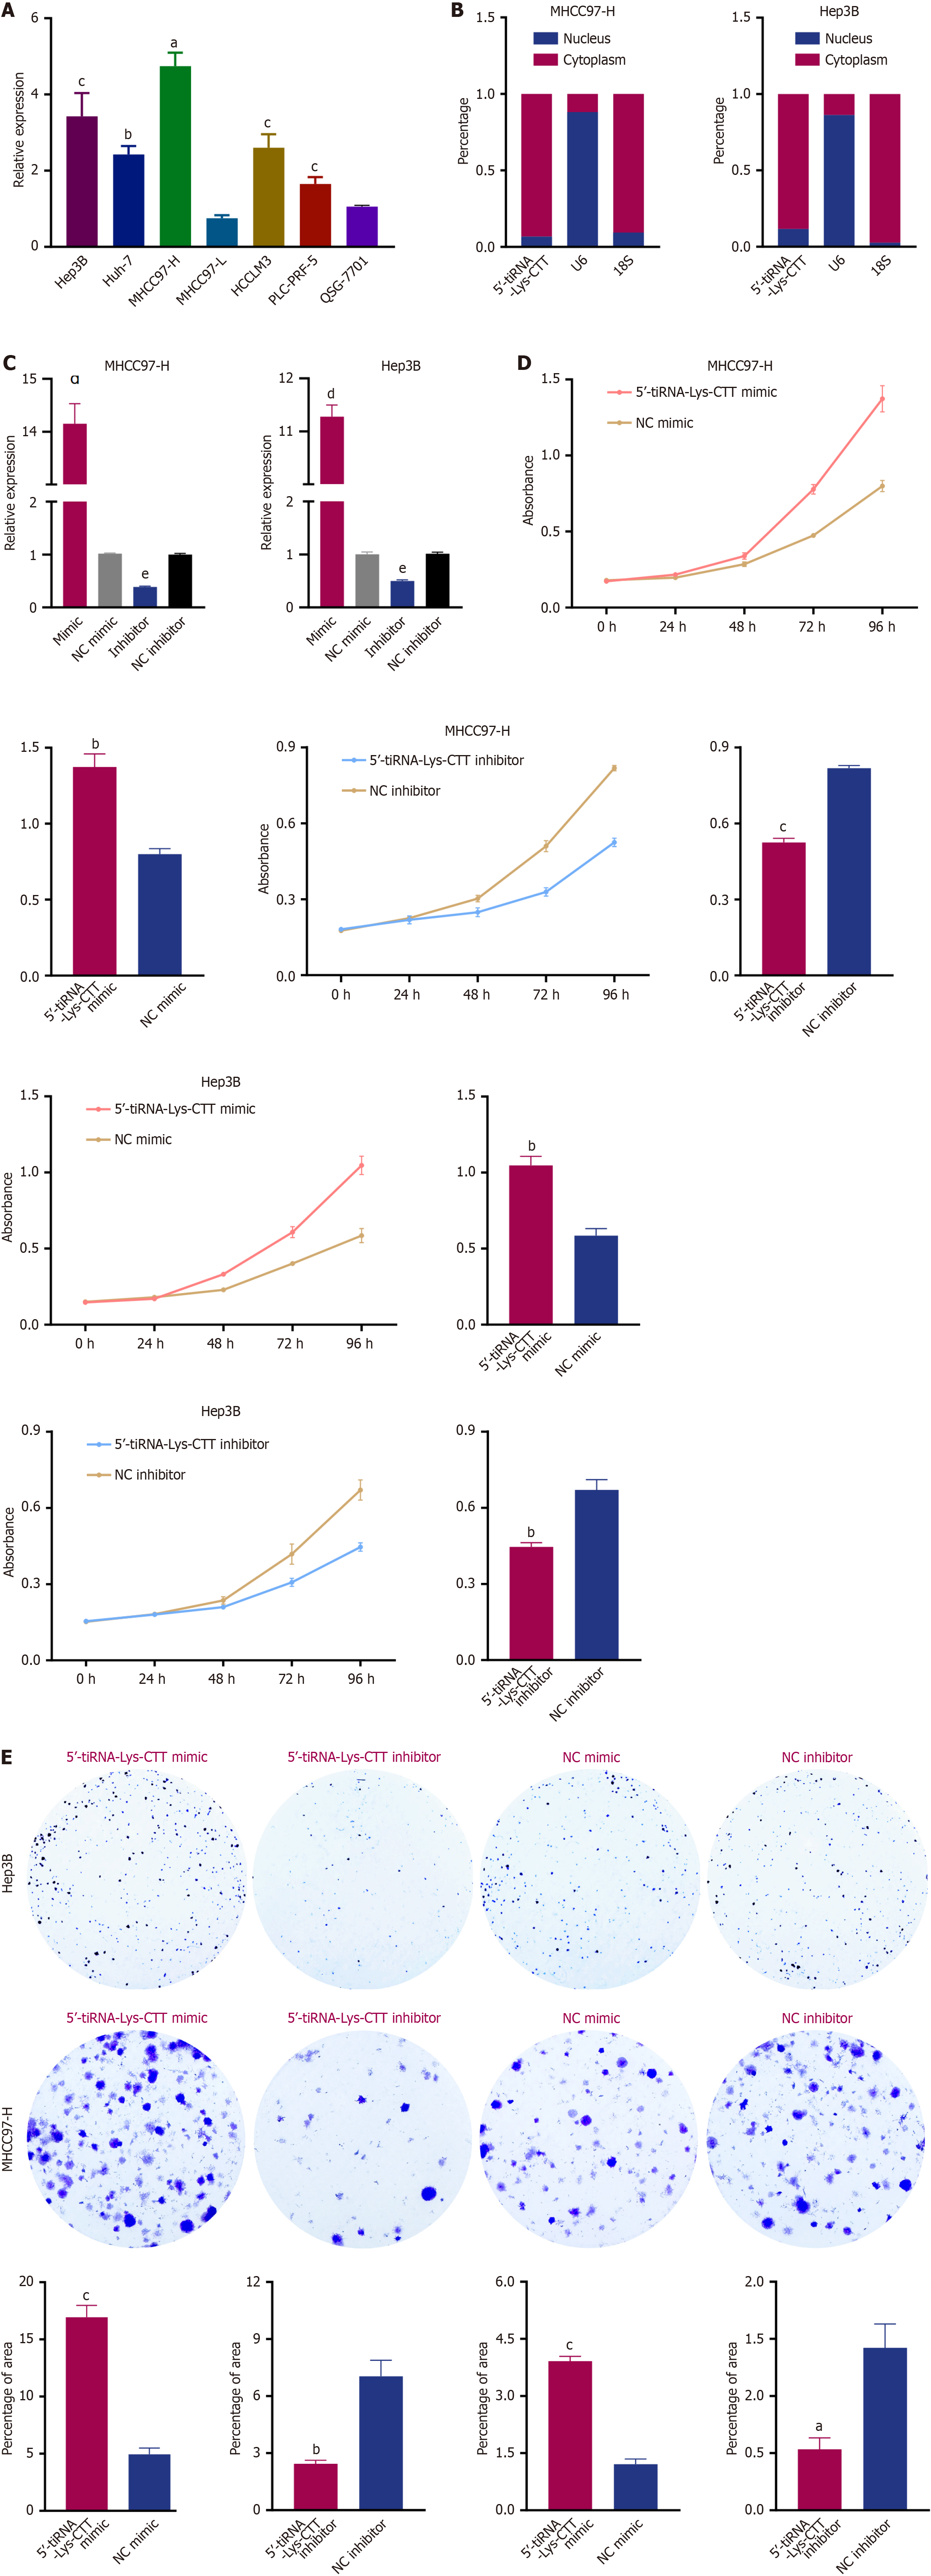
Figure 5 Oncogenic role of 5’-transfer RNA halve-lysine-CTT in hepatocellular carcinoma.
A: Expression of 5’-transfer RNA halve (tiRNA)-lysine (Lys)-CTT in six hepatocellular carcinoma cell lines and the normal liver cell line (QSG-7701) measured by quantitative polymerase chain reaction; B: Intracellular localization of 5’-tiRNA-Lys-CTT in MHCC97-H and Hep3B cell lines assessed by nuclear-cytoplasmic fractionation; C: Efficiency of 5’-tiRNA-Lys-CTT mimic and inhibitor in MHCC97-H and Hep3B cells evaluated by quantitative polymerase chain reaction; D: Cell viability of MHCC97-H and Hep3B cells following transfection with 5’-tiRNA-Lys-CTT mimic, mimic negative control, inhibitor, or inhibitor negative control, measured by CCK-8 assay; E: Colony formation assays to determine the effect of 5’-tiRNA-Lys-CTT on cell growth and proliferation. All the values are as mean ± SD. aP < 0.01; bP < 0.001; cP < 0.0001. tiRNA: Transfer RNA halve; Lys: Lysine; NC: Negative control.
Figure 6 5’-transfer RNA halve-lysine-CTT promotes hepatocellular carcinoma cell proliferation and migration in vitro.
A: 5-ethynyl-2’-deoxyuridine staining was used to evaluate the proportion of proliferating cells in MHCC97-H and Hep3B cells following transfection with 5’-transfer RNA halve-lysine-CTT mimic, mimic negative control, inhibitor or inhibitor negative control; B: Transwell assay was performed to evaluate the effect of 5’-transfer RNA halve-lysine-CTT on the migration capacities of MHCC97-H and Hep3B cells. All the values are as mean ± SD. aP < 0.01; bP < 0.001. tiRNA: Transfer RNA halve; Lys: Lysine; NC: Negative control; EDU: 5-ethynyl-2’-deoxyuridine.
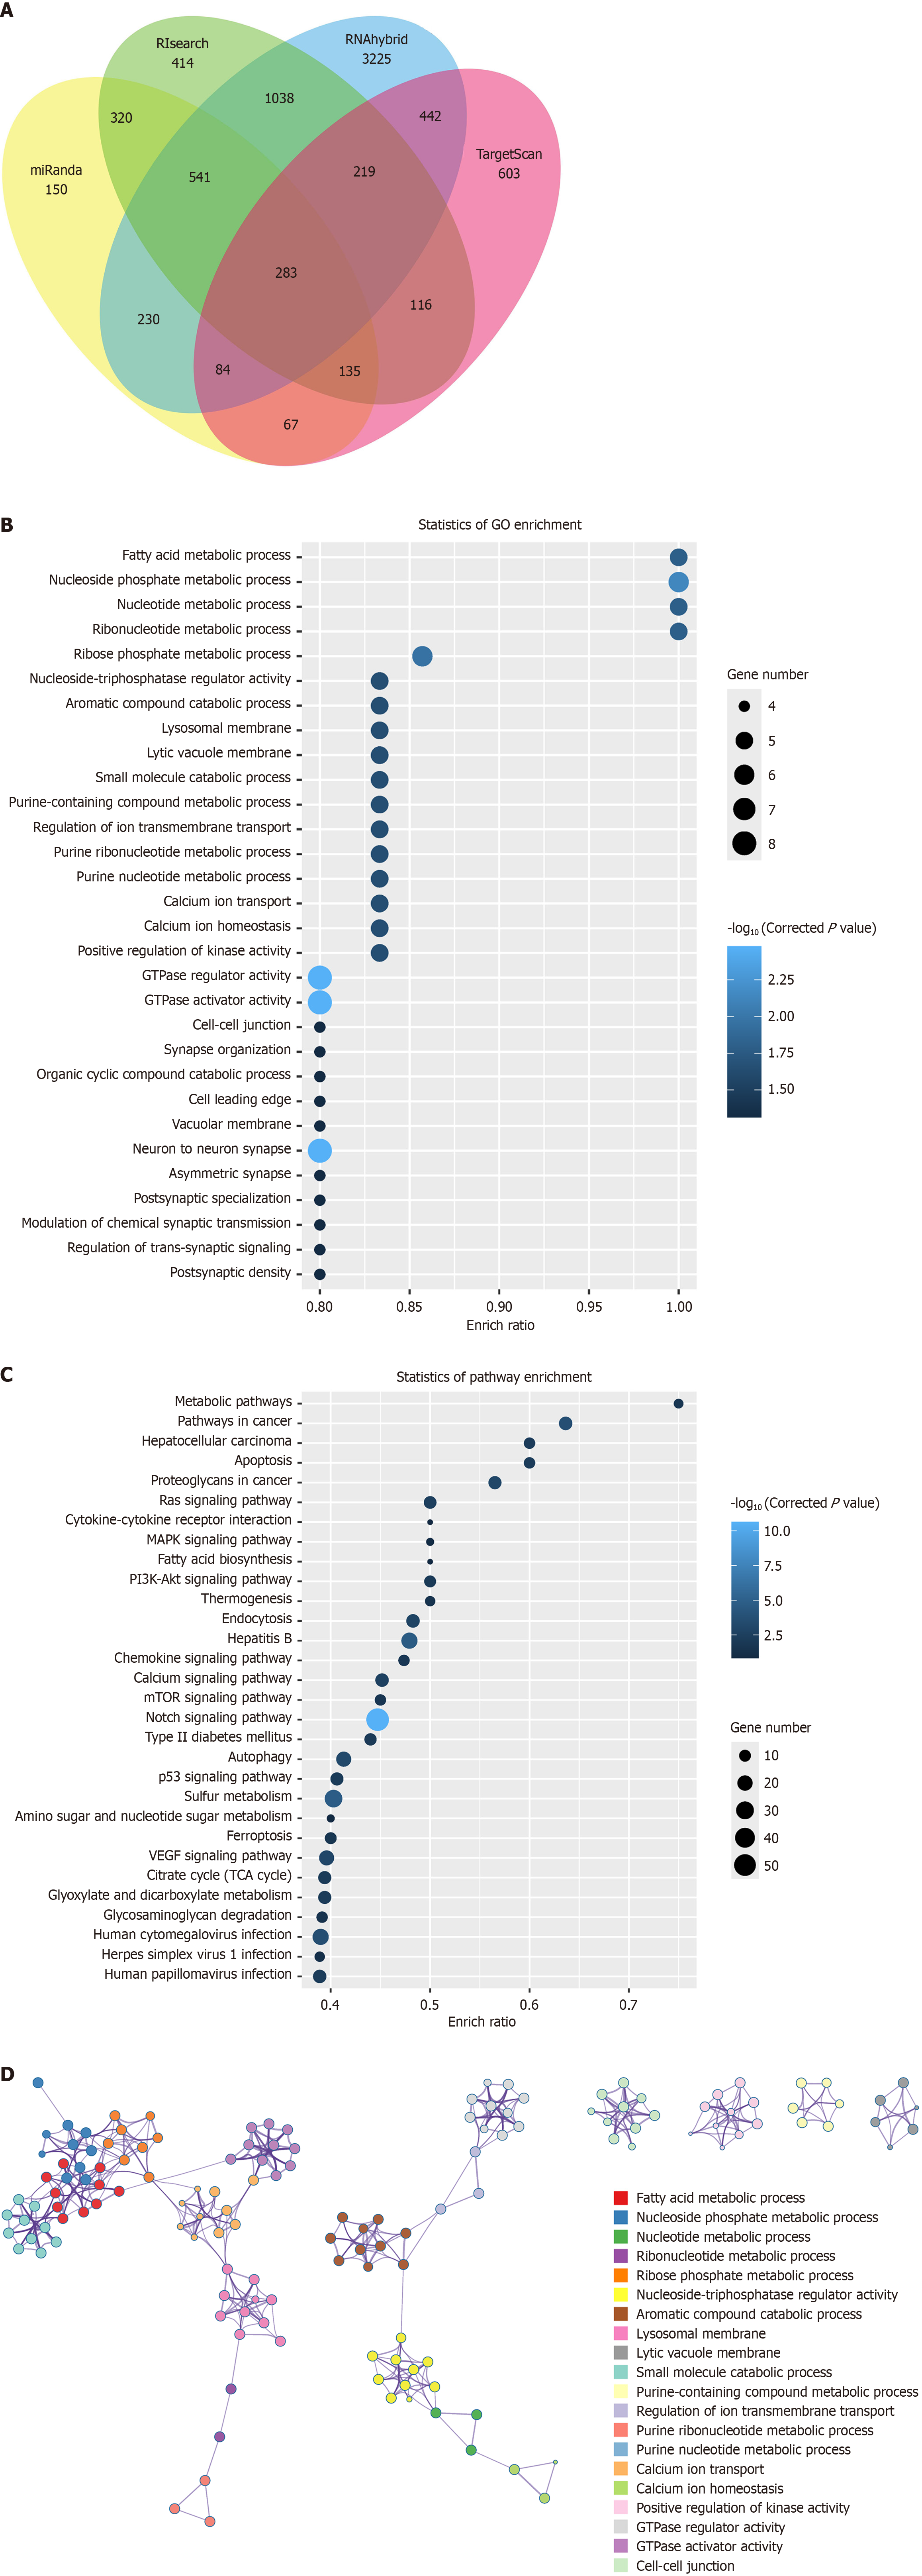
Figure 7 Target prediction and functional enrichment analysis of 5’-transfer RNA halve-lysine-CTT.
A: Schematic diagram illustrating the workflow for 5’-transfer RNA halve-lysine-CTT target prediction. Venn diagram depicting the overlap of predicted target genes identified by miRanda, TargetScan, RIsearch, and RNAhybrid; B: Gene Ontology enrichment analysis of the candidate target genes, highlighting the top enriched terms in biological processes, cellular components, and molecular functions; C: Kyoto Encyclopedia of Genes and Genomes pathway enrichment analysis of the candidate target genes, revealing the most relevant pathways; D: Network visualization of Gene Ontology terms enriched in the candidate target gene set. Only terms with P < 0.01, a minimum count of 3, and an enrichment factor > 1.5 are shown, and they are clustered based on semantic similarity. GO: Gene Ontology; KEGG: Kyoto Encyclopedia of Genes and Genomes.
- Citation: Yuan J, Gu WC, Xu TX, Shen XJ, Li X, Shen L, Zhang Y, Ju SQ. 5’-transfer RNA halve-lysine-CTT as a promising biomarker for early detection of hepatocellular carcinoma. World J Gastrointest Oncol 2025; 17(11): 111142
- URL: https://www.wjgnet.com/1948-5204/full/v17/i11/111142.htm
- DOI: https://dx.doi.org/10.4251/wjgo.v17.i11.111142


