Copyright
©The Author(s) 2025.
World J Gastrointest Oncol. Oct 15, 2025; 17(10): 109506
Published online Oct 15, 2025. doi: 10.4251/wjgo.v17.i10.109506
Published online Oct 15, 2025. doi: 10.4251/wjgo.v17.i10.109506
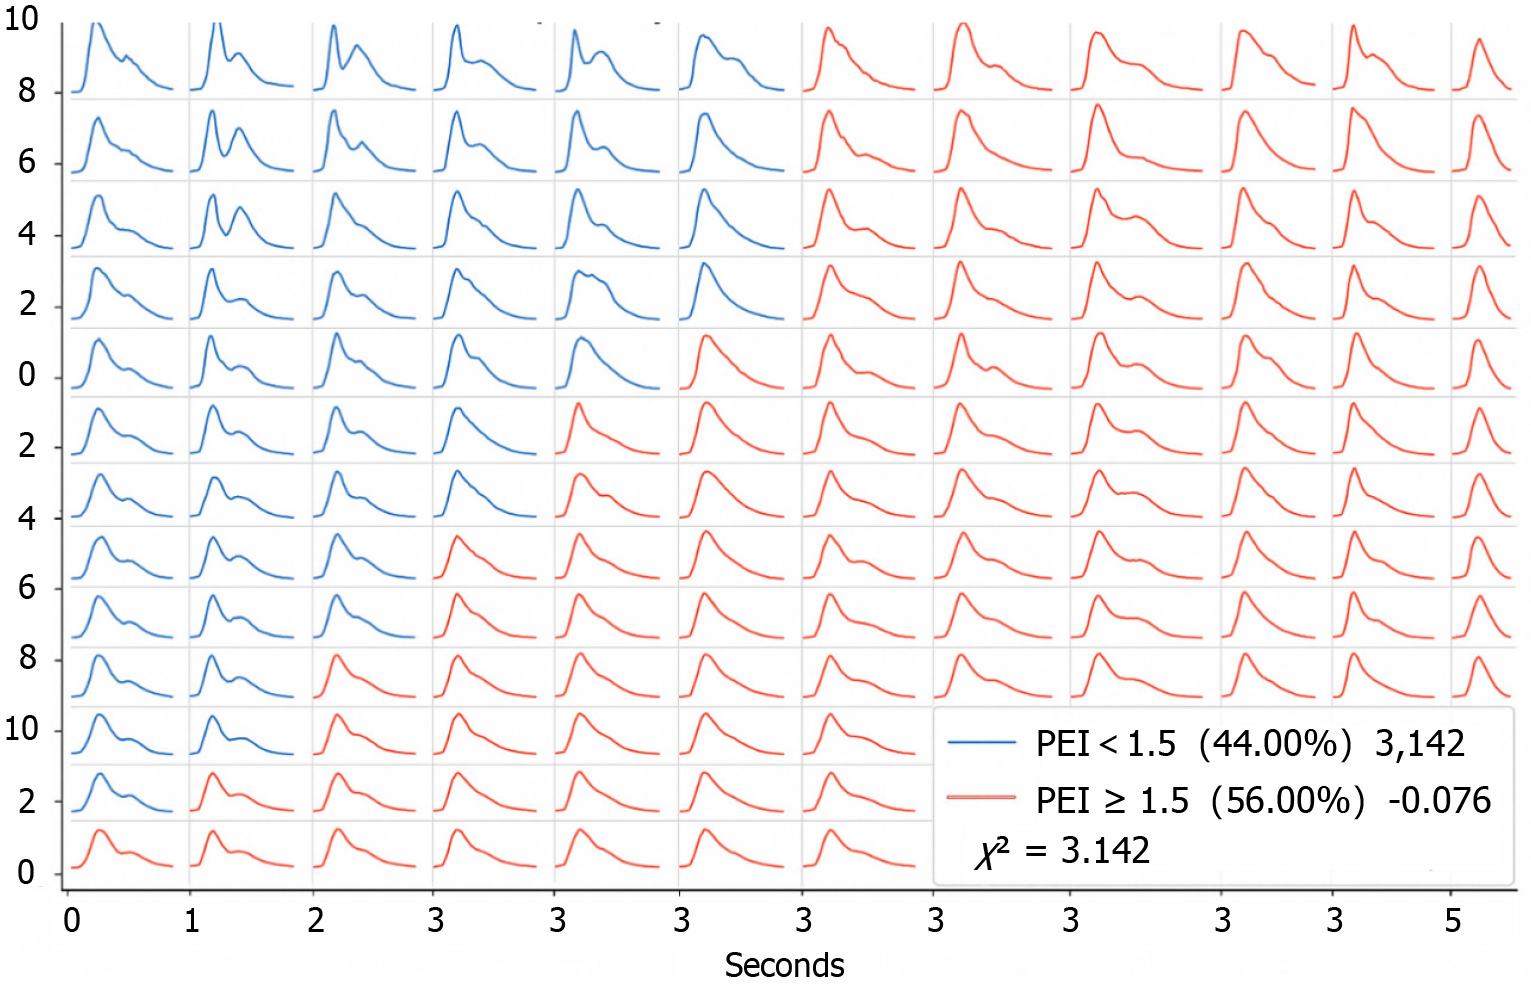
Figure 1 Peak enhancement intensity for the patients.
PEI: Peak enhancement intensity.
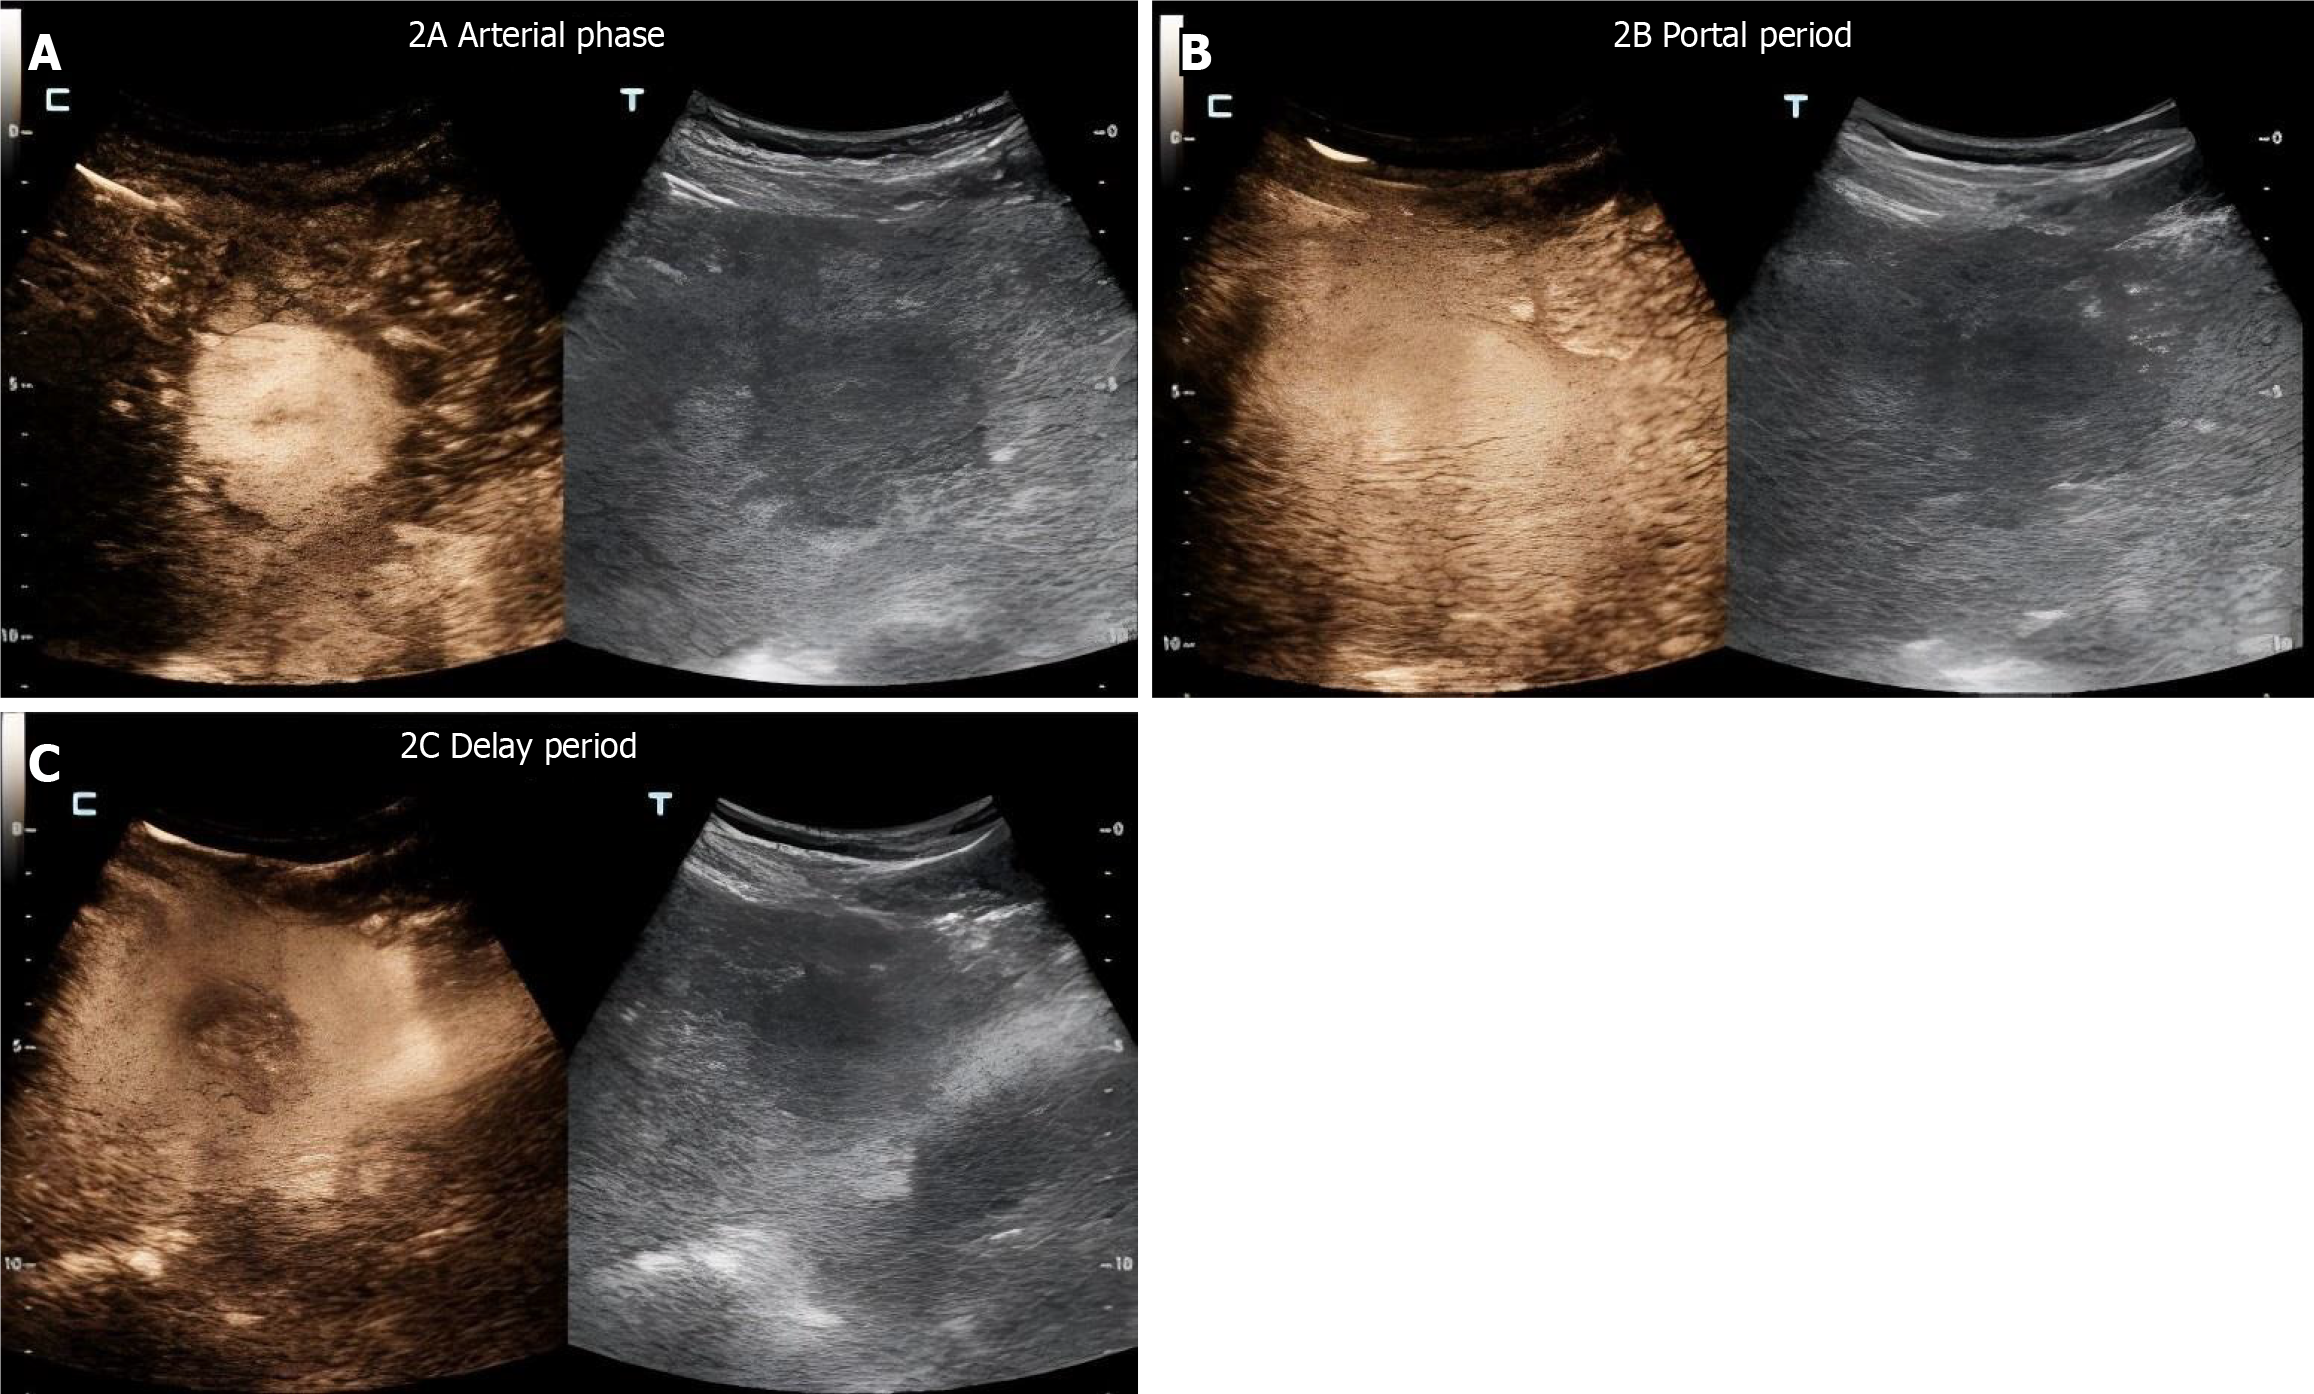
Figure 2 Edge detection of a lesion in a typical case.
A: Results of arterial phase detection. No significant abnormal enhancement is observed inside the hematoma or at the edge of the capsule during the arterial phase, and arterial bleeding is reduced after embolization; B: Results of portal phase detection, where the contrast agent enters the venous system through capillaries from the arteries, reflecting tissue gaps and microvascular permeability; C: Results of the delayed detection period, during which the contrast agent should gradually clear and abnormal enhancement indicates continuous bleeding or vascular leakage.
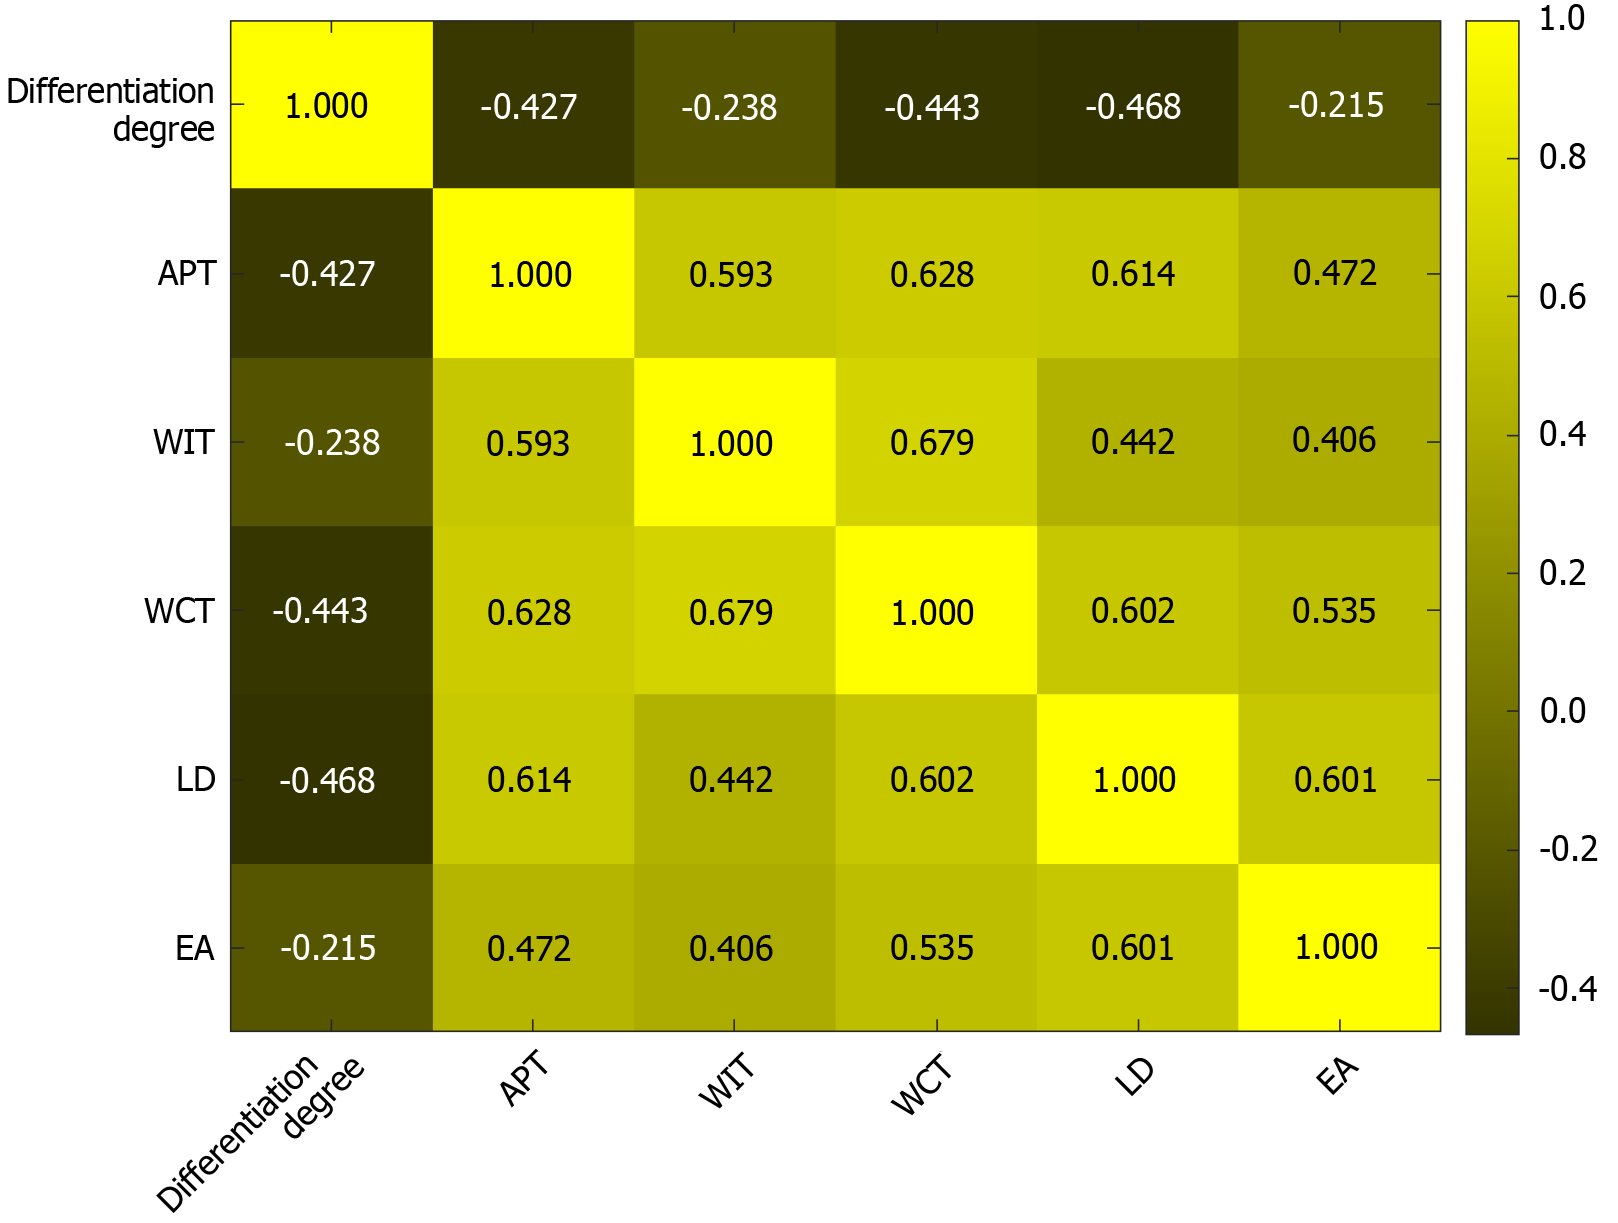
Figure 3 Correlation matrix.
APT: Arterial phase enhancement time; WIT: Washout initiation time; WCT: Washout completion time; LD: Longest diameter; EA: Enhanced area.
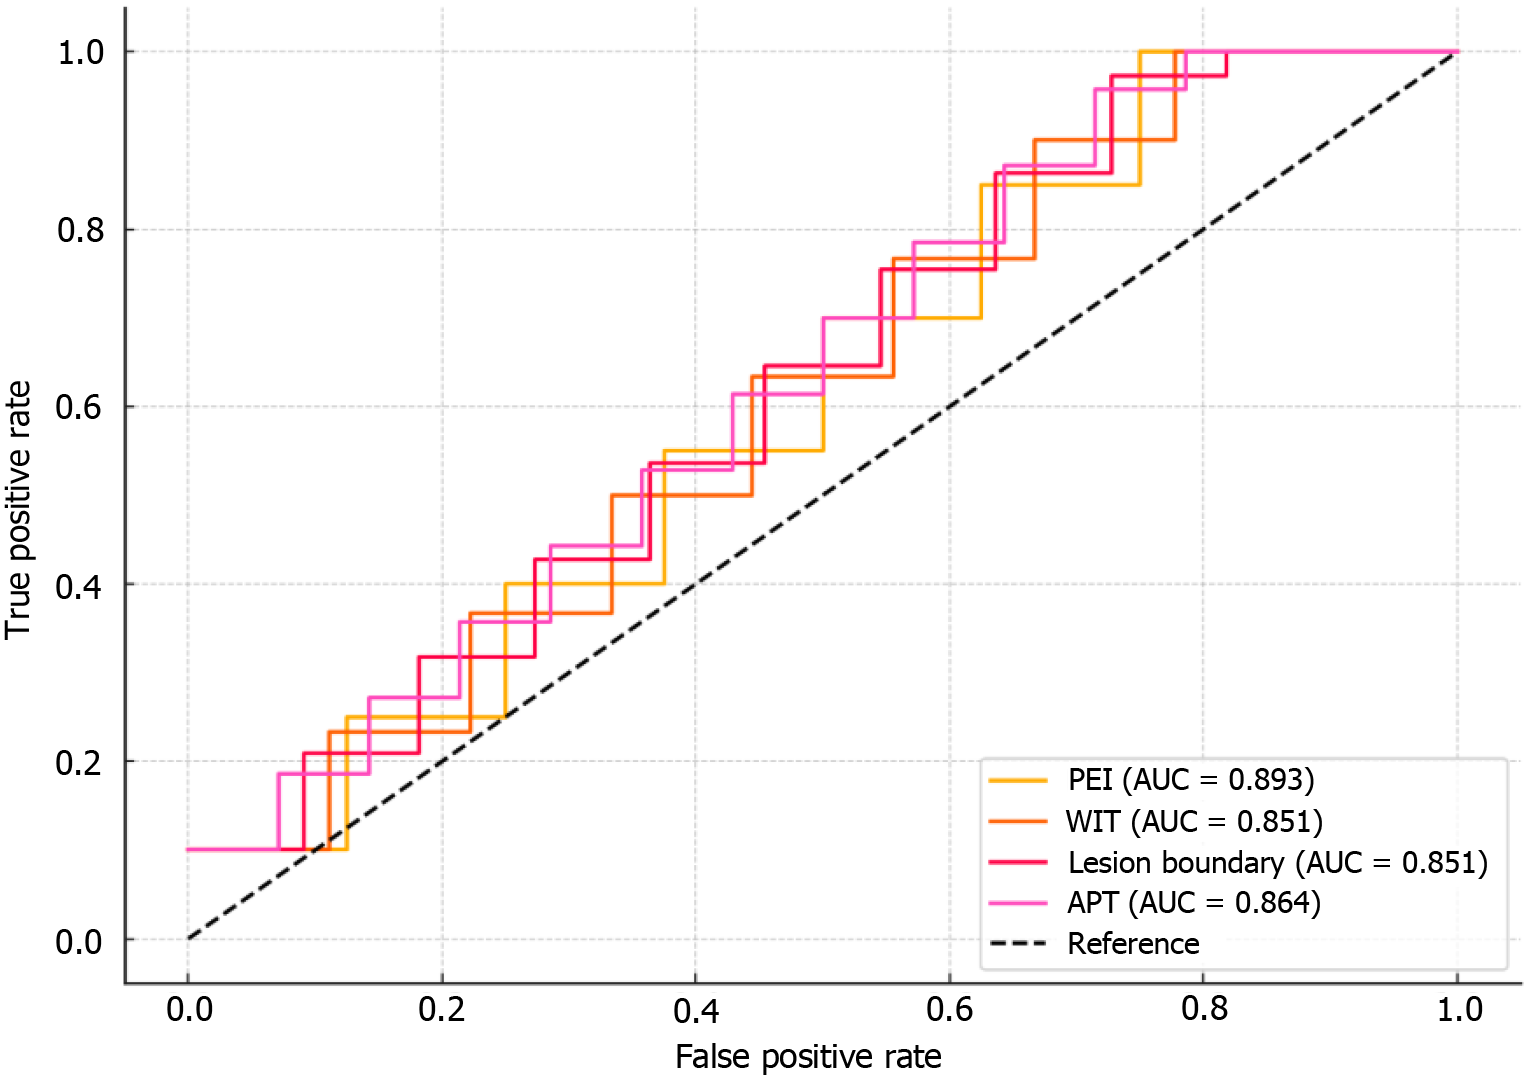
Figure 4 Receiver operating characteristic curve of each indicator.
PEI: Peak enhancement intensity; WIT: Washout initiation time; APT: Arterial phase enhancement time; AUC: Area under the curve.
- Citation: Dong Y, Chen LP, He JG, Yang QQ, Hu ZW. Clinical value of contrast-enhanced ultrasound in early diagnosis of hepatocellular carcinoma. World J Gastrointest Oncol 2025; 17(10): 109506
- URL: https://www.wjgnet.com/1948-5204/full/v17/i10/109506.htm
- DOI: https://dx.doi.org/10.4251/wjgo.v17.i10.109506


