©The Author(s) 2023.
World J Gastrointest Oncol. Jun 15, 2023; 15(6): 1051-1061
Published online Jun 15, 2023. doi: 10.4251/wjgo.v15.i6.1051
Published online Jun 15, 2023. doi: 10.4251/wjgo.v15.i6.1051
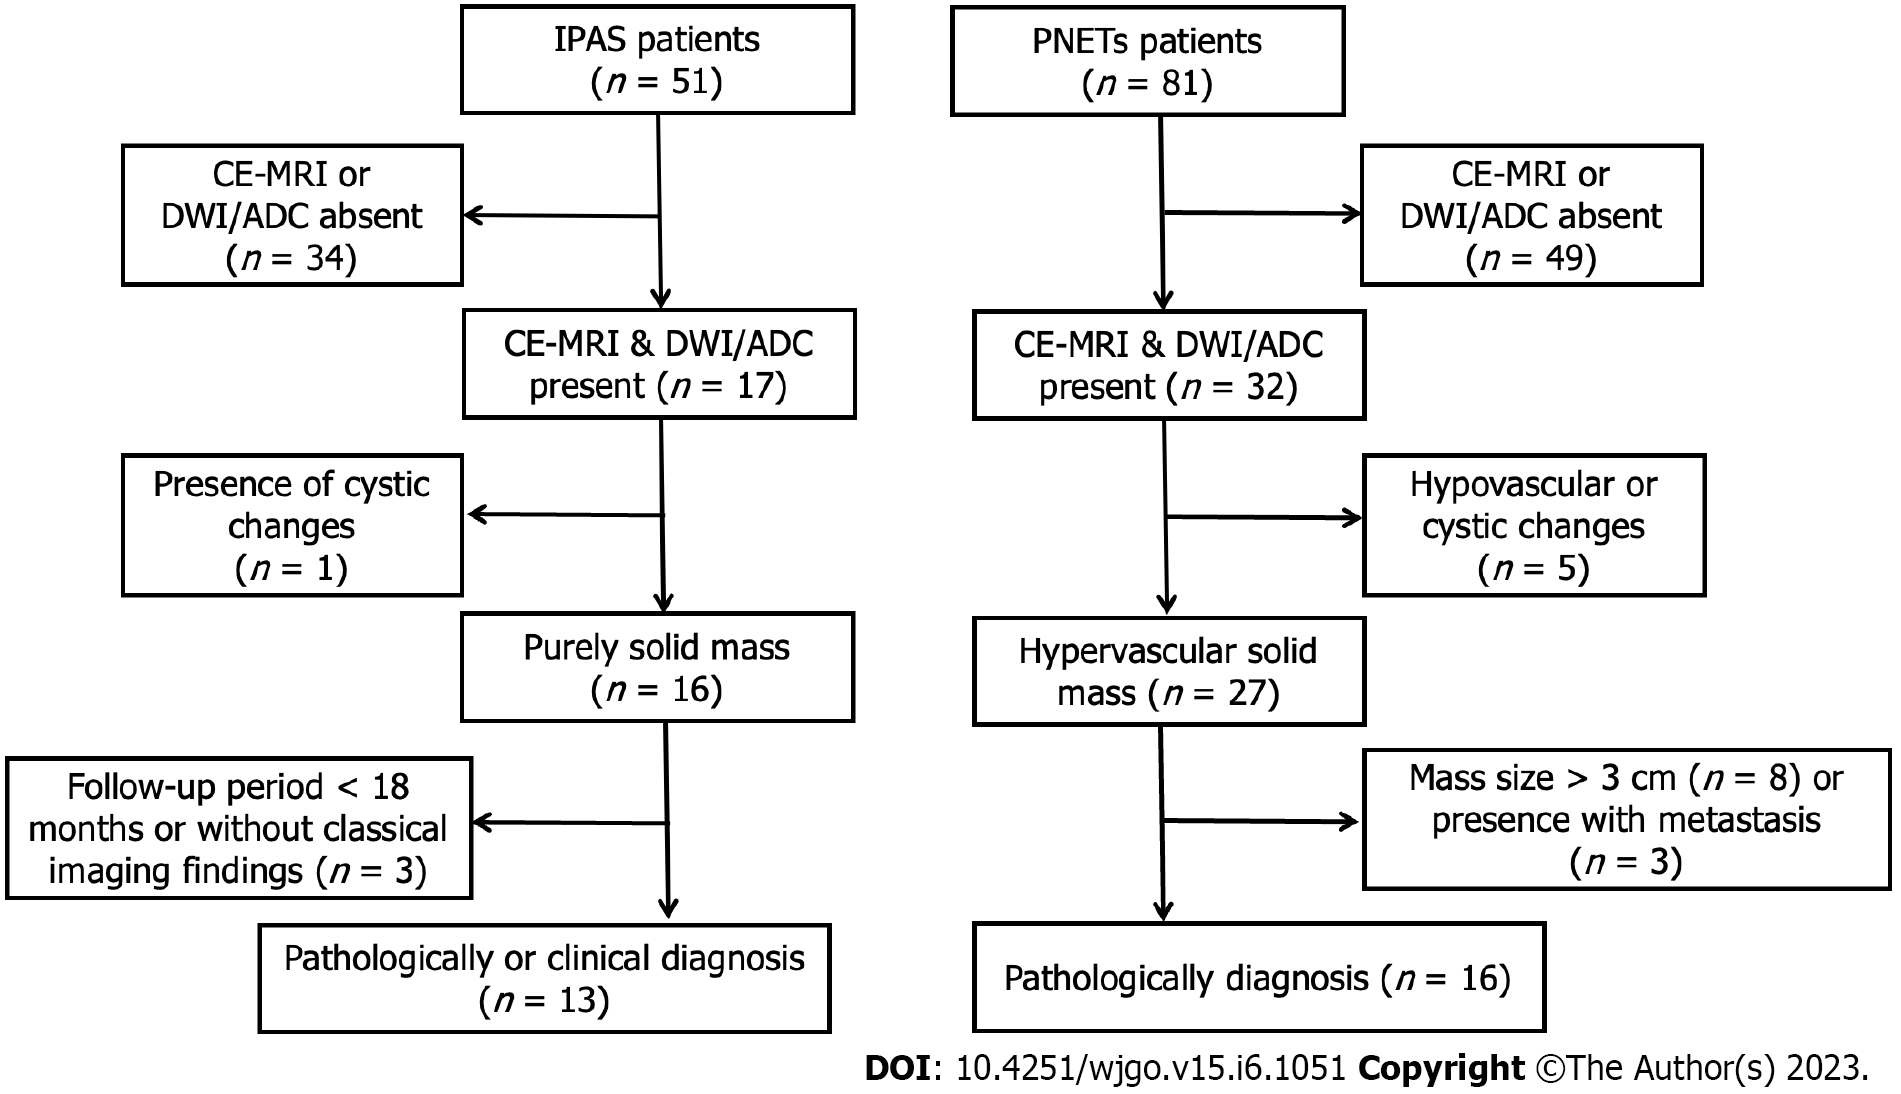
Figure 1 Flowchart of patients throughout the study.
ADC: Apparent diffusion coefficient; CE-MRI: Contrast-enhanced magnetic resonance imaging; DWI: Diffusion-weighted imaging; IPAS: Intrapancreatic accessory spleen; PNETs: Pancreatic neuroendocrine tumors.
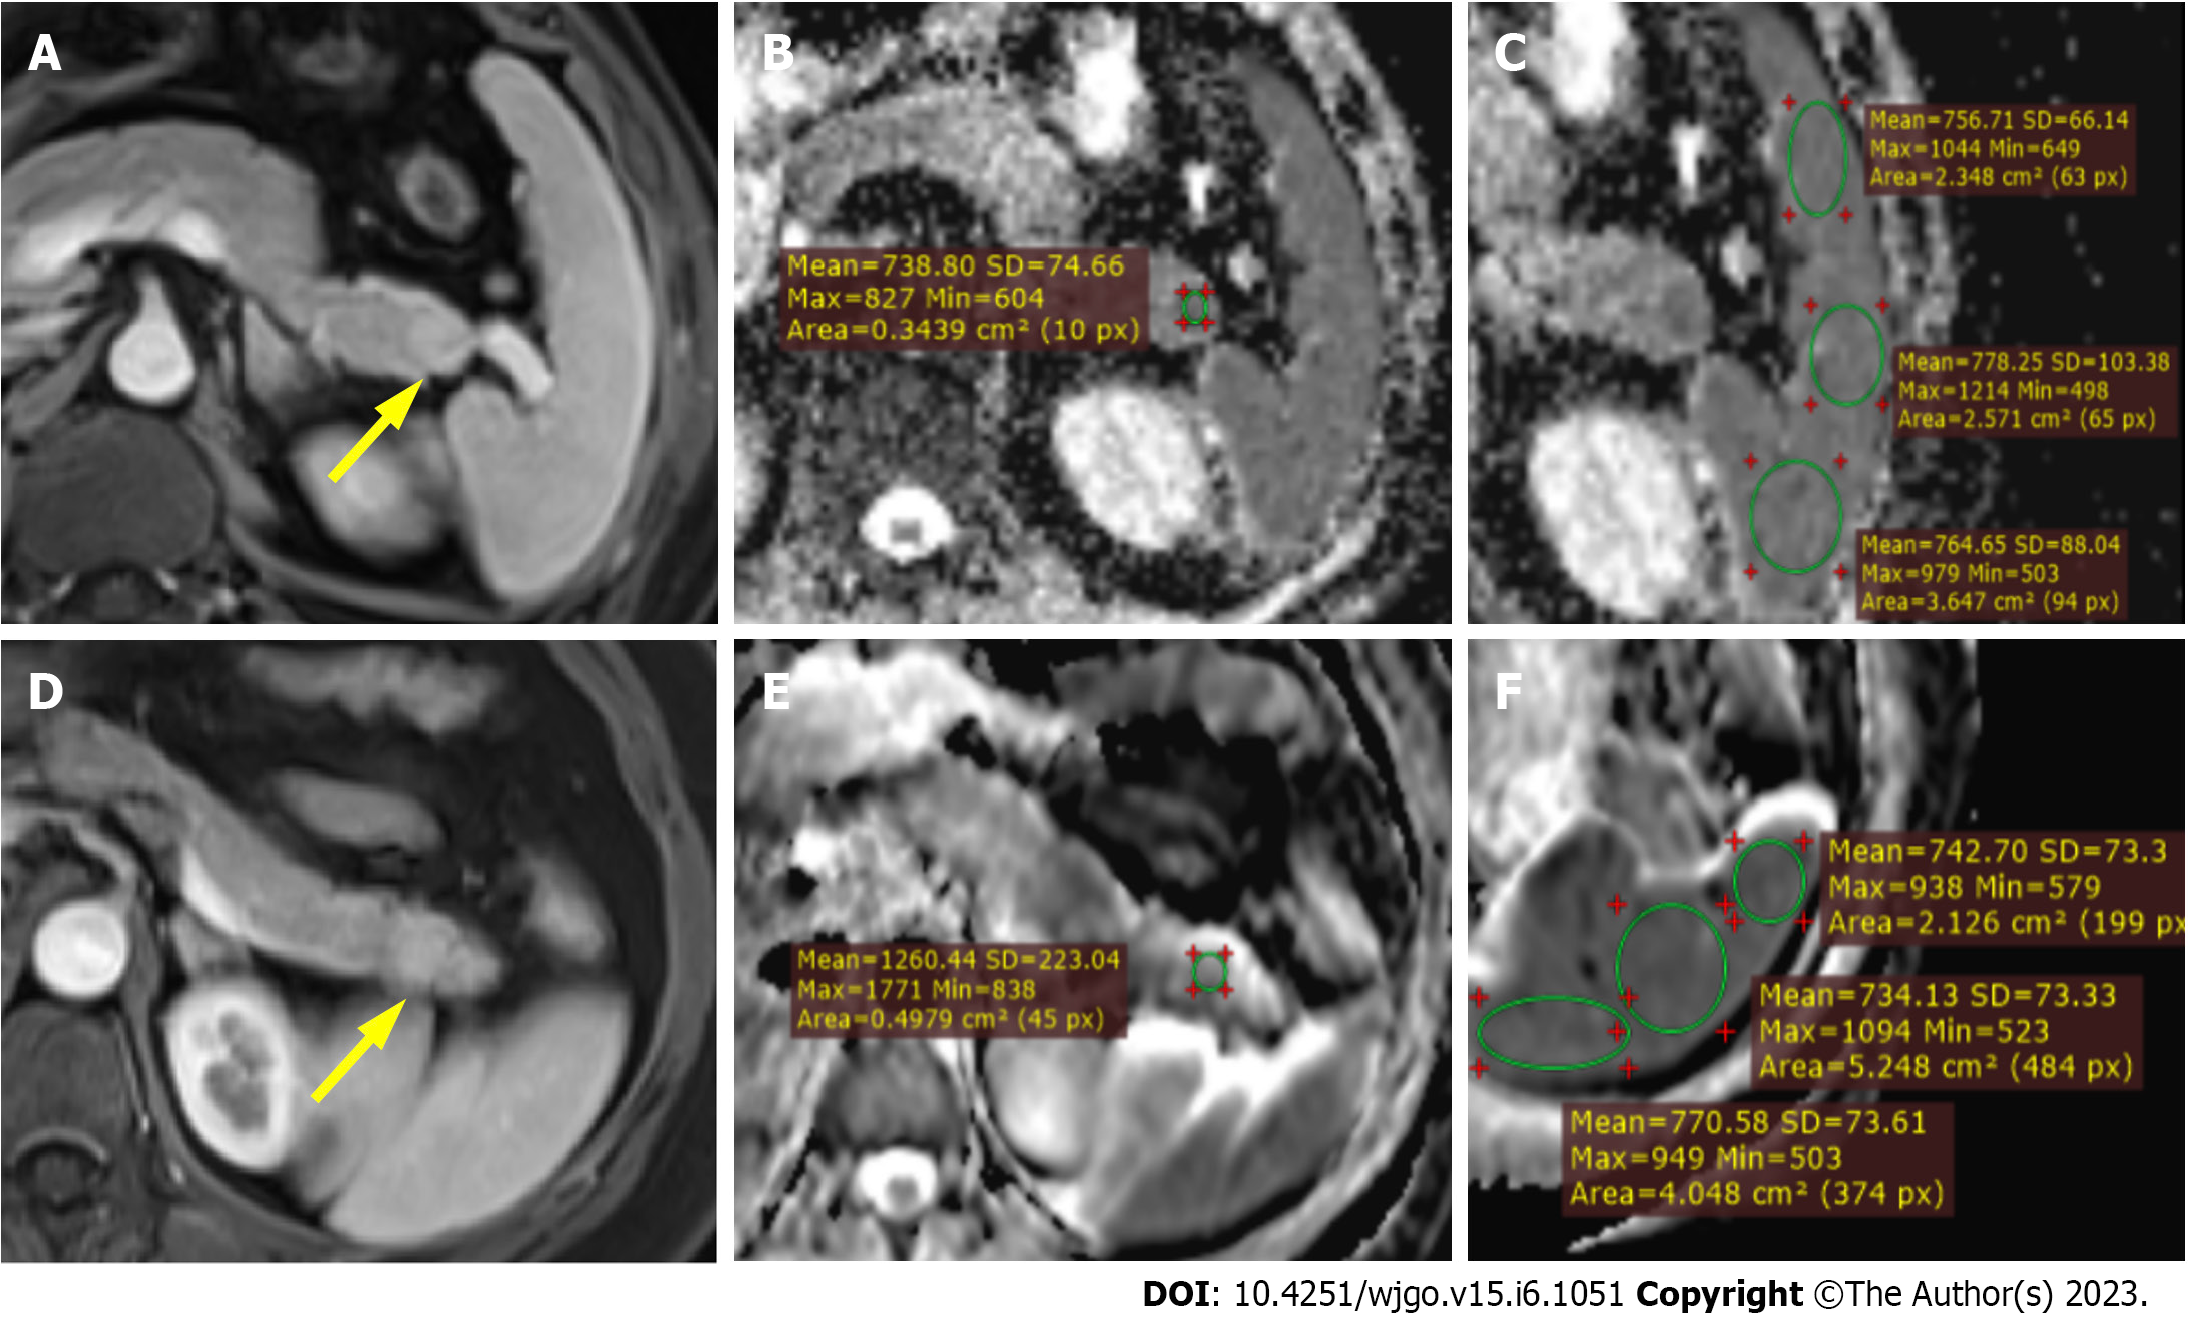
Figure 2 Magnetic resonance images.
A-C: Magnetic resonance images in a 51-year-old male with pathologically proven intrapancreatic accessory spleen. The lesion was located at the tail of the pancreas with a hypervascular enhancement pattern on contrast-enhanced arterial phase T1 weighted imaging (T1WI) (yellow arrow, A). After confirming the lesion on arterial phase T1WI and diffusion-weighted imaging (B), circular regions of interest (ROI) were placed within the lesion on the apparent diffusion coefficient (ADC) map (B) and showed an ADC value of 0.738 × 10⁻³ mm2/s. Similarly, ADC measurement was carried out on the adjacent spleen using circular ROIs (C) and demonstrated an average splenic ADC of 0.767 × 10⁻³ mm2/s. The normalized ADC (lesion-to-spleen ADC ratio) was 0.962; D-F: Magnetic resonance images in a 45-year-old female with pathologically proven G2 pancreatic neuroendocrine tumor. The lesion was located at the tail of the pancreas with a hypervascular enhancement pattern on contrast-enhanced arterial phase T1WI (yellow arrow, D). After confirming the lesion on arterial phase T1WI and diffusion-weighted imaging (B), circular ROI was placed within the lesion on the ADC map (B) and showed an ADC value of 1.260 × 10⁻³ mm2/s. Similarly, ADC measurement was carried out on the adjacent spleen using circular ROIs (C) and demonstrated an average splenic ADC of 0.749 × 10⁻³ mm2/s. The normalized ADC (lesion-to-spleen ADC ratio) was 1.682.
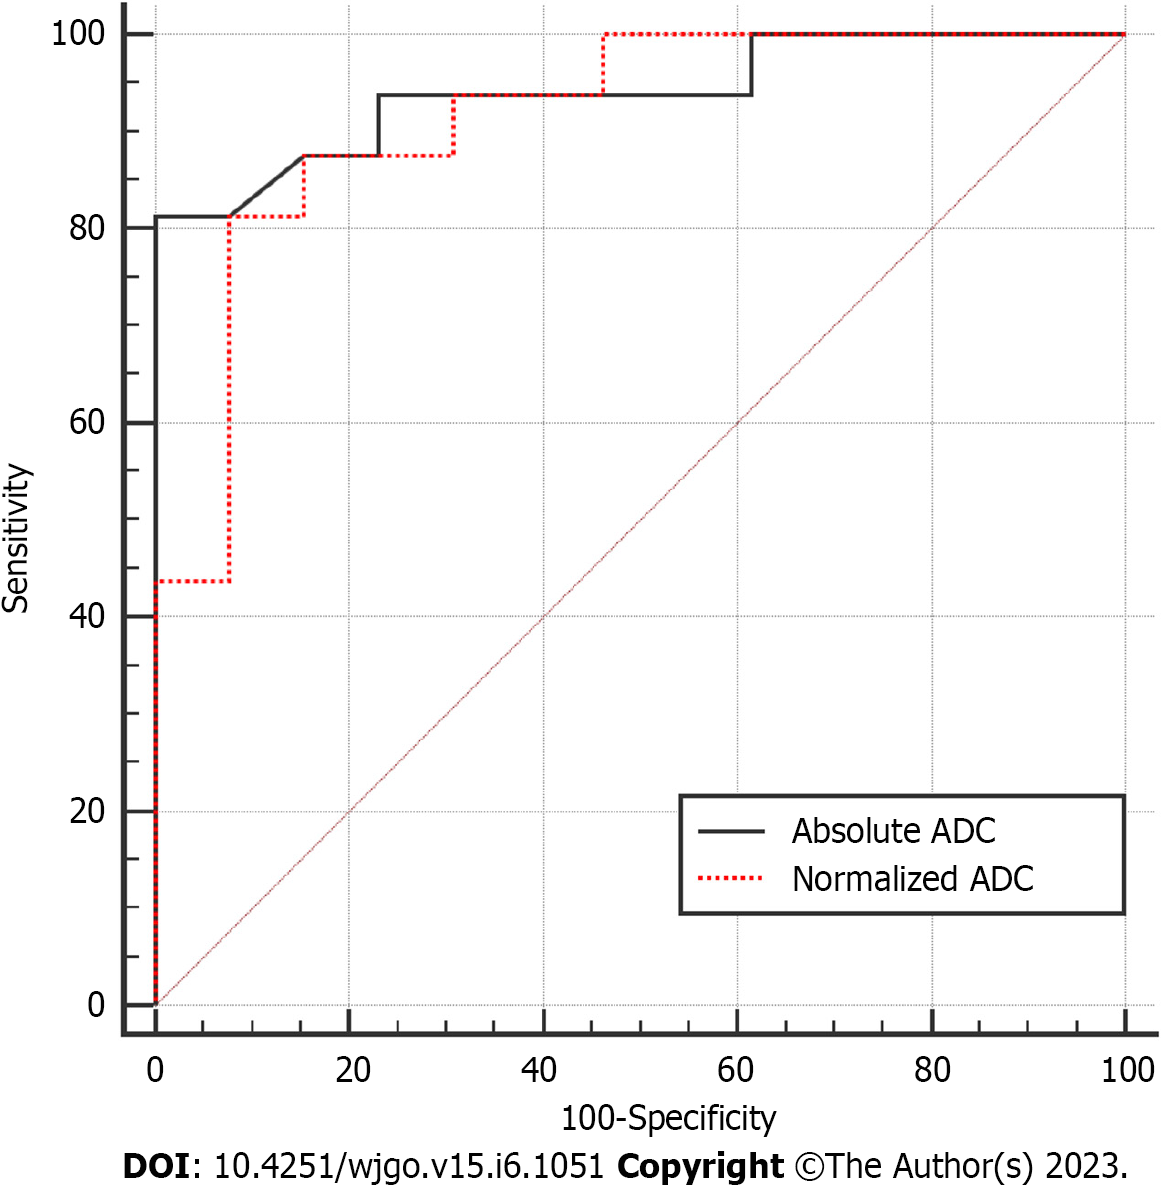
Figure 3 Receiver operating characteristic curve for diagnostic performance of absolute apparent diffusion coefficient and normalized apparent diffusion coefficient values regarding the differentiation between intrapancreatic accessory spleen and pancreatic neuroendocrine tumor.
ADC: Apparent diffusion coefficient.
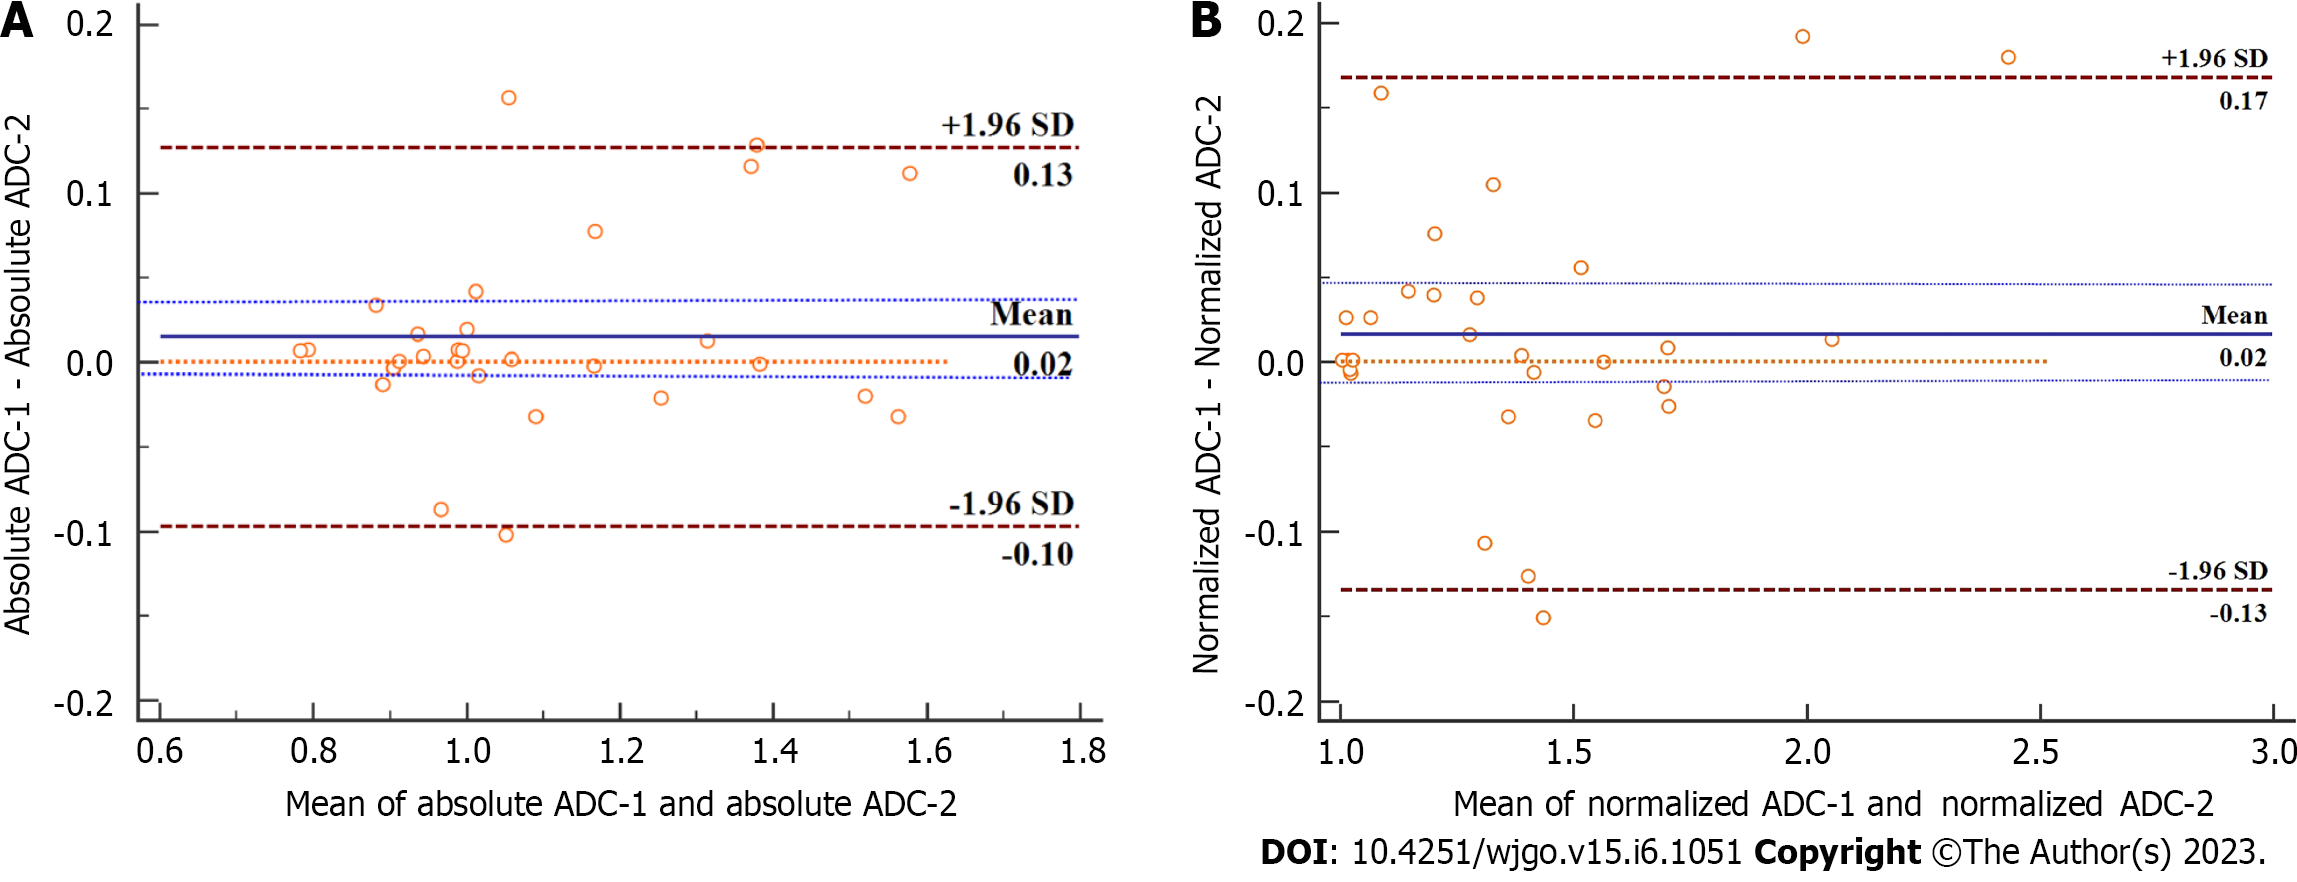
Figure 4 Bland-Altman plots of absolute apparent diffusion coefficient and normalized apparent diffusion coefficient for the two readers’ measurements with the representation of the 95% limits of agreement (dotted and dashed brown lines).
A: Absolute apparent diffusion coefficient (ADC); B: Normalized ADC. For both absolute ADC and normalized ADC values, the bias between two readers (solid blue line) was not significant, with the line of equality (dotted orange line) falling within the 95% confidence interval of the mean difference (dashed blue lines). SD: Standard deviation.
- Citation: Ren S, Guo K, Li Y, Cao YY, Wang ZQ, Tian Y. Diagnostic accuracy of apparent diffusion coefficient to differentiate intrapancreatic accessory spleen from pancreatic neuroendocrine tumors. World J Gastrointest Oncol 2023; 15(6): 1051-1061
- URL: https://www.wjgnet.com/1948-5204/full/v15/i6/1051.htm
- DOI: https://dx.doi.org/10.4251/wjgo.v15.i6.1051


