Copyright
©The Author(s) 2020.
World J Gastrointest Oncol. Nov 15, 2020; 12(11): 1346-1363
Published online Nov 15, 2020. doi: 10.4251/wjgo.v12.i11.1346
Published online Nov 15, 2020. doi: 10.4251/wjgo.v12.i11.1346
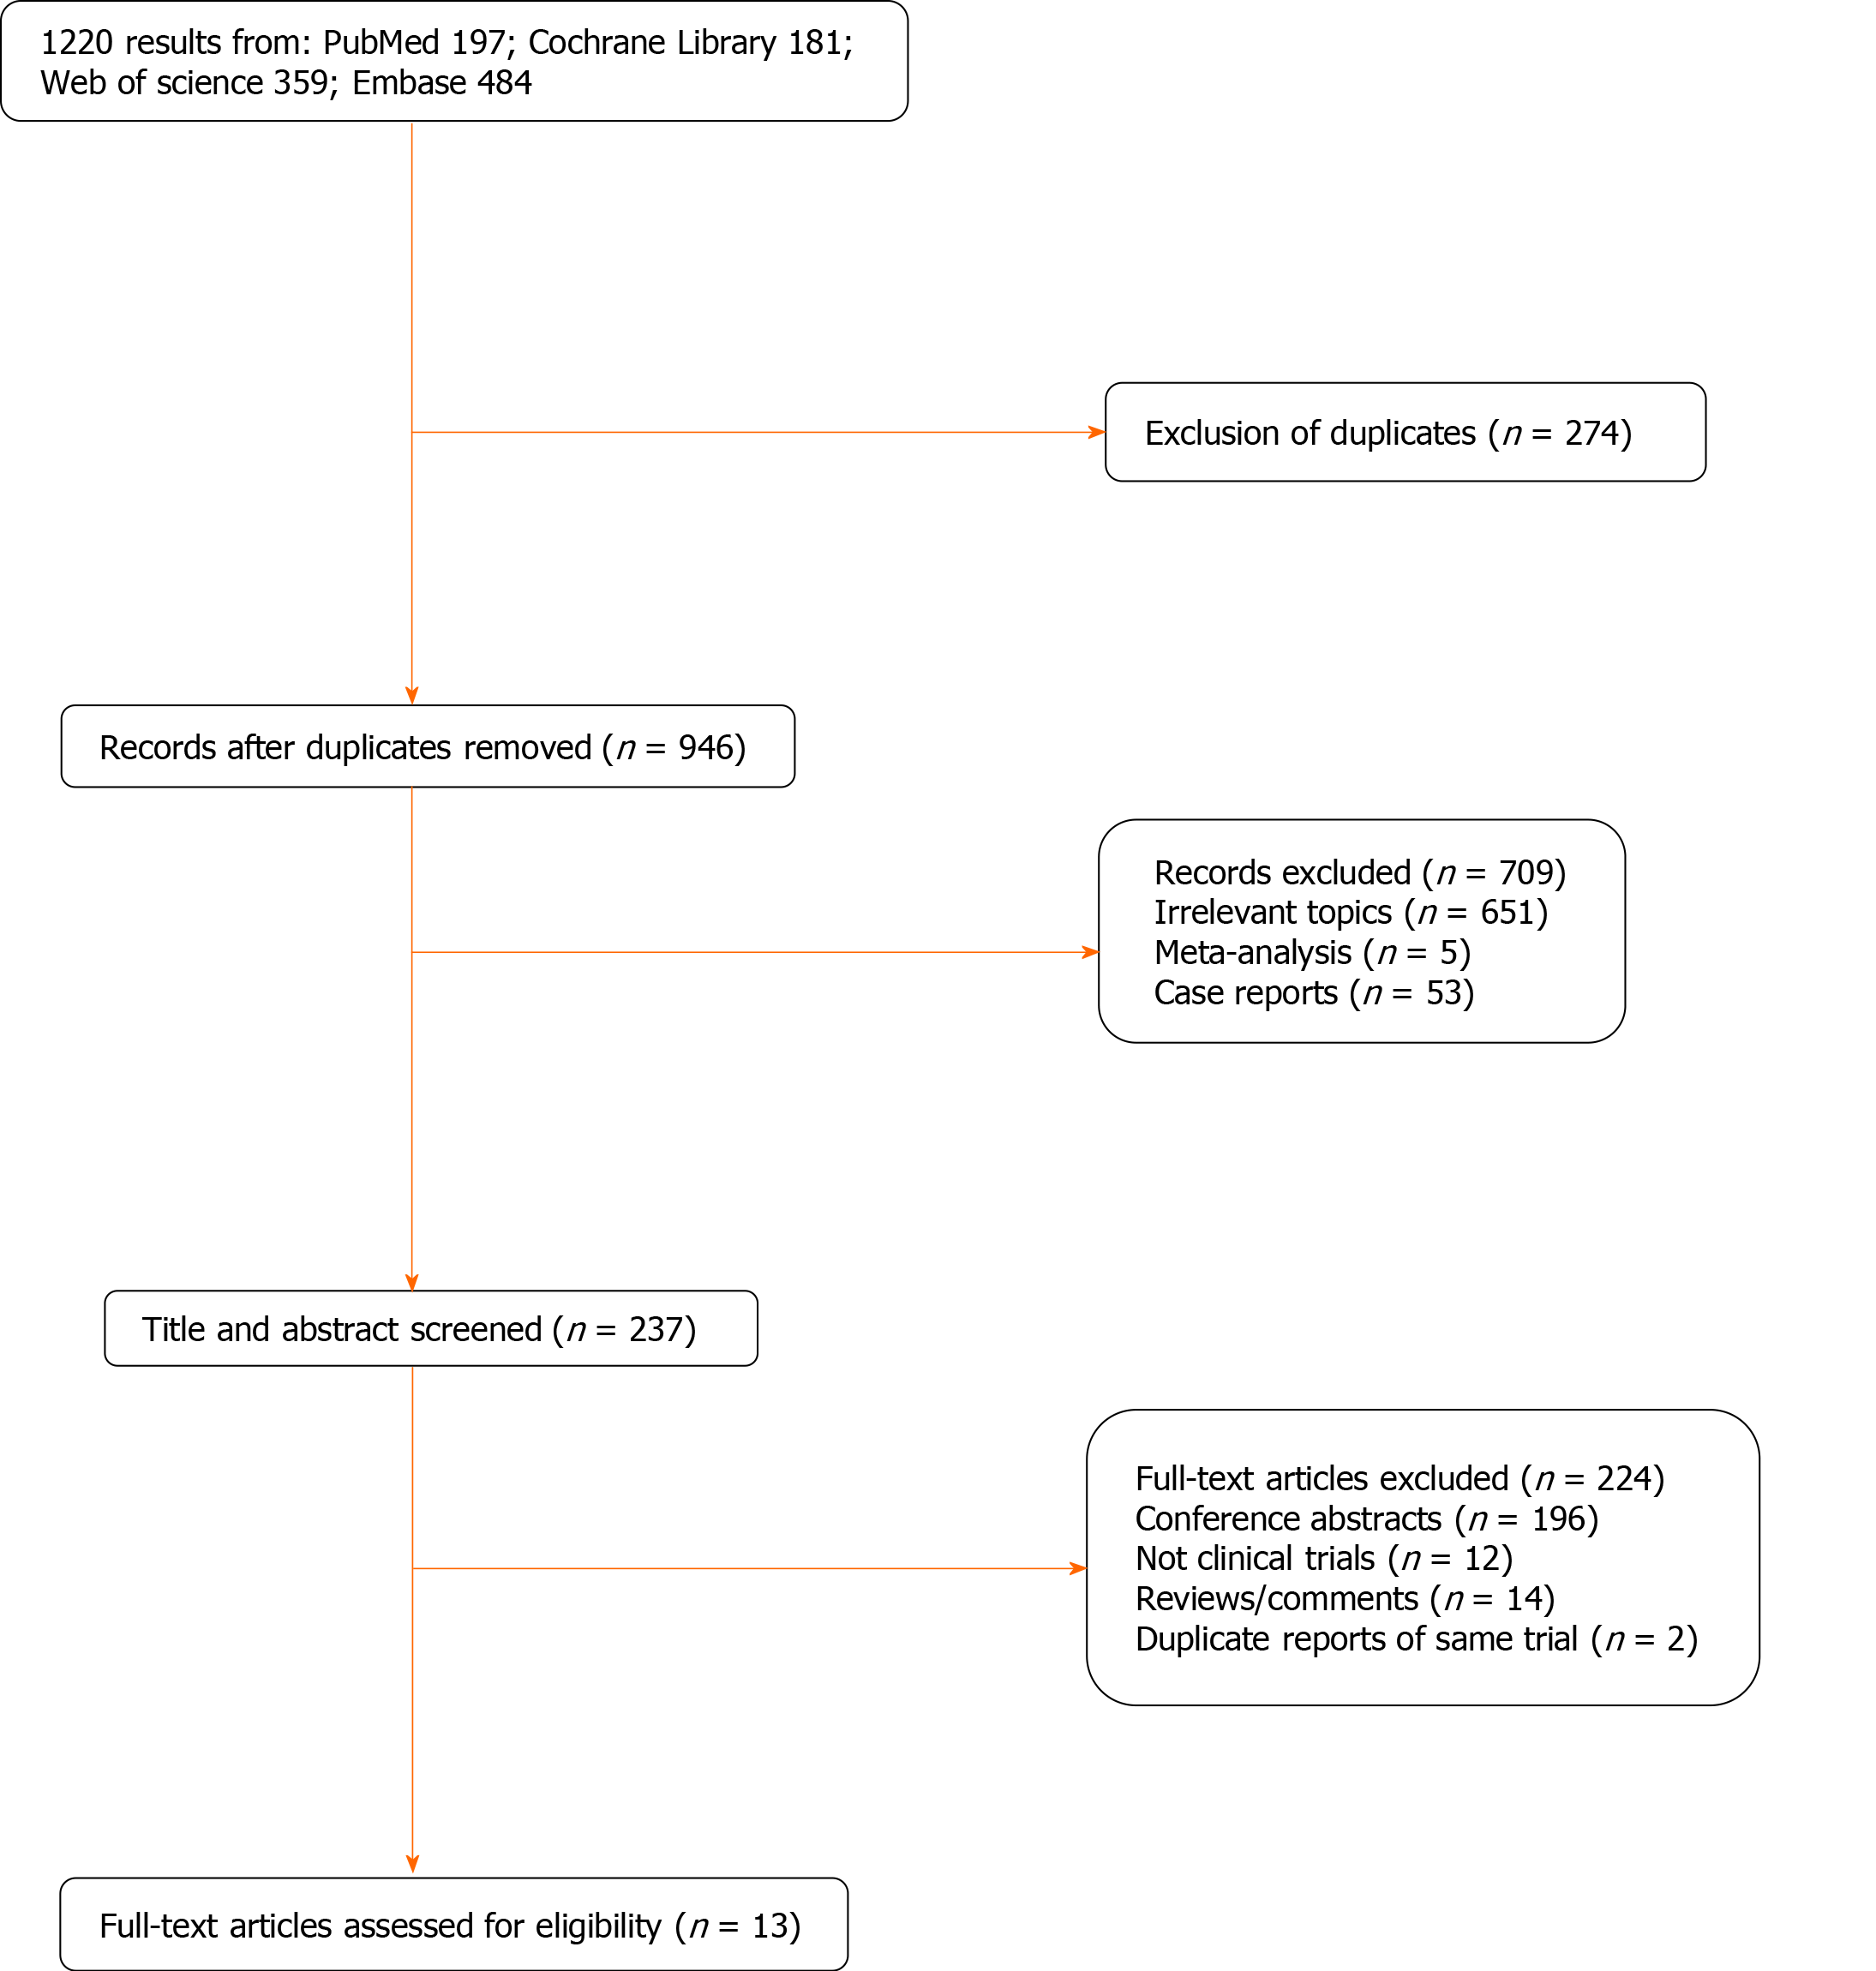
Figure 1 Record selection process.
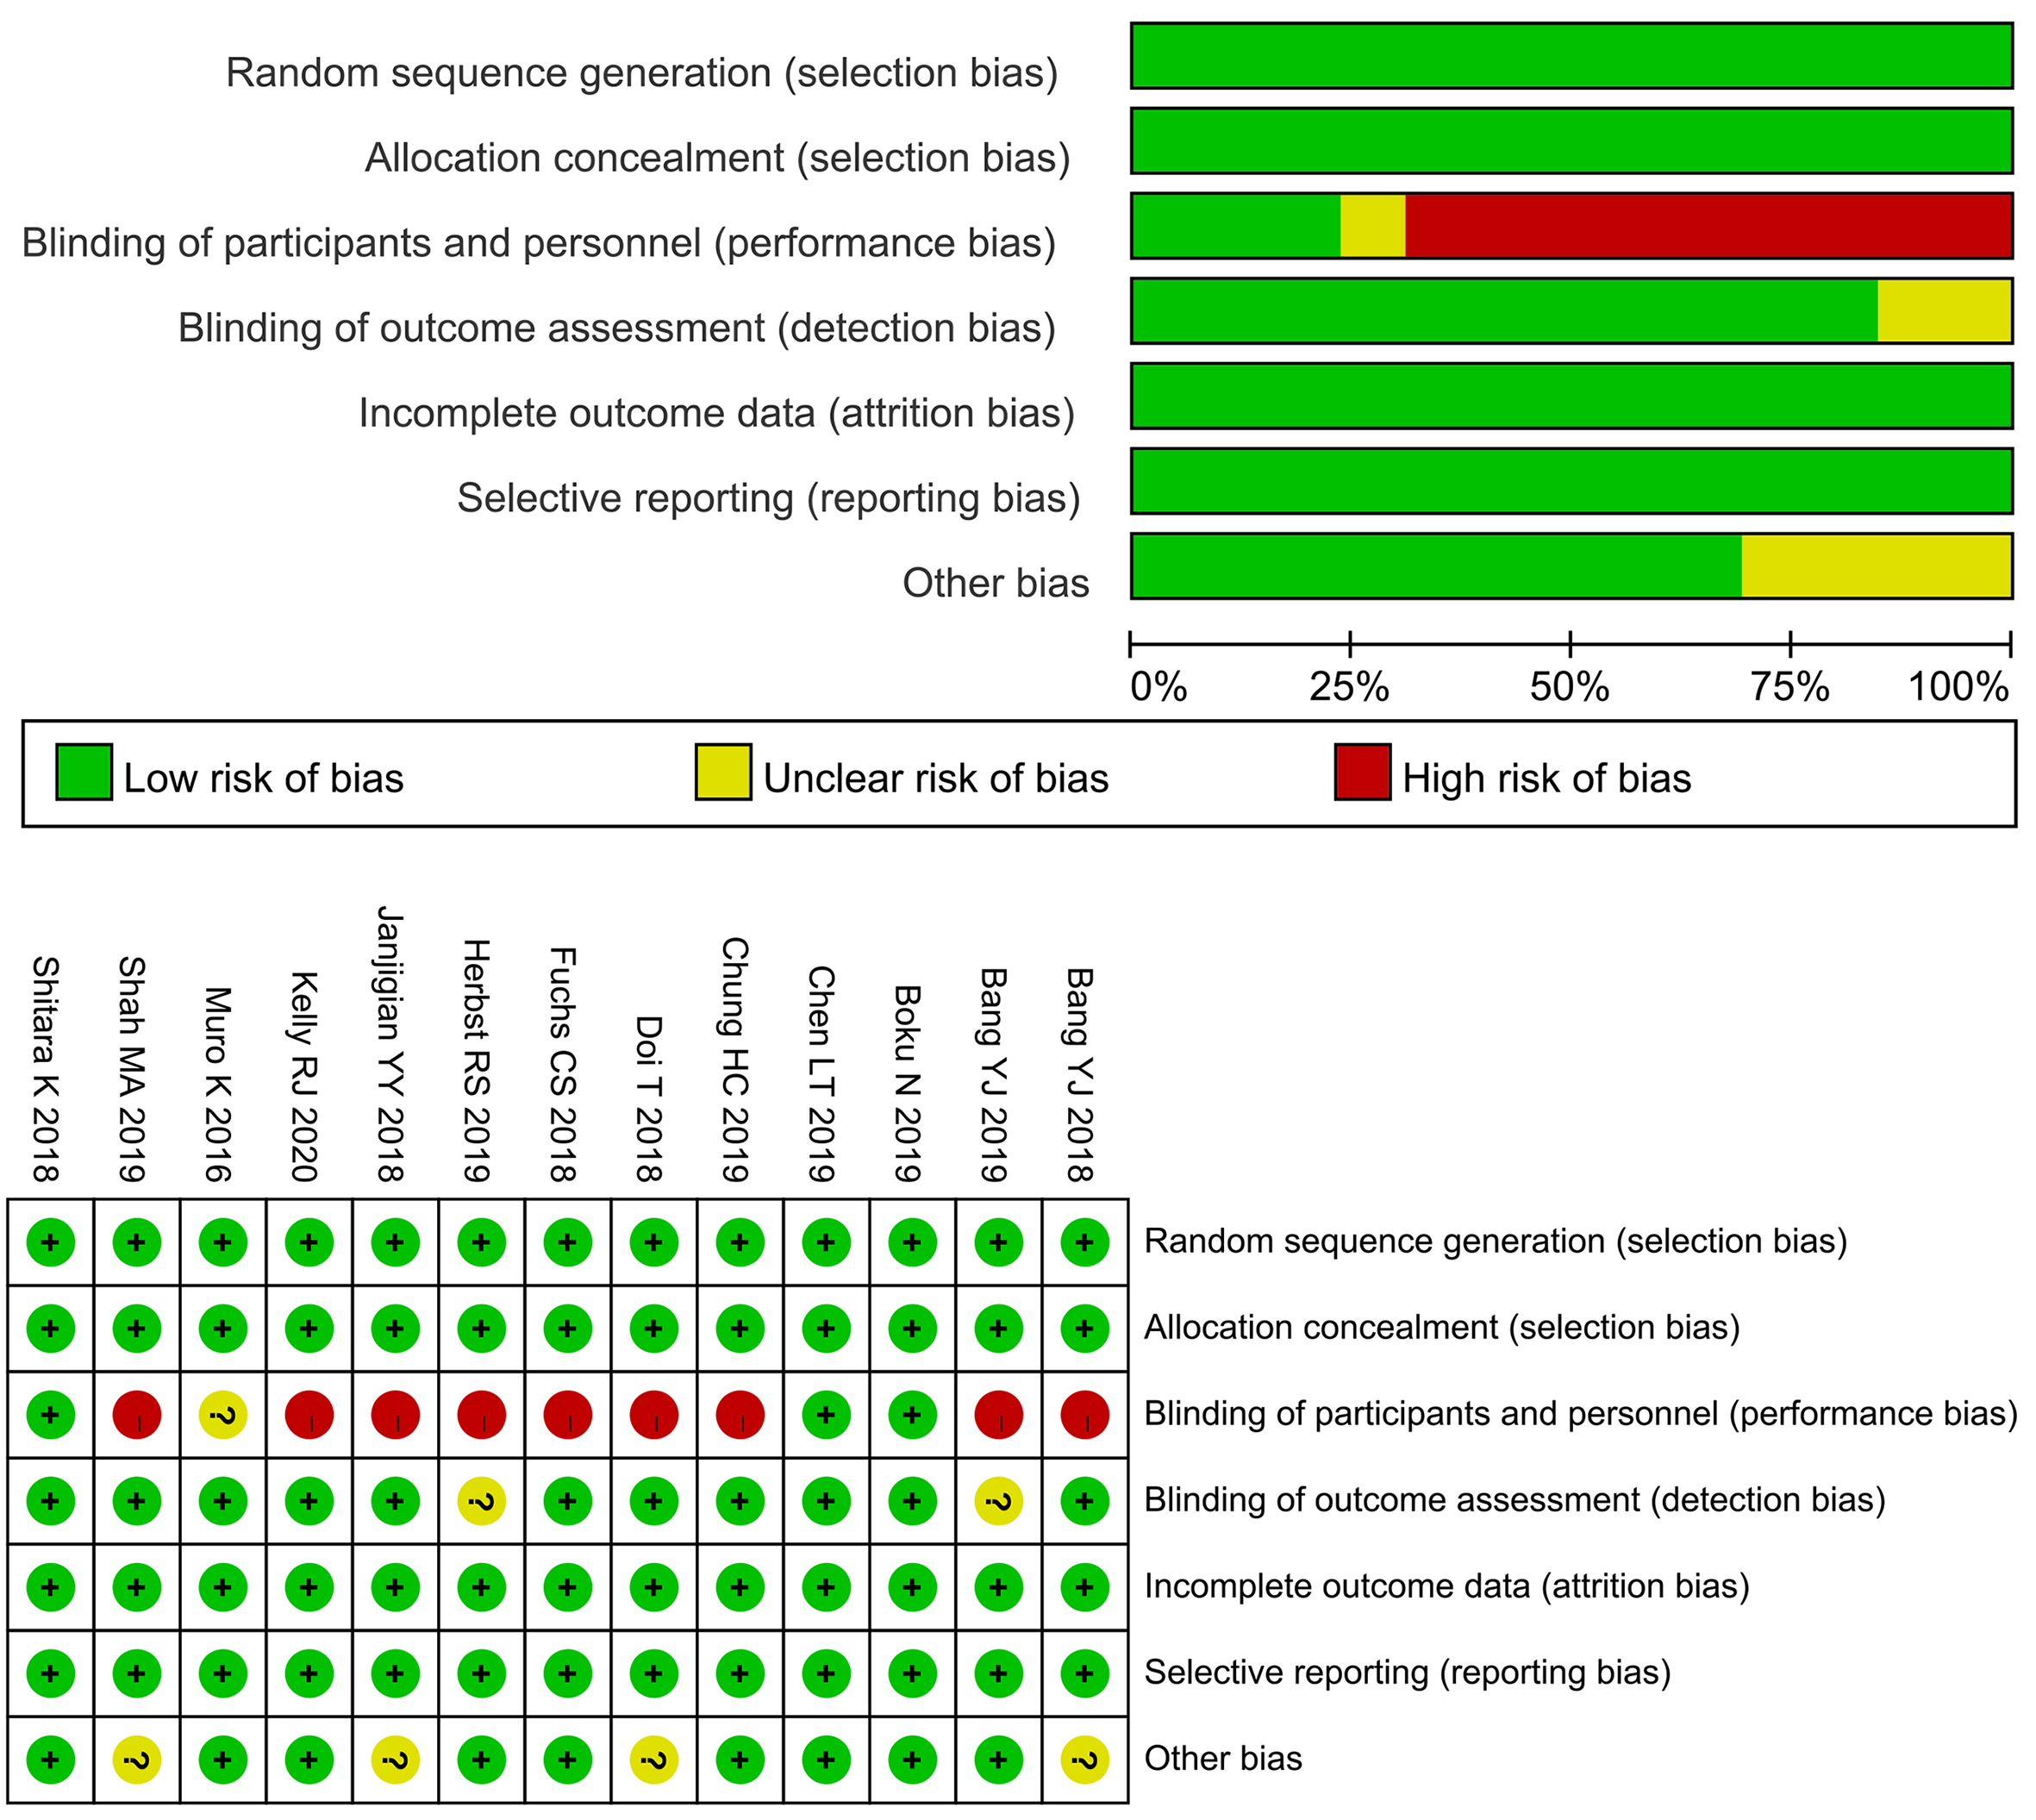
Figure 2 Risk of bias graph and summary.
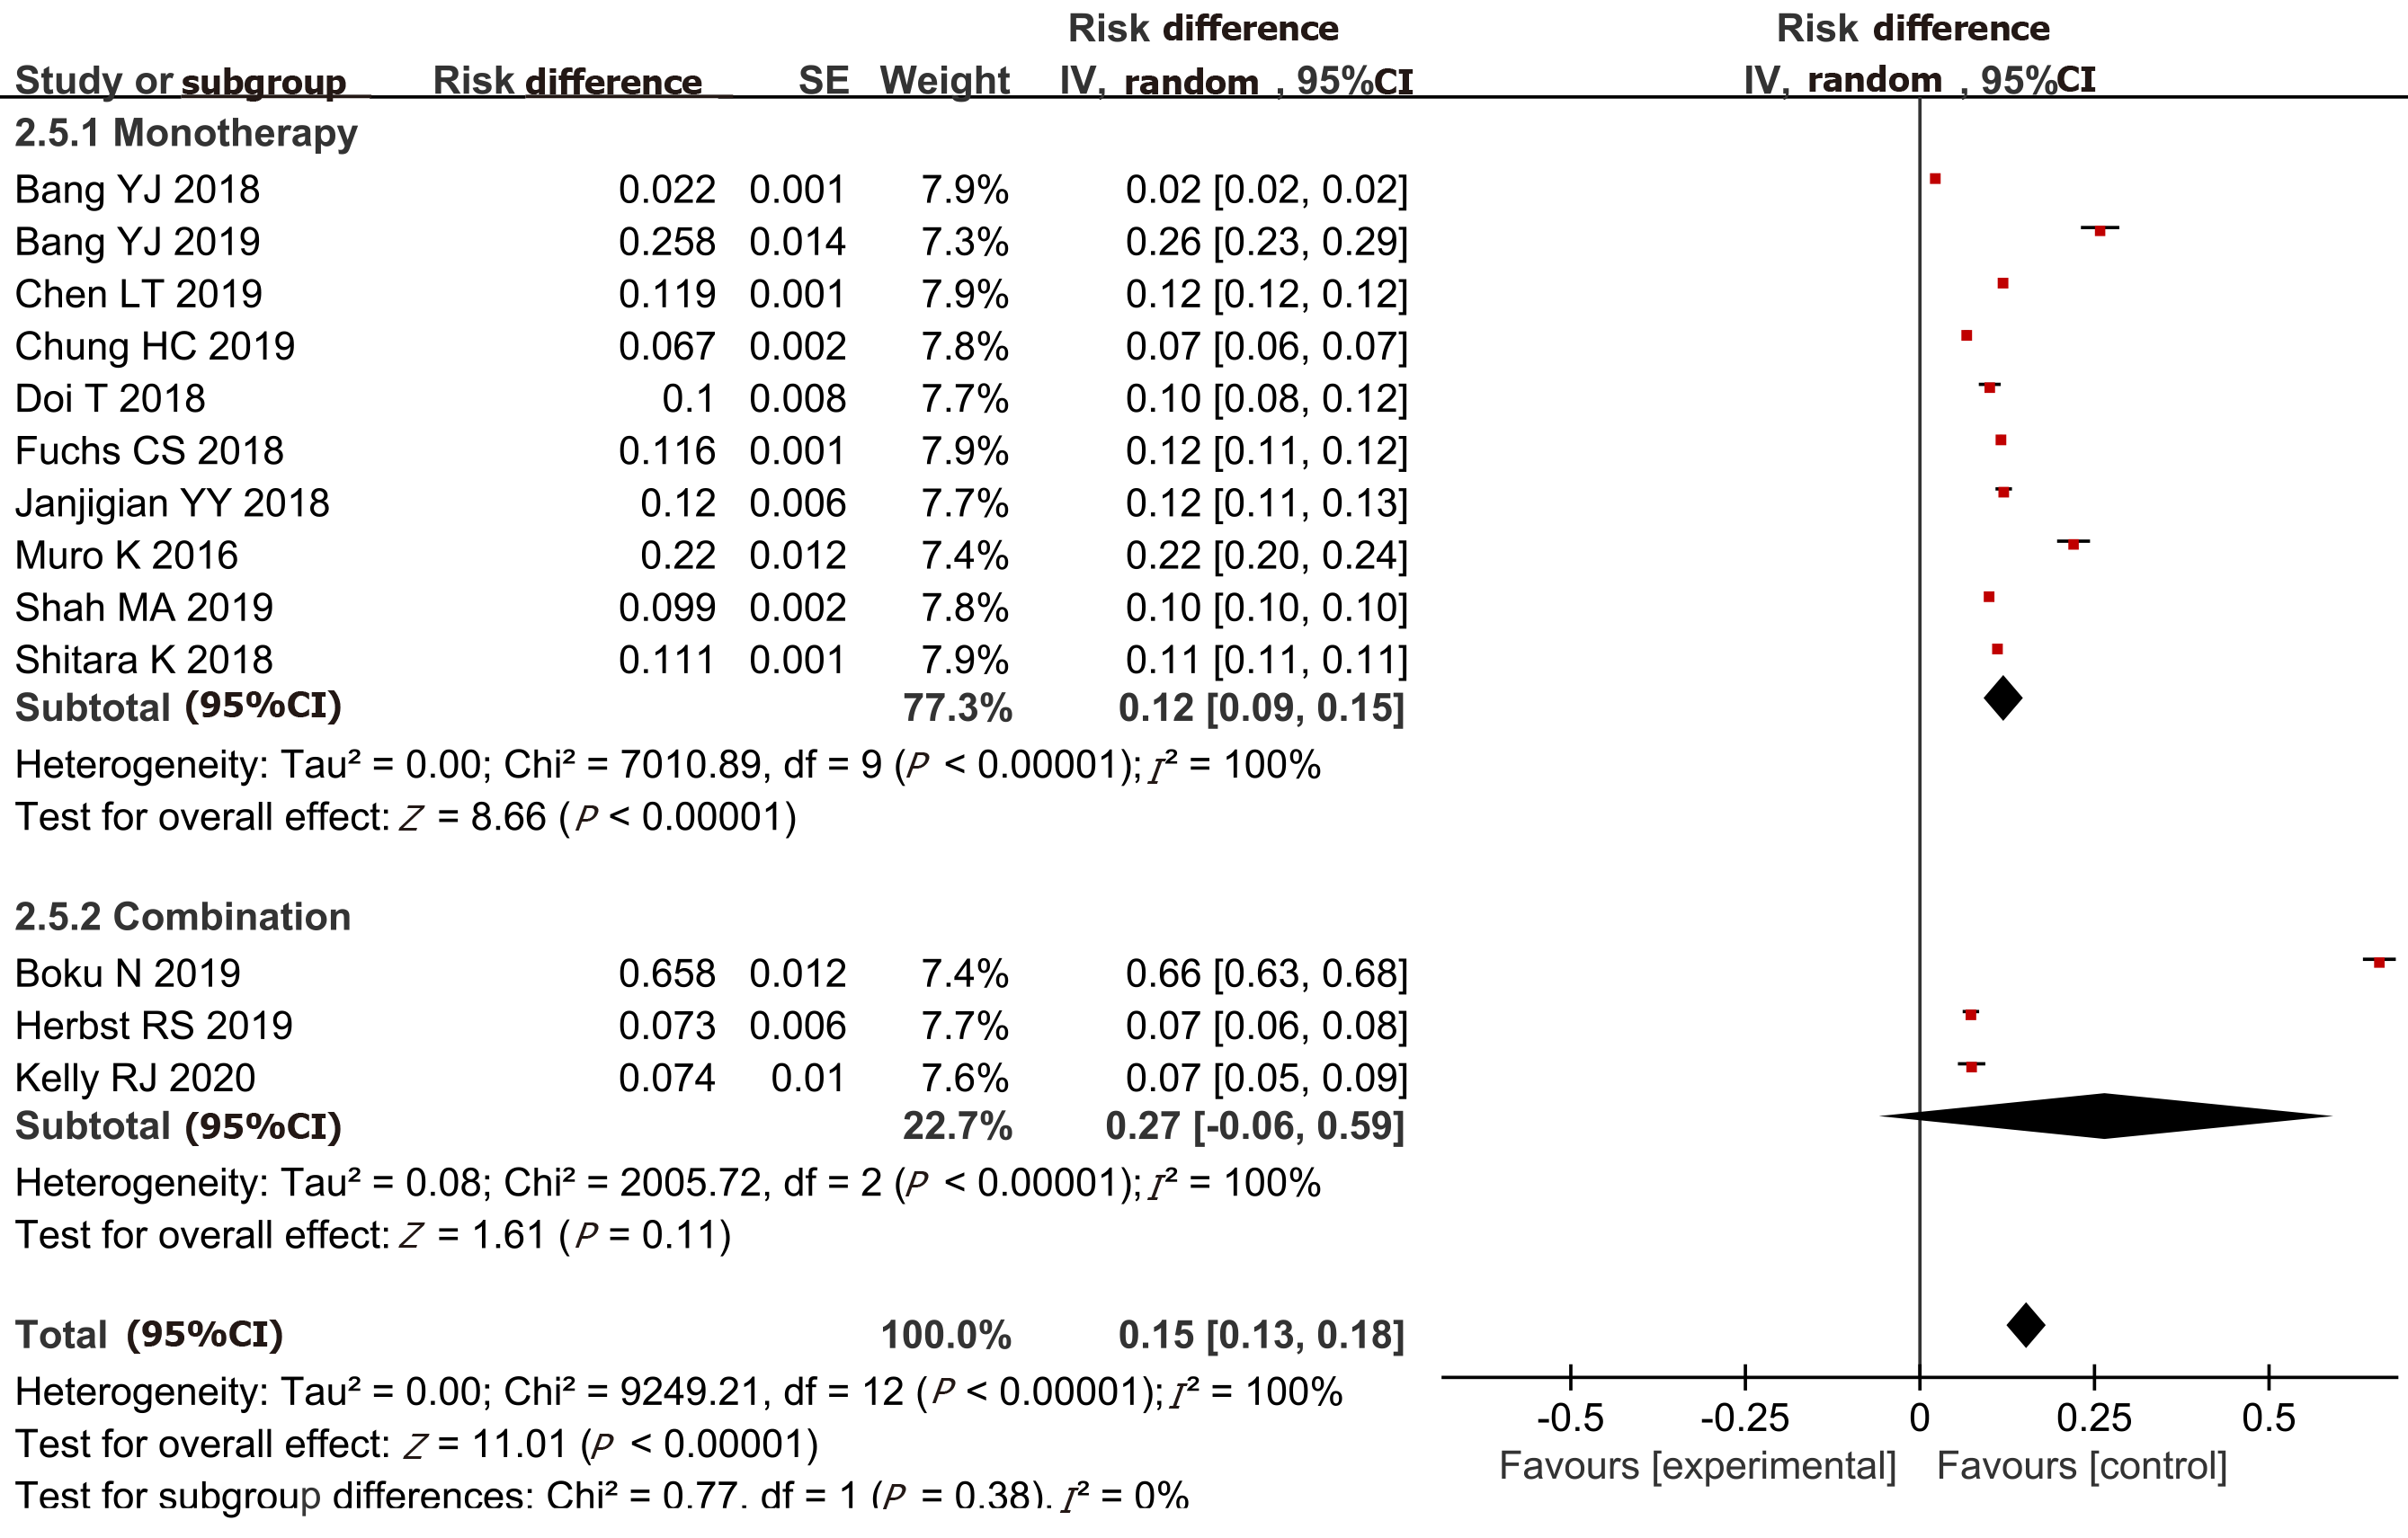
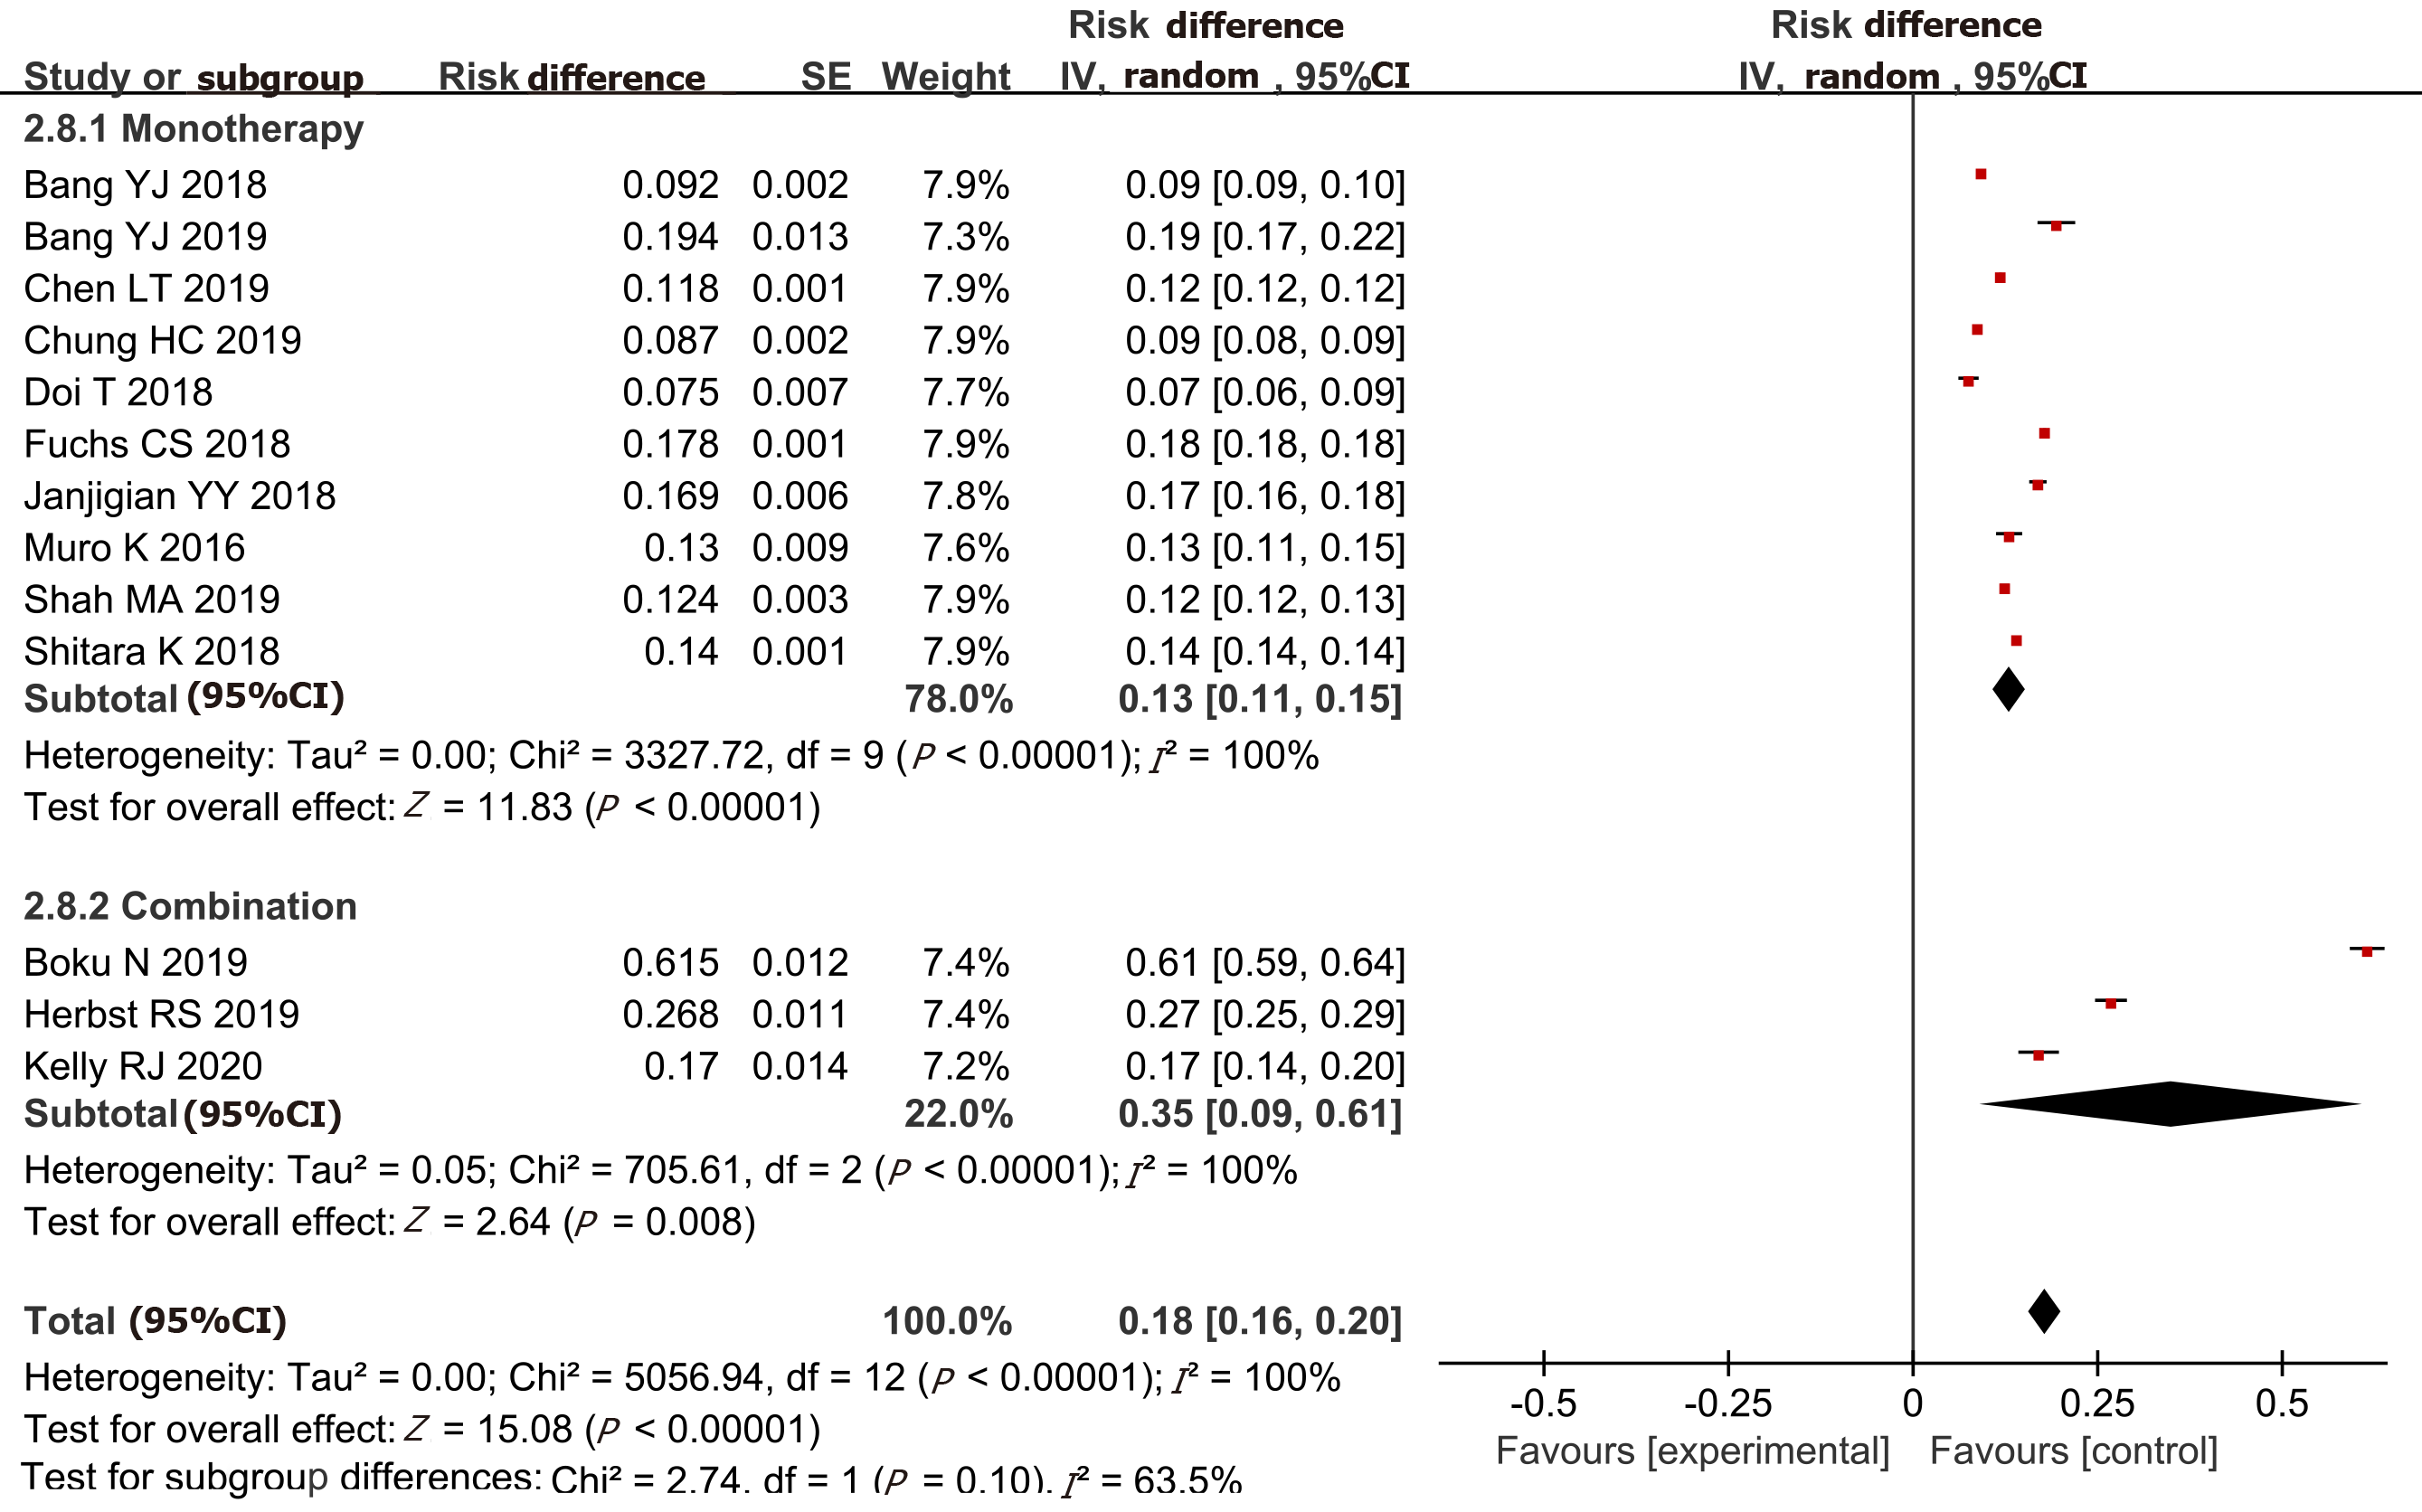
Figure 3 Pooled analysis of objective response rate.
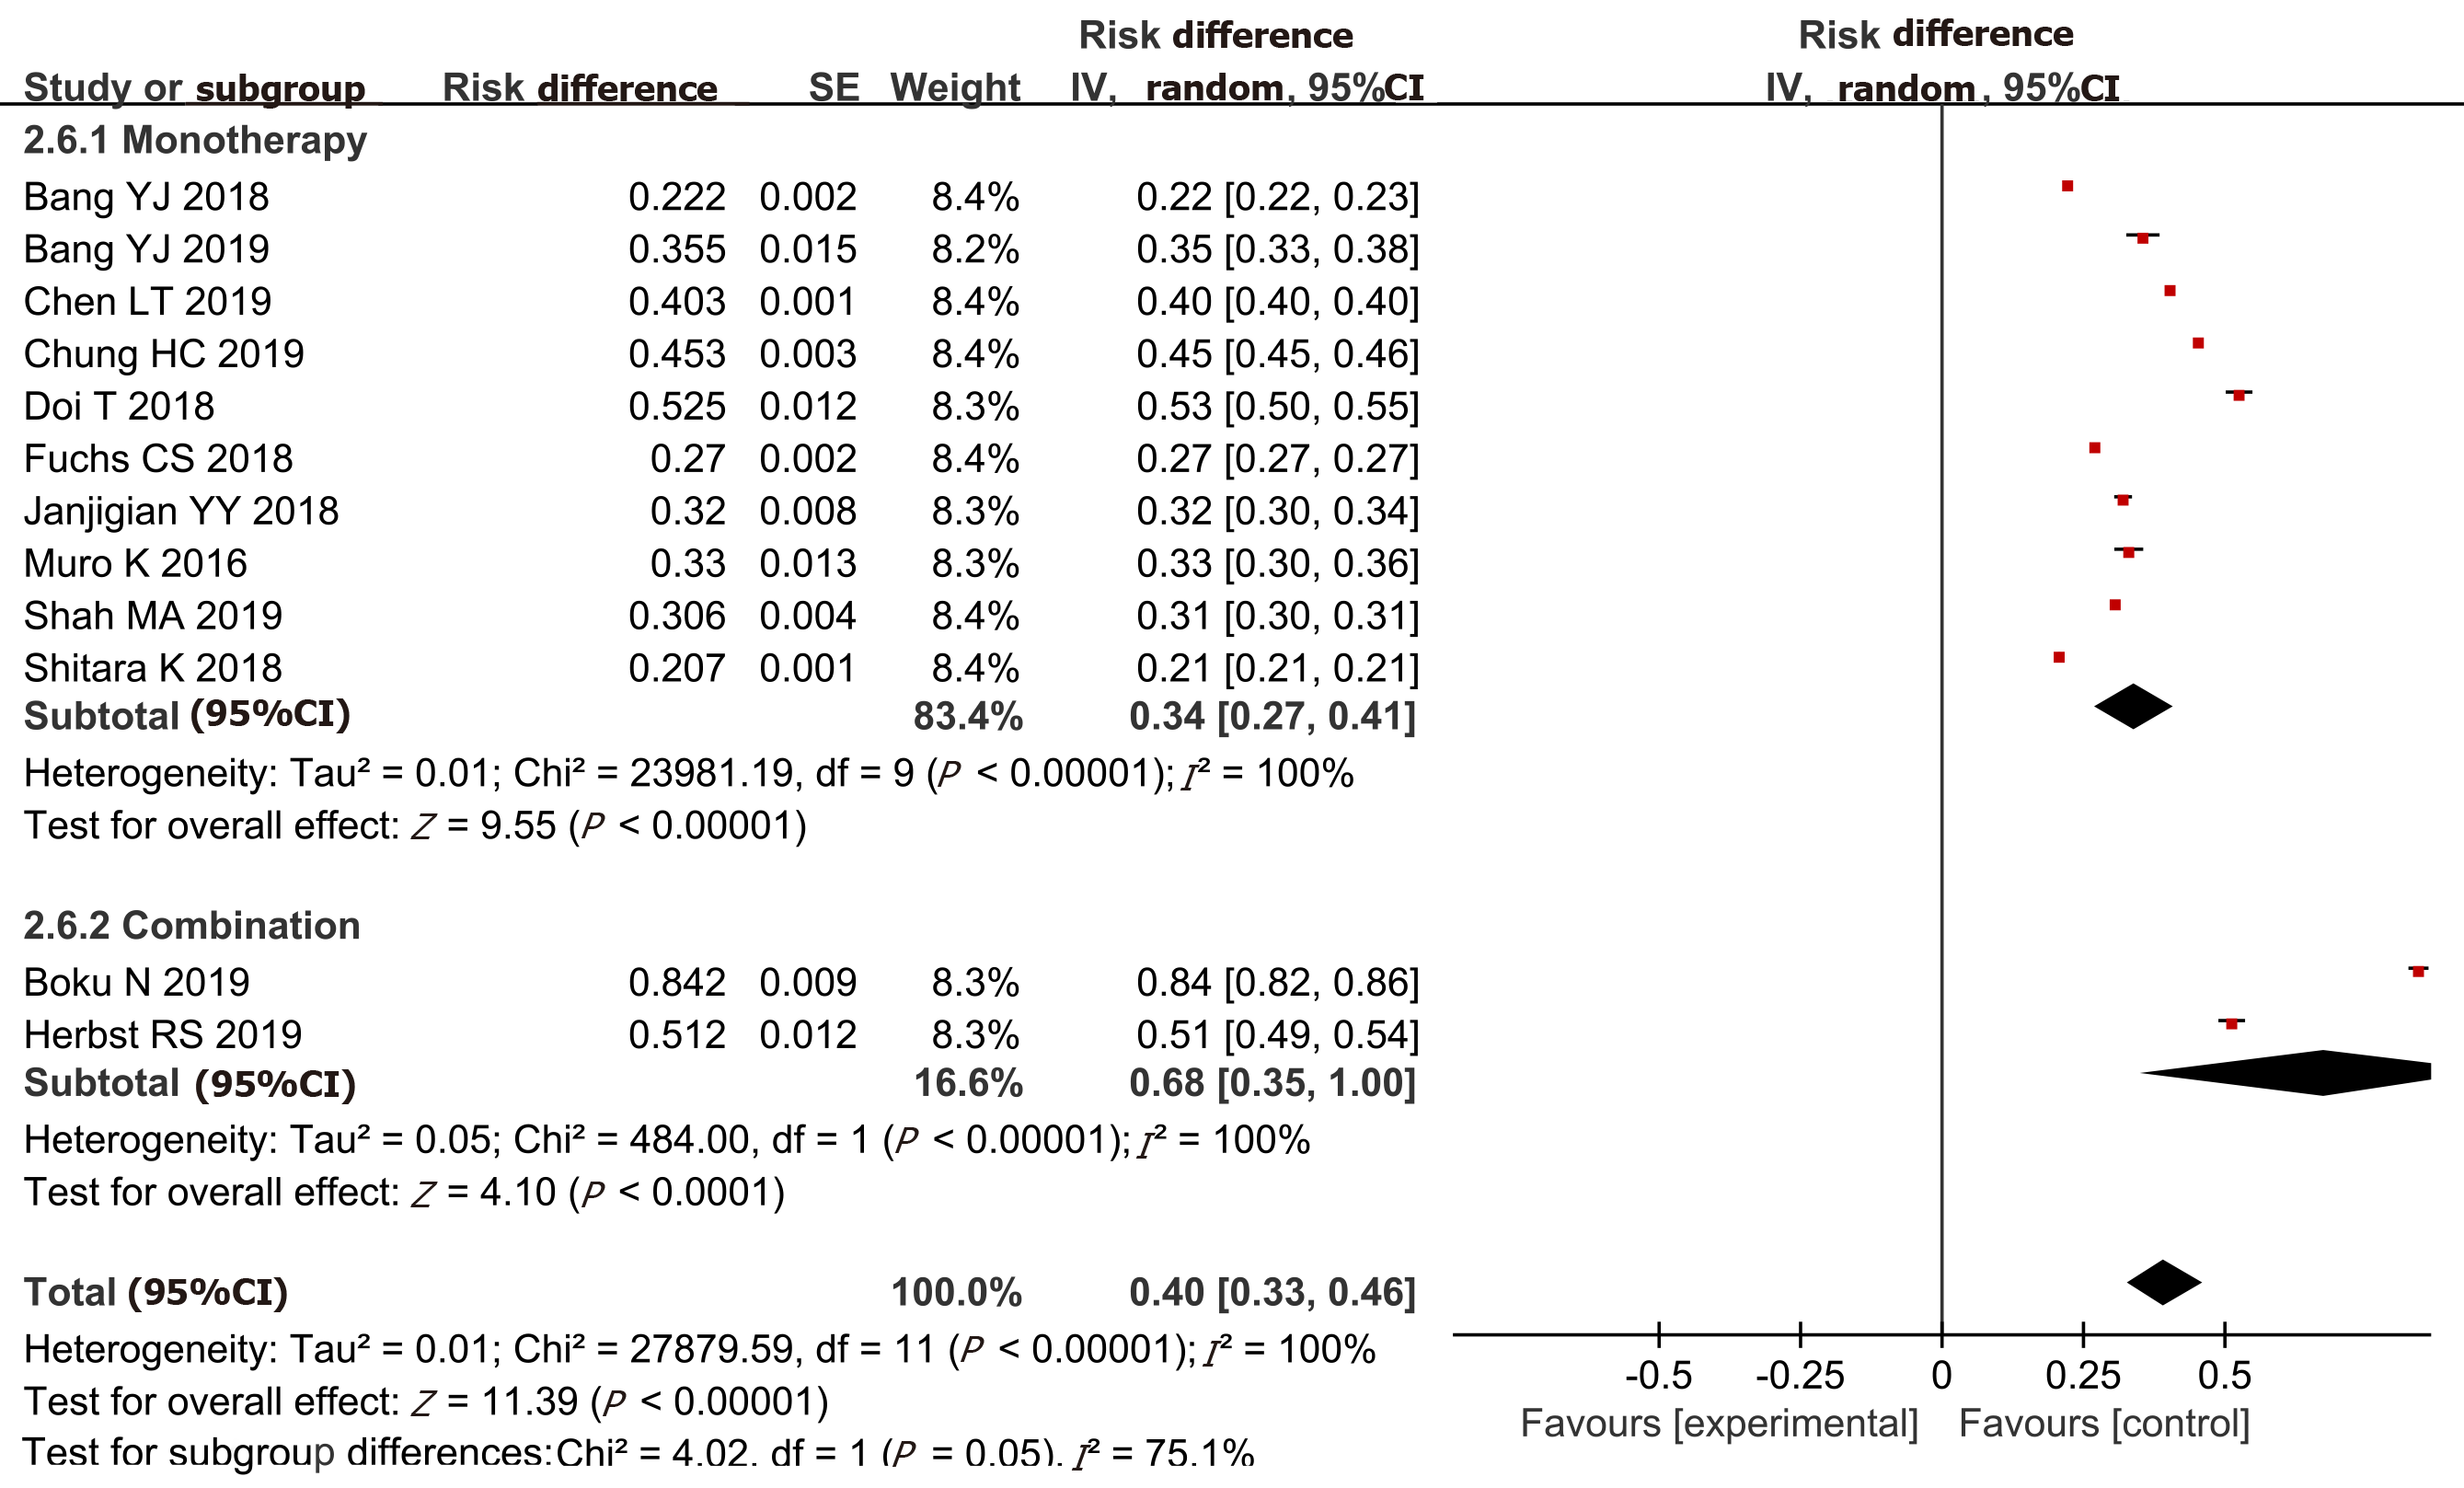
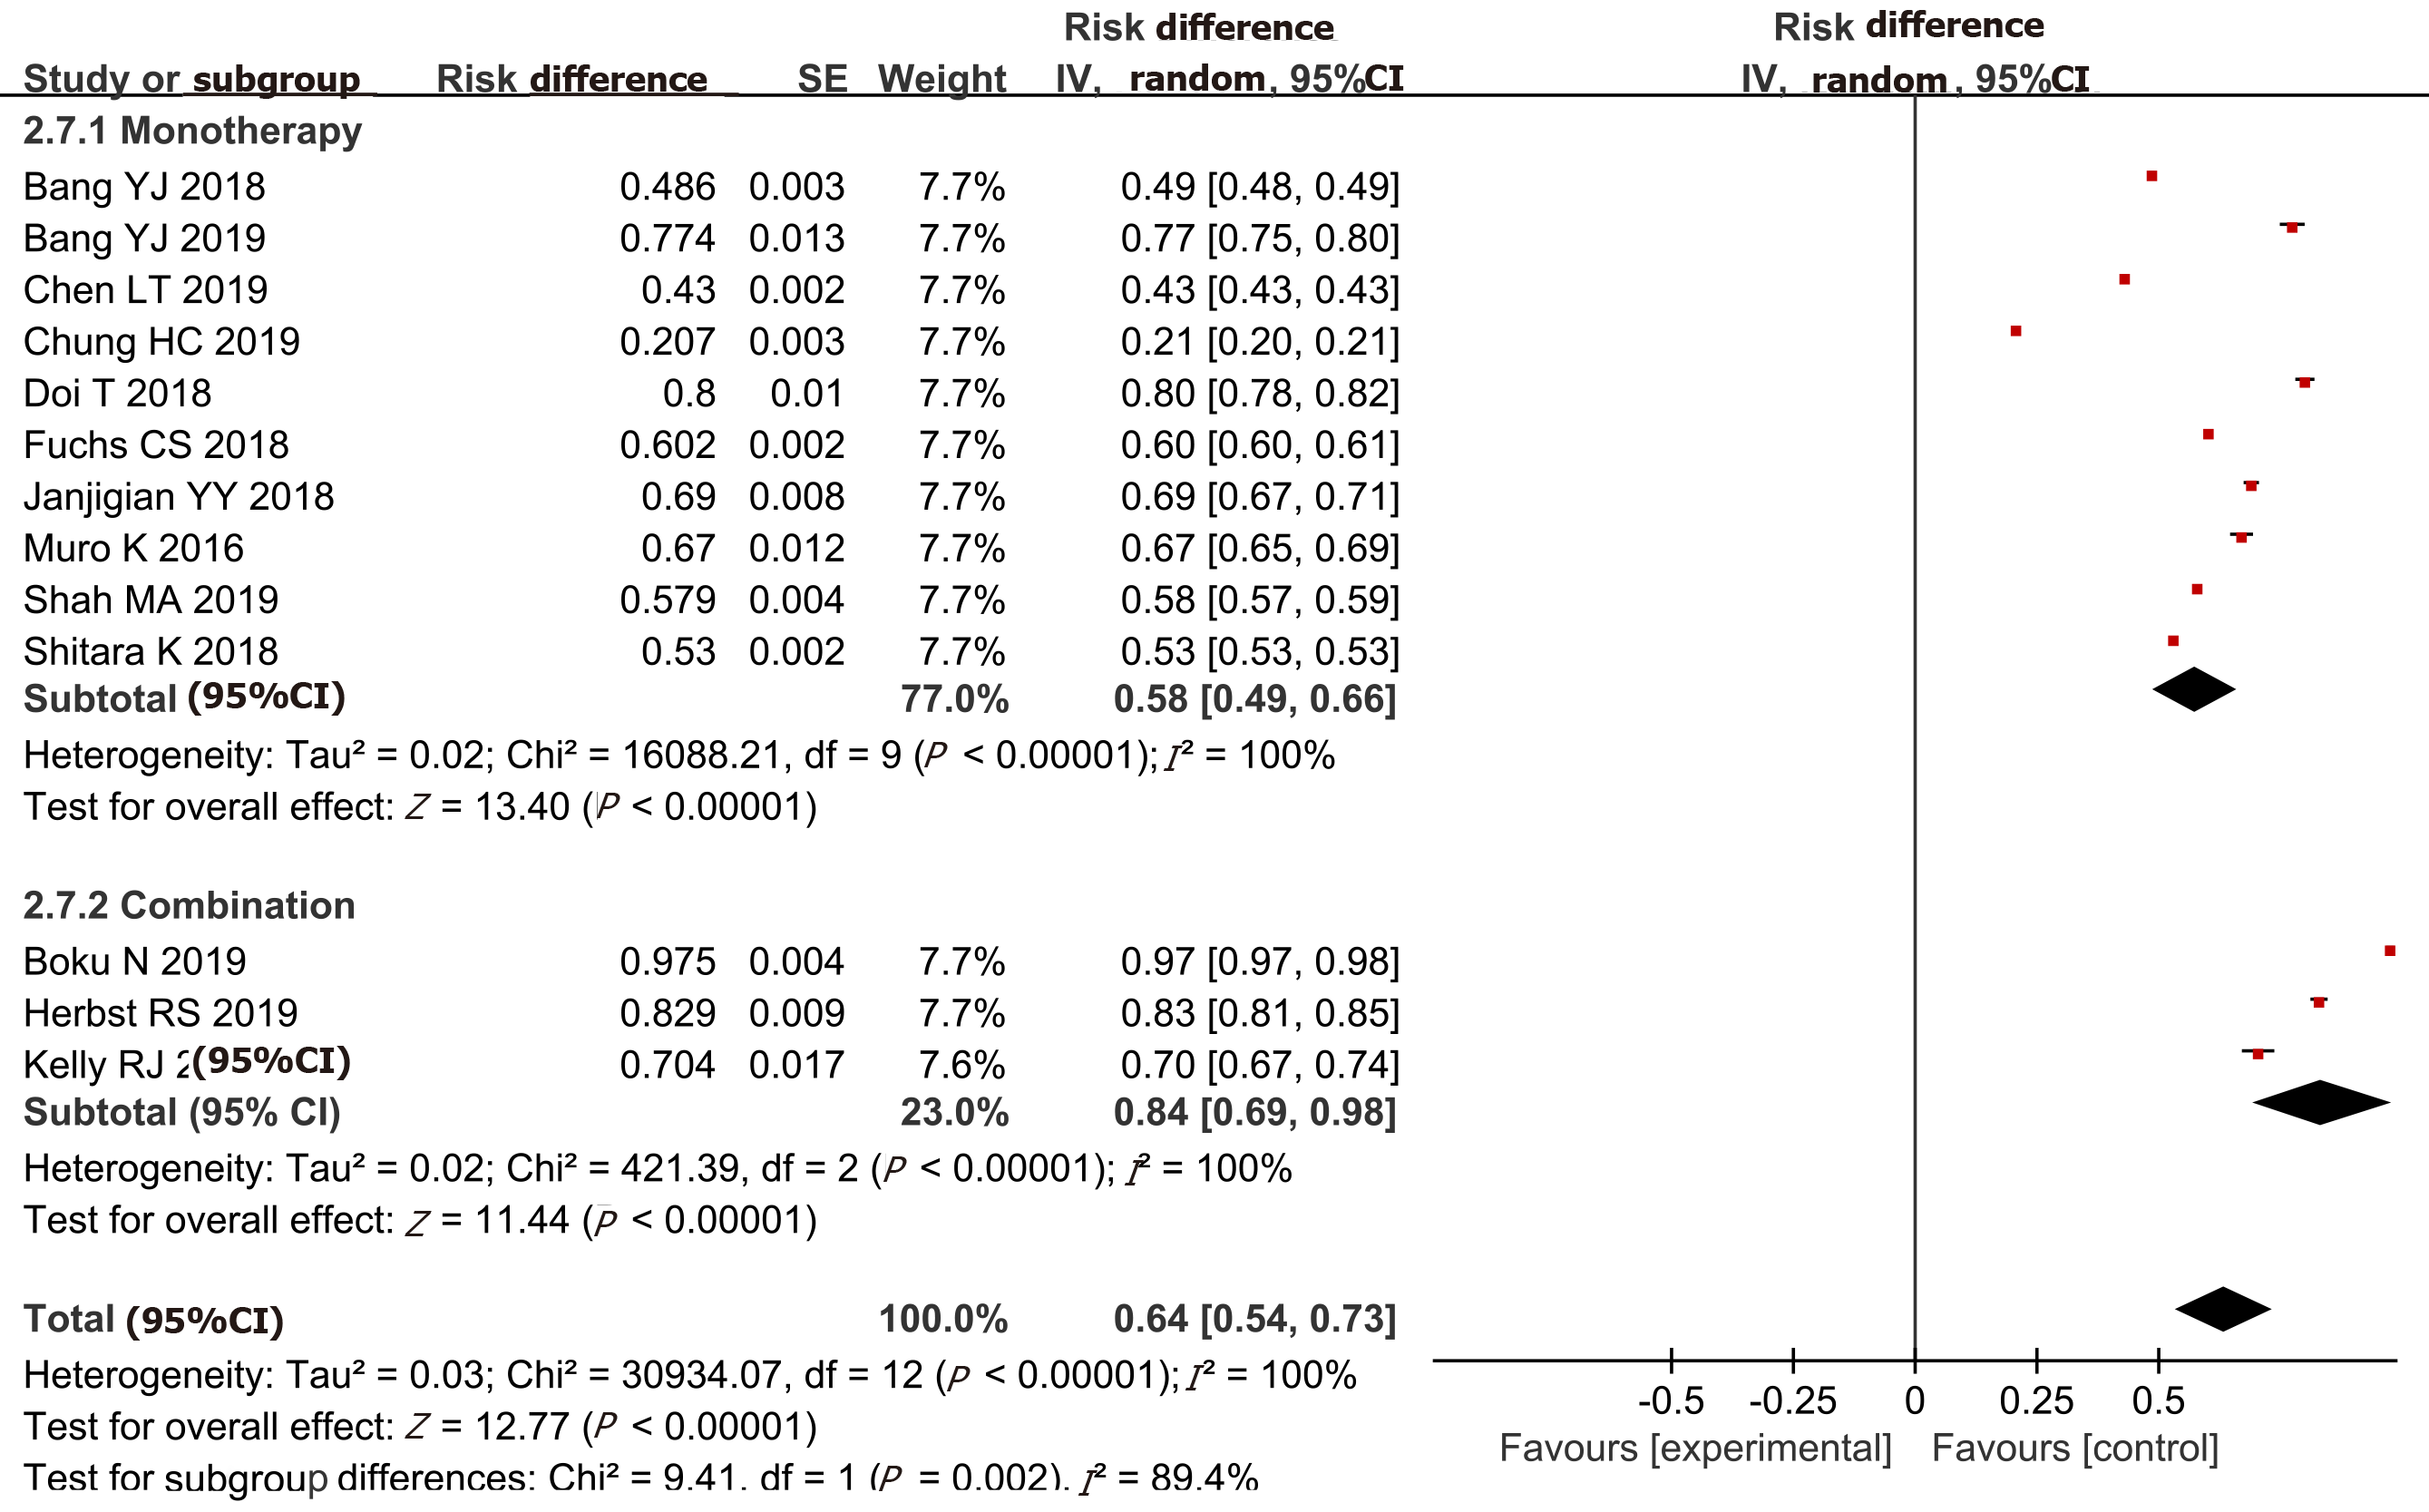
Figure 4 Pooled analysis of disease control rate.
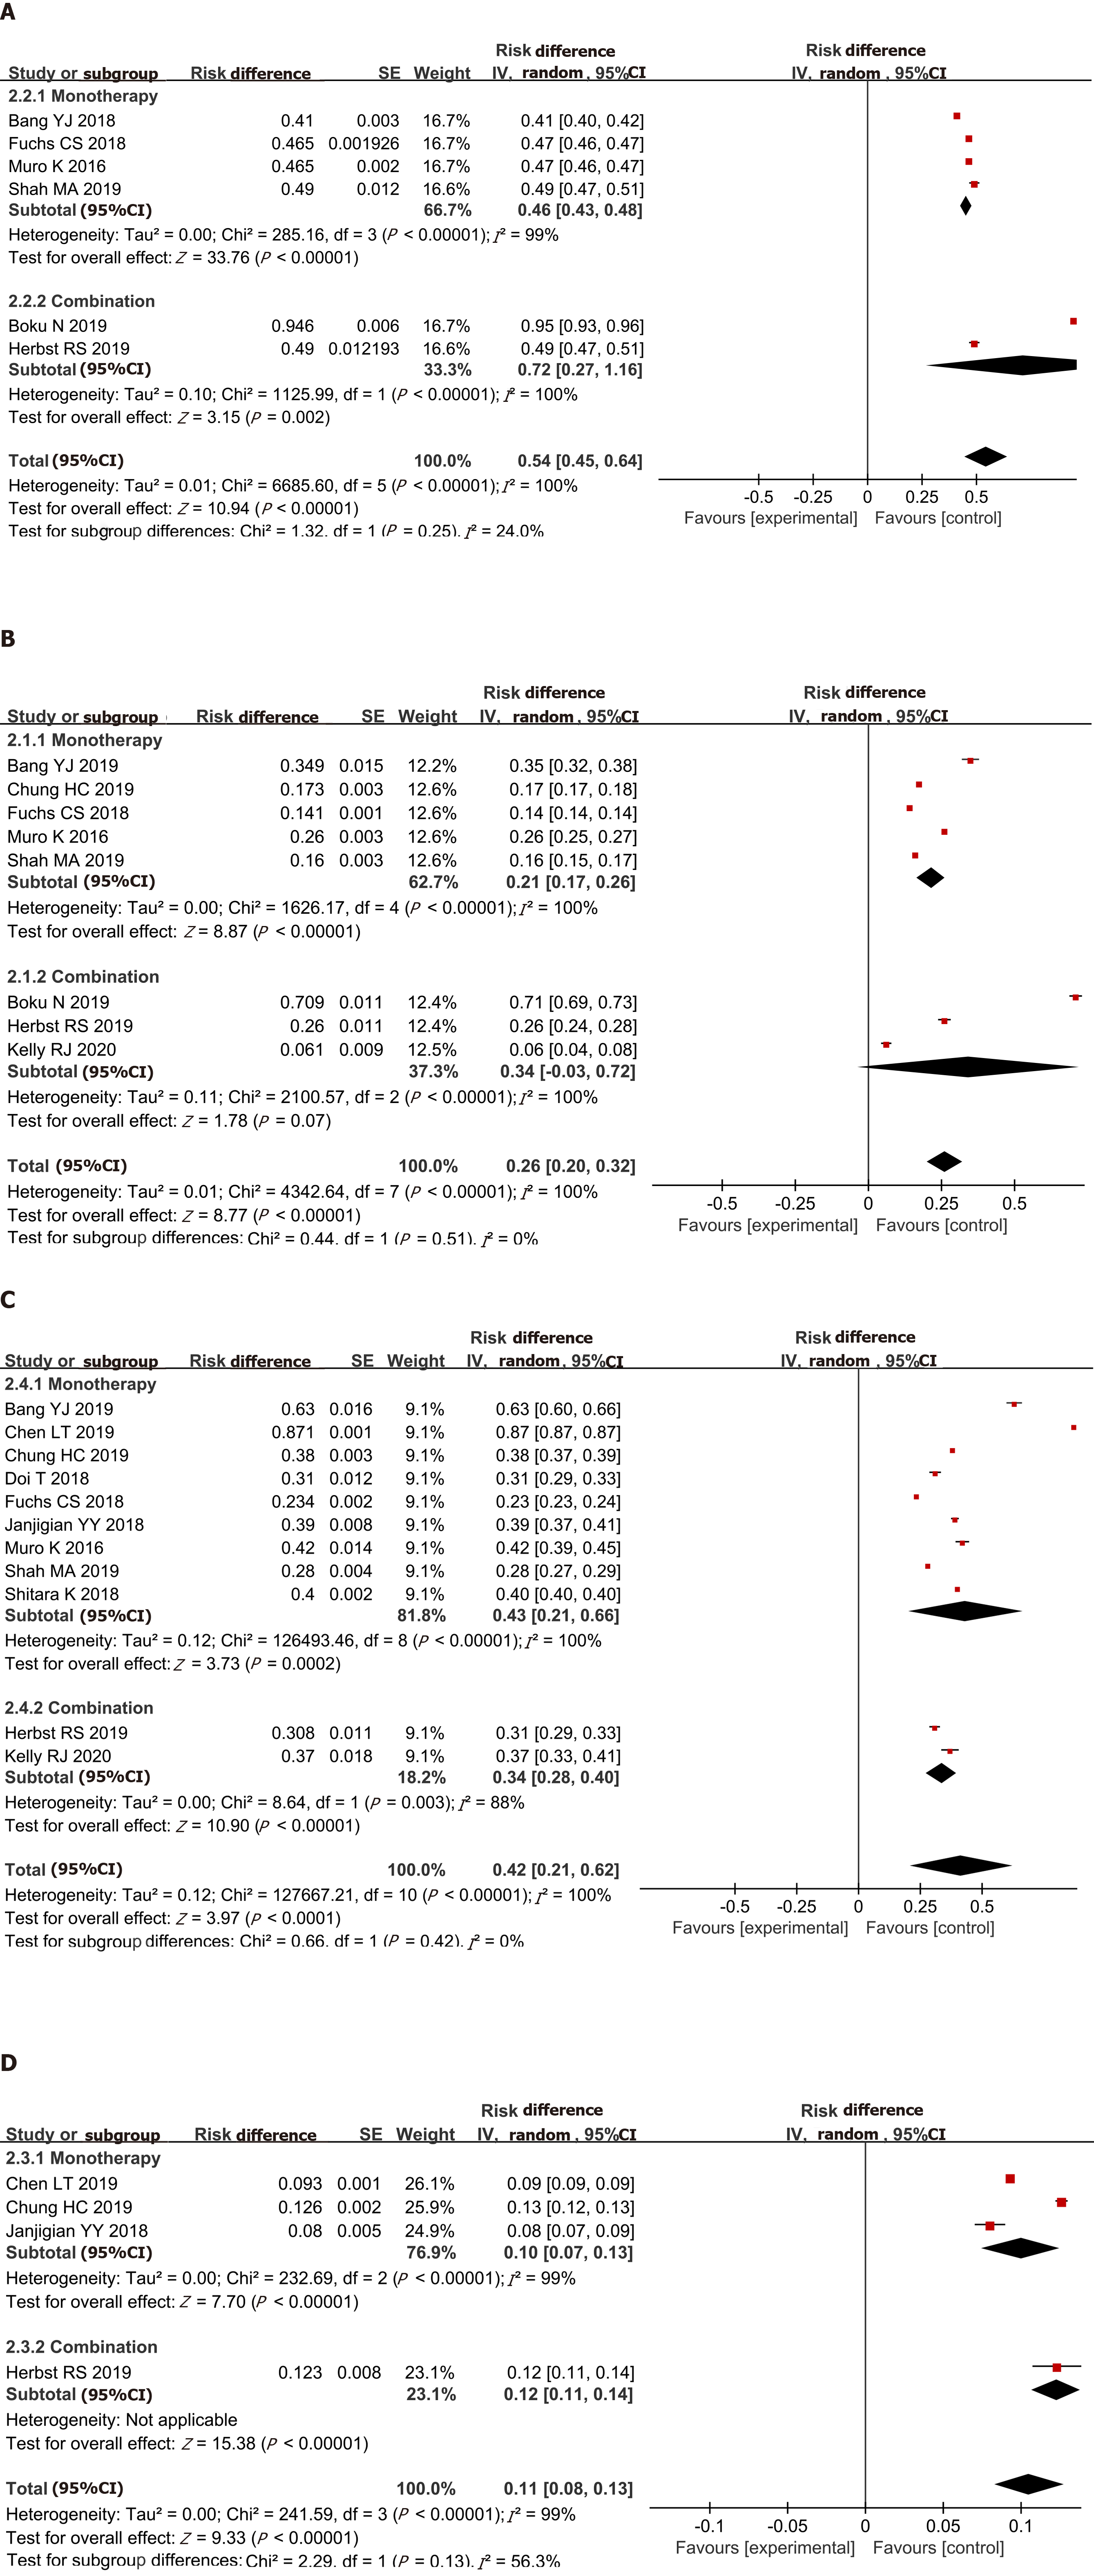
Figure 5 Overall survival and progression-free survival.
A: 6-mo overall survival (OS); B: 6-mo progression-free survival (PFS); C: 12-mo OS; D: 12-mo PFS.
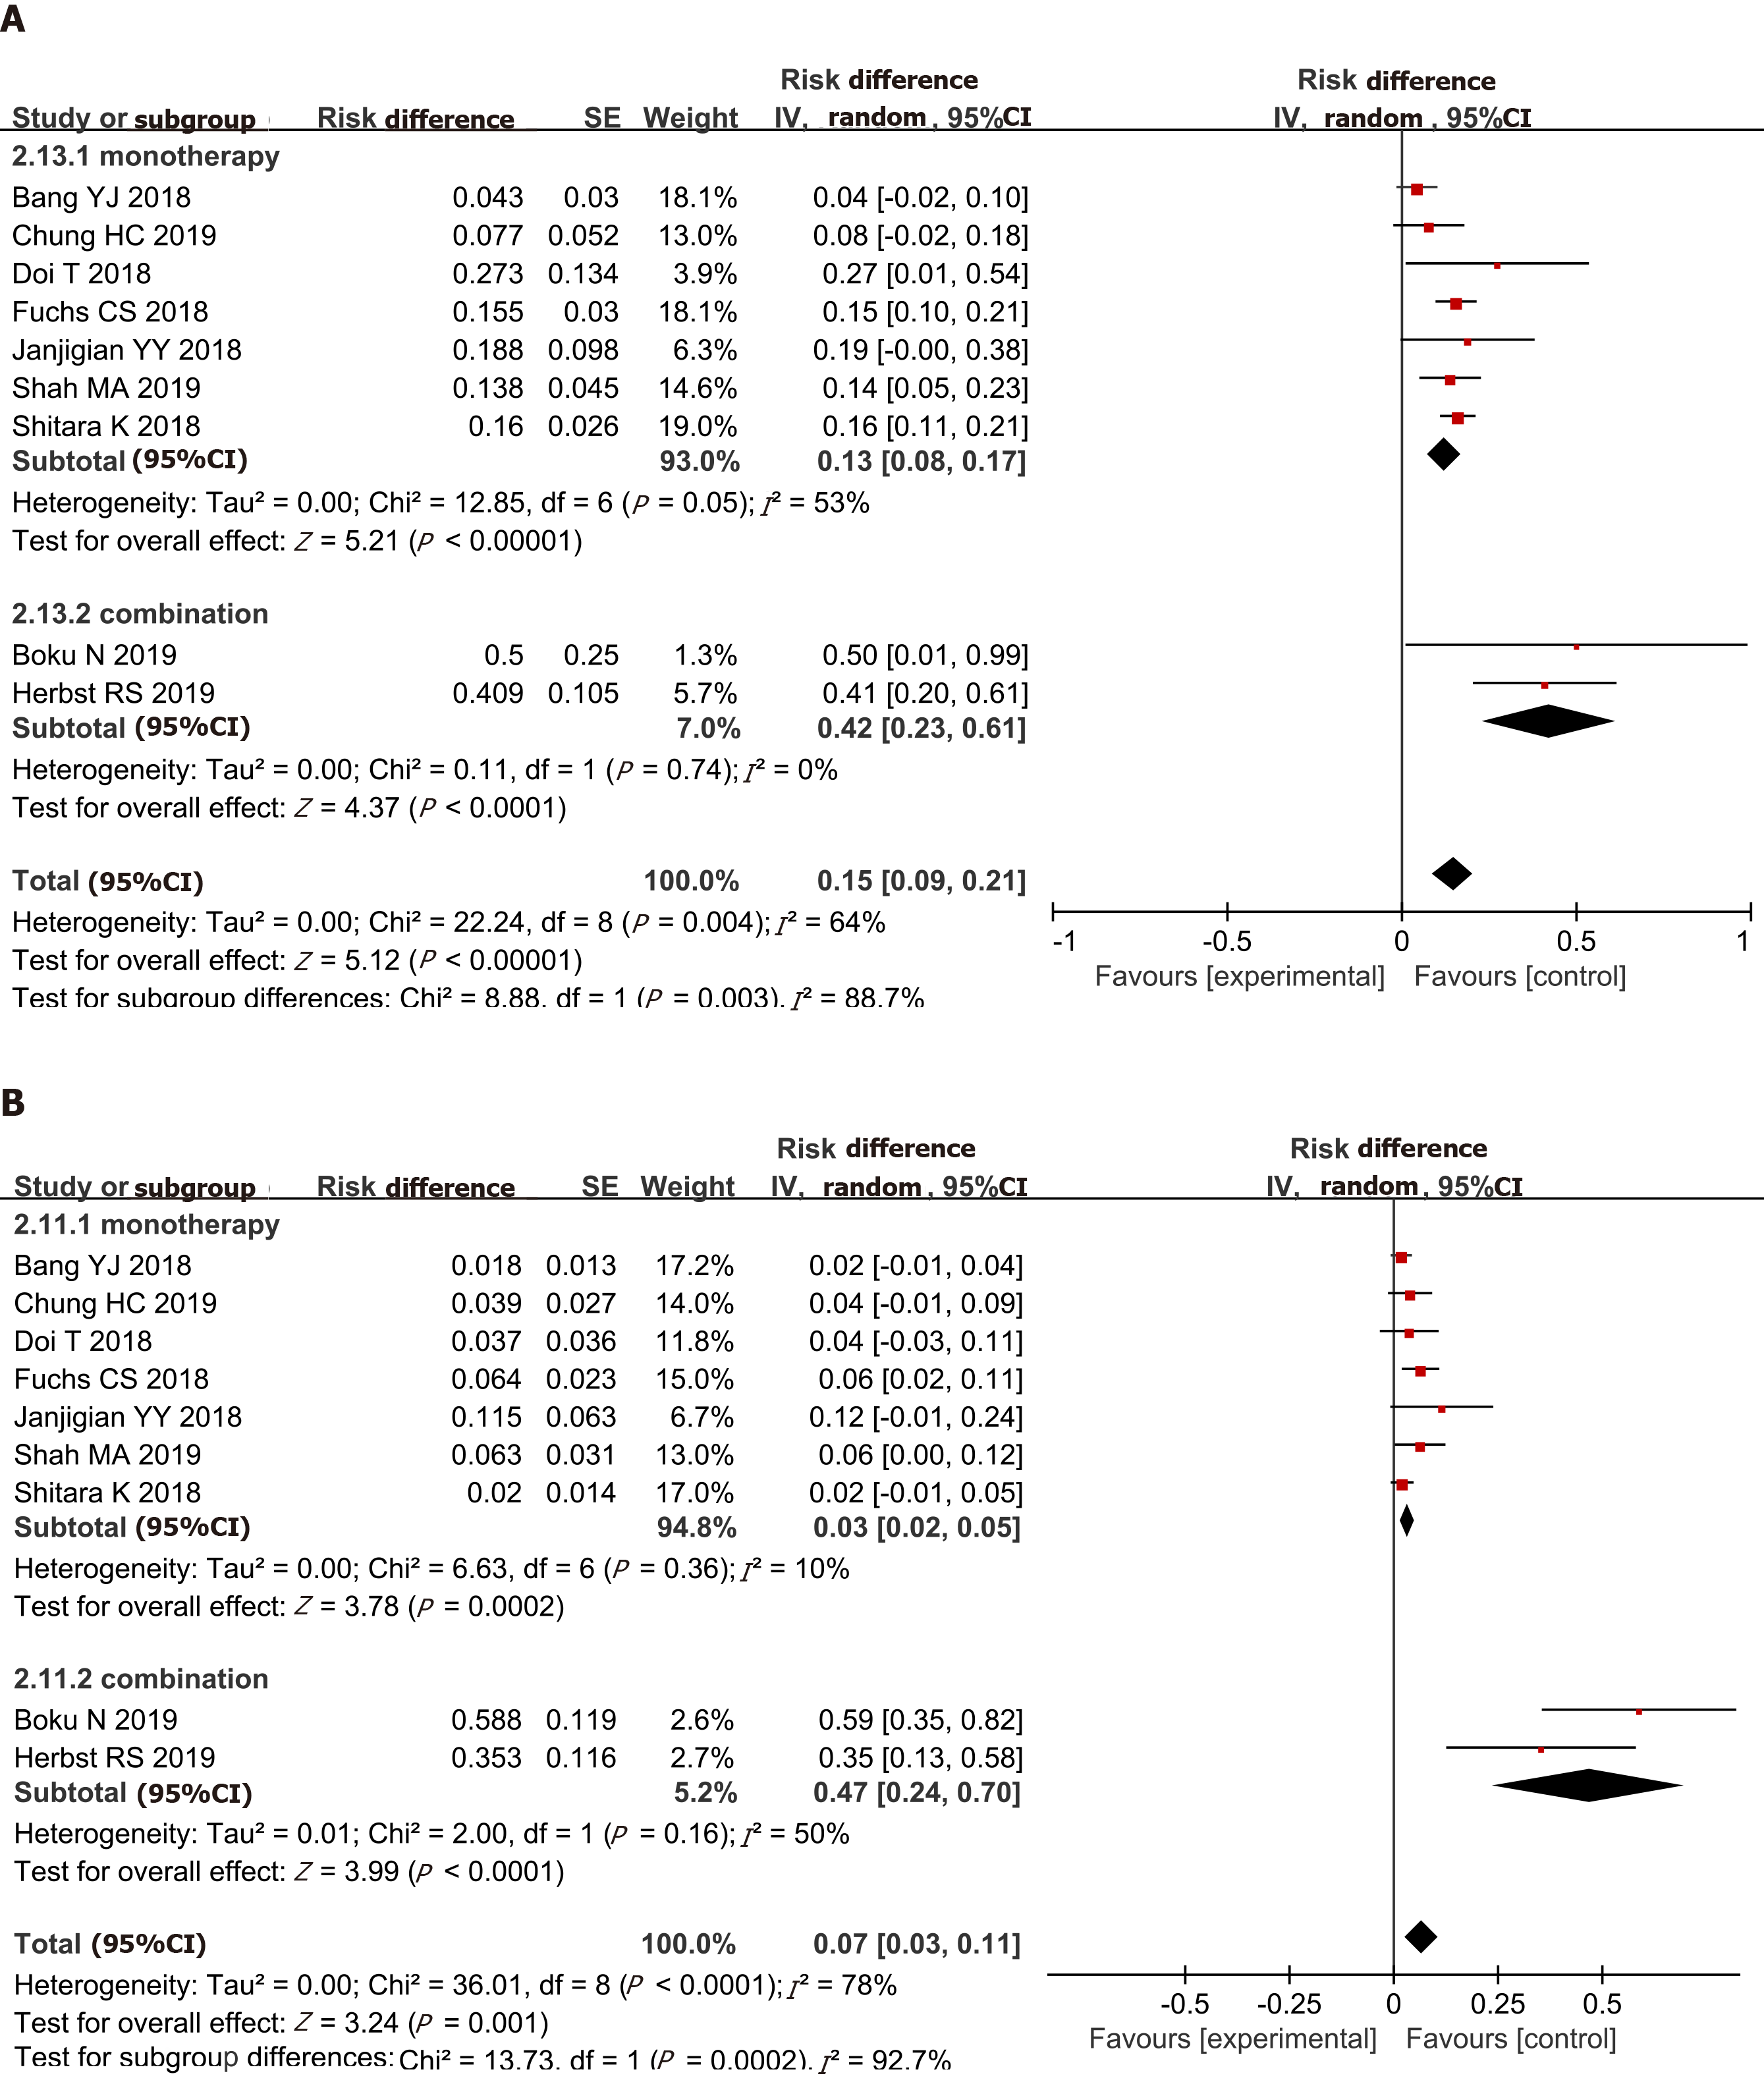
Figure 6 Objective response rate of PD-L1 positive (A) and negative patients (B).
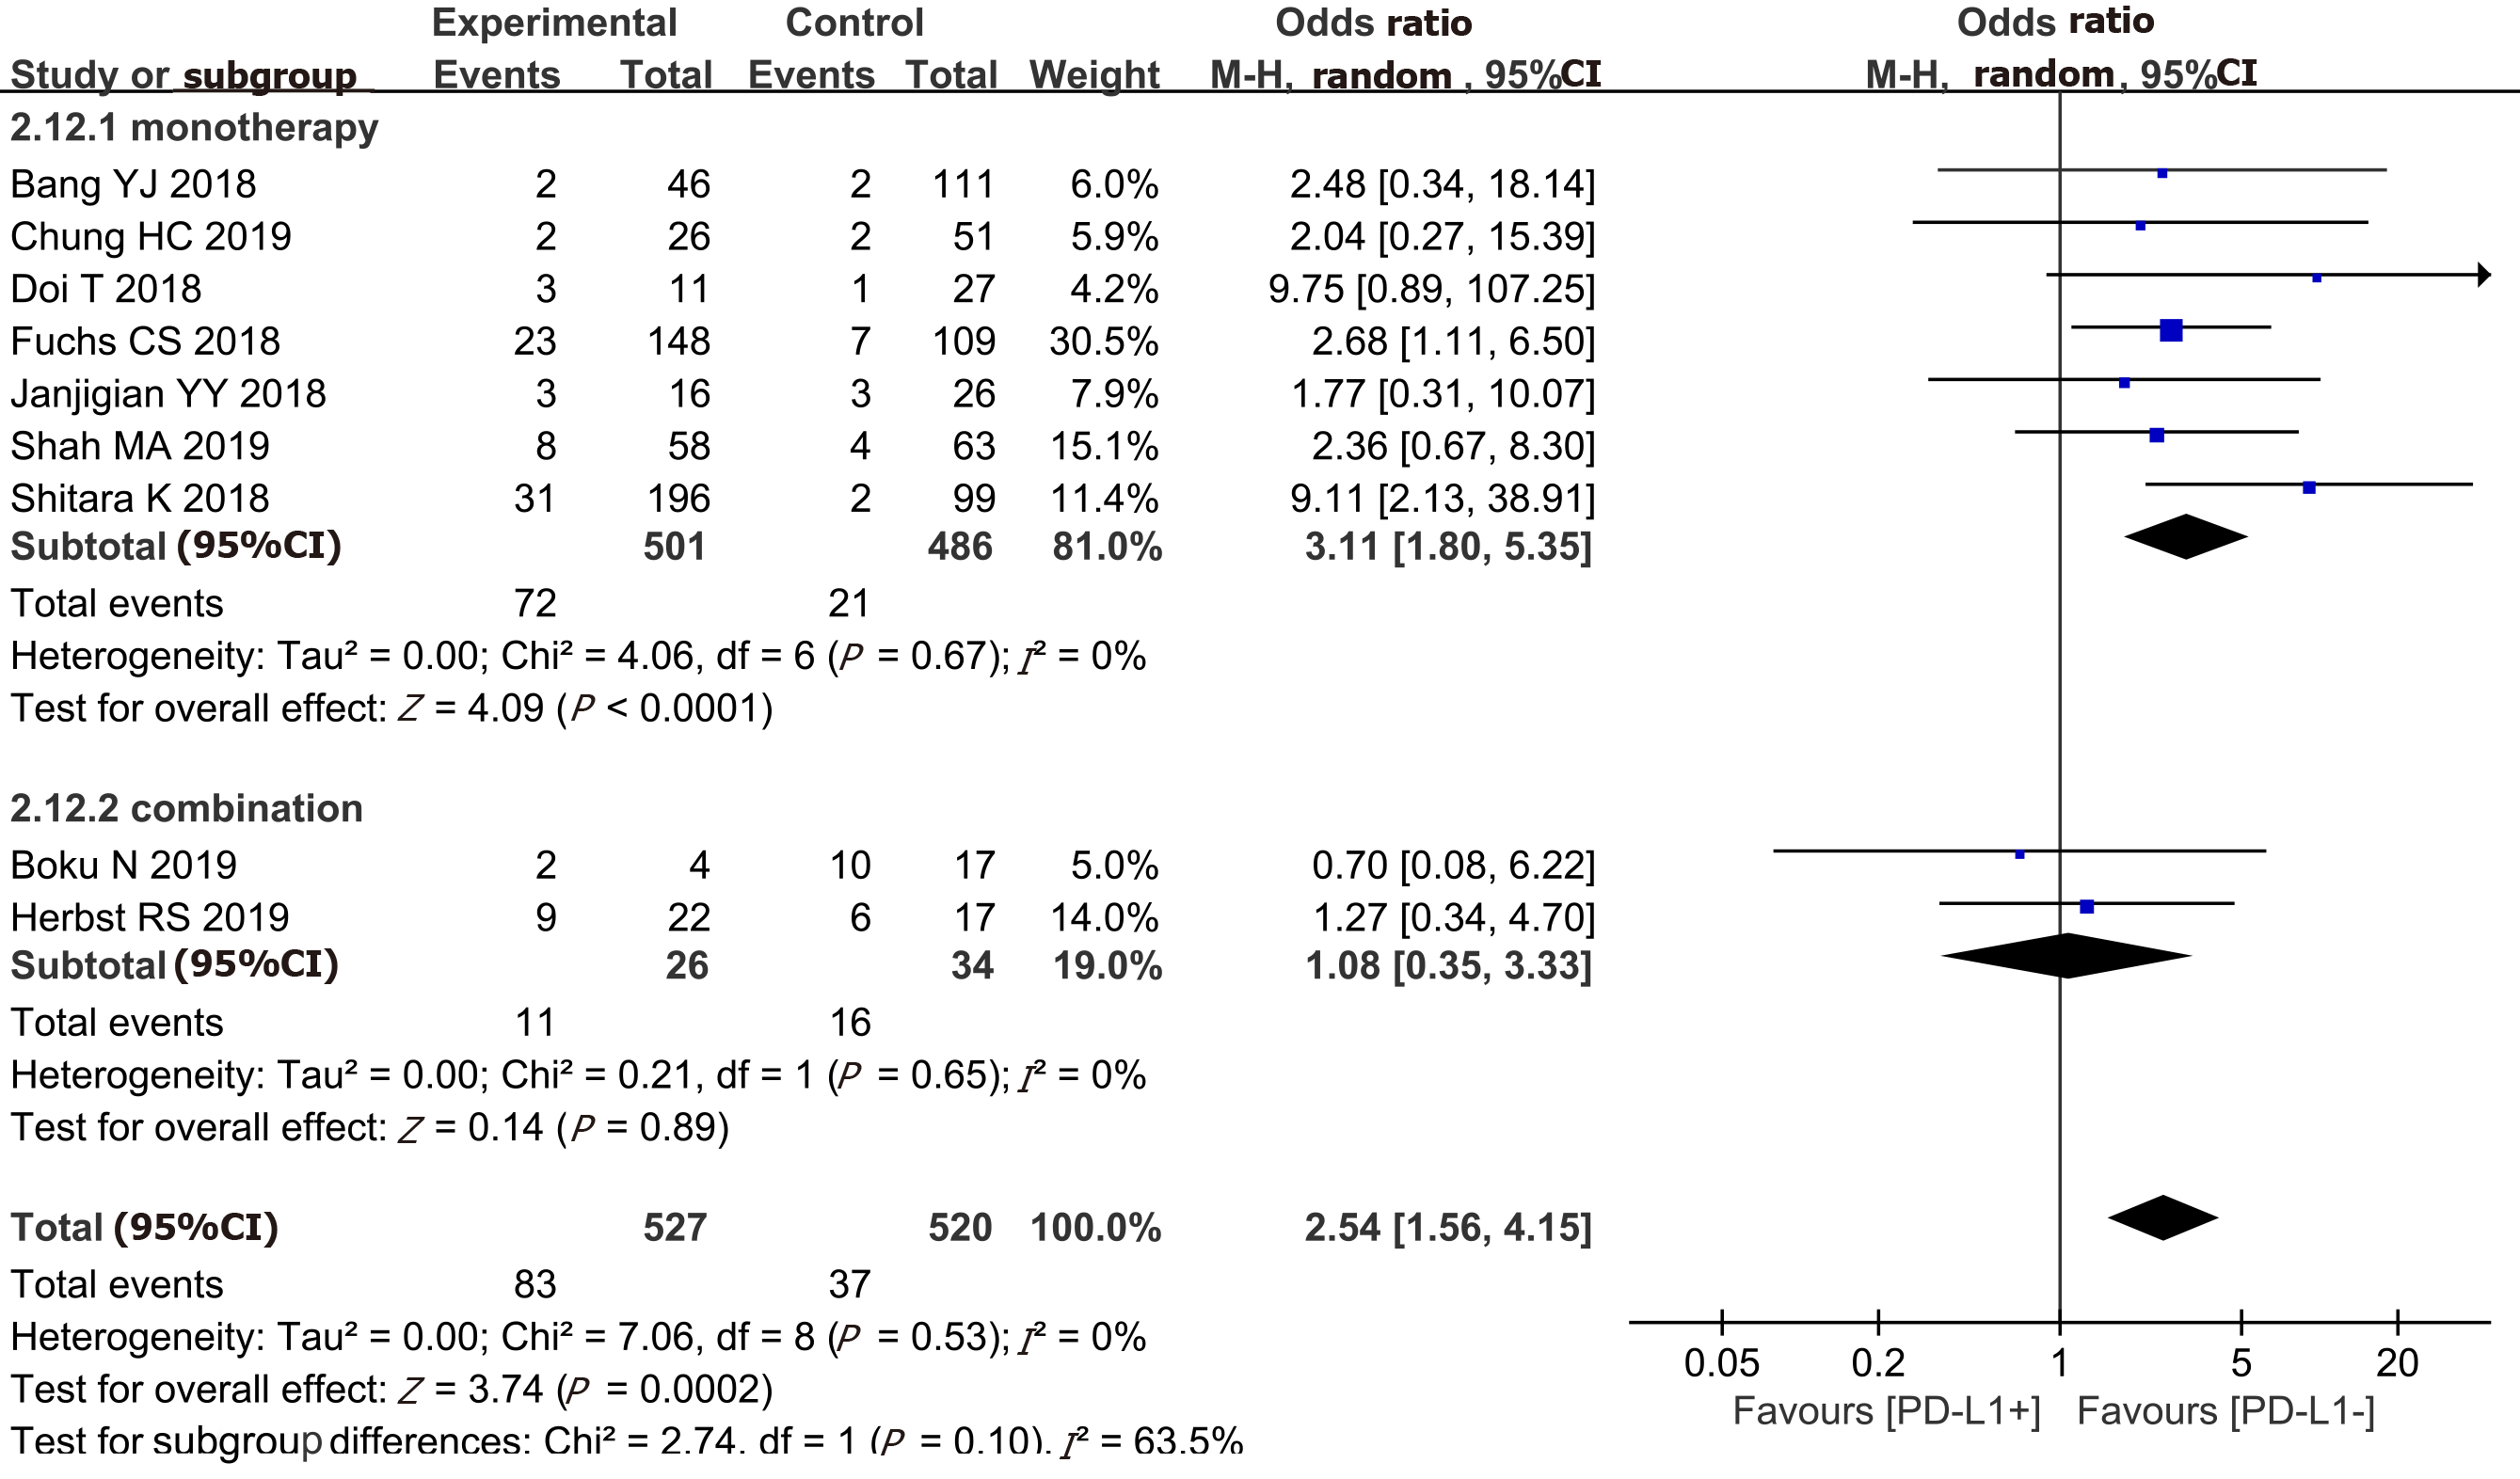
Figure 7 Comparison of objective response rate between PD-L1 positive and negative patients.
Figure 8 Pooled rate of any grade adverse events.
Figure 9 Pooled rate of grade ≥ 3 adverse events.
- Citation: Yang L, Dong XZ, Xing XX, Cui XH, Li L, Zhang L. Efficacy and safety of anti-PD-1/anti-PD-L1 antibody therapy in treatment of advanced gastric cancer or gastroesophageal junction cancer: A meta-analysis. World J Gastrointest Oncol 2020; 12(11): 1346-1363
- URL: https://www.wjgnet.com/1948-5204/full/v12/i11/1346.htm
- DOI: https://dx.doi.org/10.4251/wjgo.v12.i11.1346


