Copyright
©2014 Baishideng Publishing Group Co.
World J Hepatol. Apr 27, 2014; 6(4): 243-250
Published online Apr 27, 2014. doi: 10.4254/wjh.v6.i4.243
Published online Apr 27, 2014. doi: 10.4254/wjh.v6.i4.243
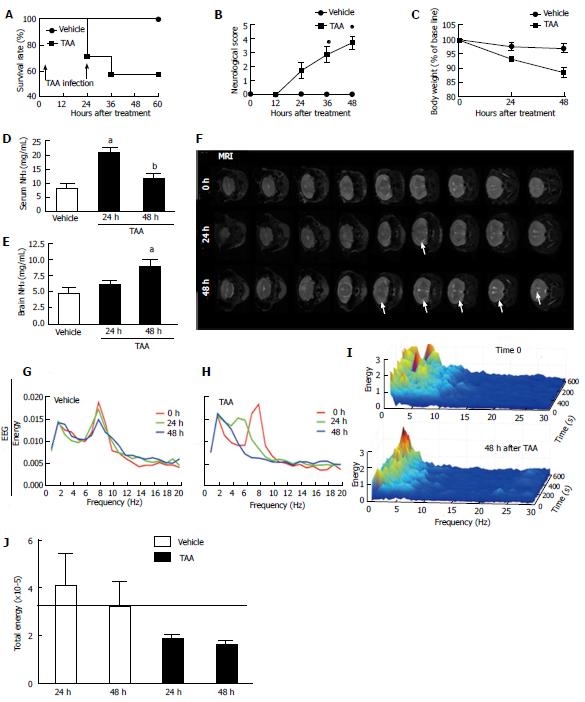
Figure 1 Thioacetamide treatment triggered neuropsychomotor changes, diffuse brain edema and hyperammonemia, with electroencephalography spectrum compatible with of encephalopathy.
A: Survival rate following repeated TAA injections (arrows); B: Neurological score was assessed through all experimental procedure. Neuropsychomotor deficit increases as higher is the score average, with 1 = normal and 5 = death; C: Mice treated with TAA also presented with significant weight loss in comparison to controls; D, E: Serum ammonemia was detected following 24 h of TAA injection, while brain ammonia concentration increased gradually, reaching significant higher values after 48 h (E); F: In agreement, MRI from TAA-treated mice brains showed discrete, but diffuse edema as pointed by arrow heads. G, H: EEG analysis revealed that while controls had coincident EEG records during the experimental protocol (G), brain waves spectrum of TAA-treated mice (H) was compatible with metabolic encephalopathy; I: 3D rendering of 60 minutes EEG record (Z axis) plotted comparing energy (in Y axis) with frequency (X axis). Note the increase in higher frequencies waves (theta and alpha; 4-8 and 8-13 Hz, respectively) with a concomitant increase of lower frequency ones (mainly delta; up to 4 Hz). Best case results were depicted here; N = 8 for each group; J: Total EEG energy was also reduced in TAA-treated group. aIndicates statistical significance in comparison to controls and bin comparison to 24 h group. P < 0.05, analysis of variance (Tukey’s post test). N≥ 5 for each group. TAA: Thioacetamide; EEG: Electroencephalography.
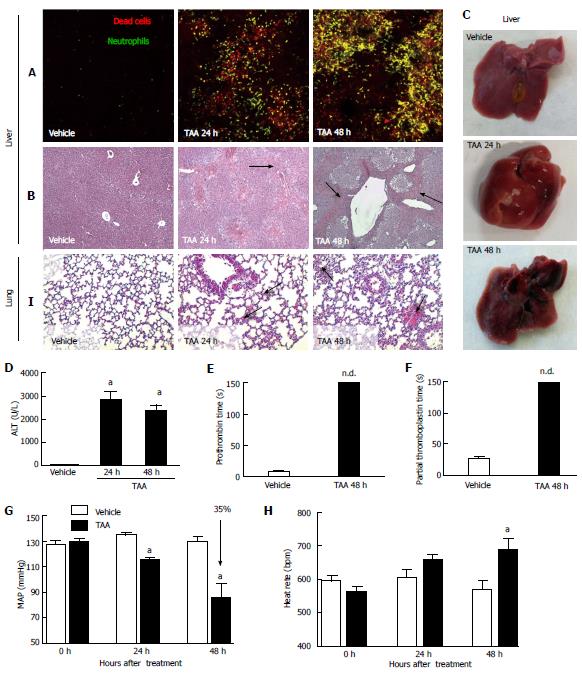
Figure 2 Thioacetamide caused severe liver necrosis and inflammation, which may explain mice metabolic encephalopathy, coagulopathy and remote lung injury.
A: Liver intravital microscopy showing crescent number of necrotic cells (in red, propidium iodide) with concomitant neutrophil infiltration (in green, Lysm-eGFP mice); B: Liver sections stained by hematoxylin and eosin (4 × increase). Arrows indicate necrotic areas; C, D: Liver macroscopic analysis confirmed extensive and diffuse necrosis, which is also reflected by elevated serum transaminase activity (D); E, F: Liver failure was confirmed by prolonged prothrombin and partial thromboplastin times; G, H: Also, significant drop in mean arterial pressure (MAP; G) and increased heart rate (H), as assessed by tail cuff method, suggested that TAA-treated mice also evolved to hemodynamic shock; I: After TAA treatment hours, lungs from mice had increased cellularity in lung parenchyma, alveolar edema and hemorrhage in comparison to controls (arrows, 4 x increase) aIndicates statistical significance in comparison to controls. aP < 0.05, ANOVA (Tukey’s post test). N ≥ 5 for each group. TAA: Thioacetamide.
- Citation: Gomides LF, Marques PE, Faleiros BE, Pereira RV, Amaral SS, Lage TR, Resende GHS, Guidine PAM, Foureaux G, Ribeiro FM, Martins FP, Fontes MAP, Ferreira AJ, Russo RC, Teixeira MM, Moraes MF, Teixeira AL, Menezes GB. Murine model to study brain, behavior and immunity during hepatic encephalopathy. World J Hepatol 2014; 6(4): 243-250
- URL: https://www.wjgnet.com/1948-5182/full/v6/i4/243.htm
- DOI: https://dx.doi.org/10.4254/wjh.v6.i4.243


