Copyright
©The Author(s) 2025.
World J Hepatol. May 27, 2025; 17(5): 106916
Published online May 27, 2025. doi: 10.4254/wjh.v17.i5.106916
Published online May 27, 2025. doi: 10.4254/wjh.v17.i5.106916
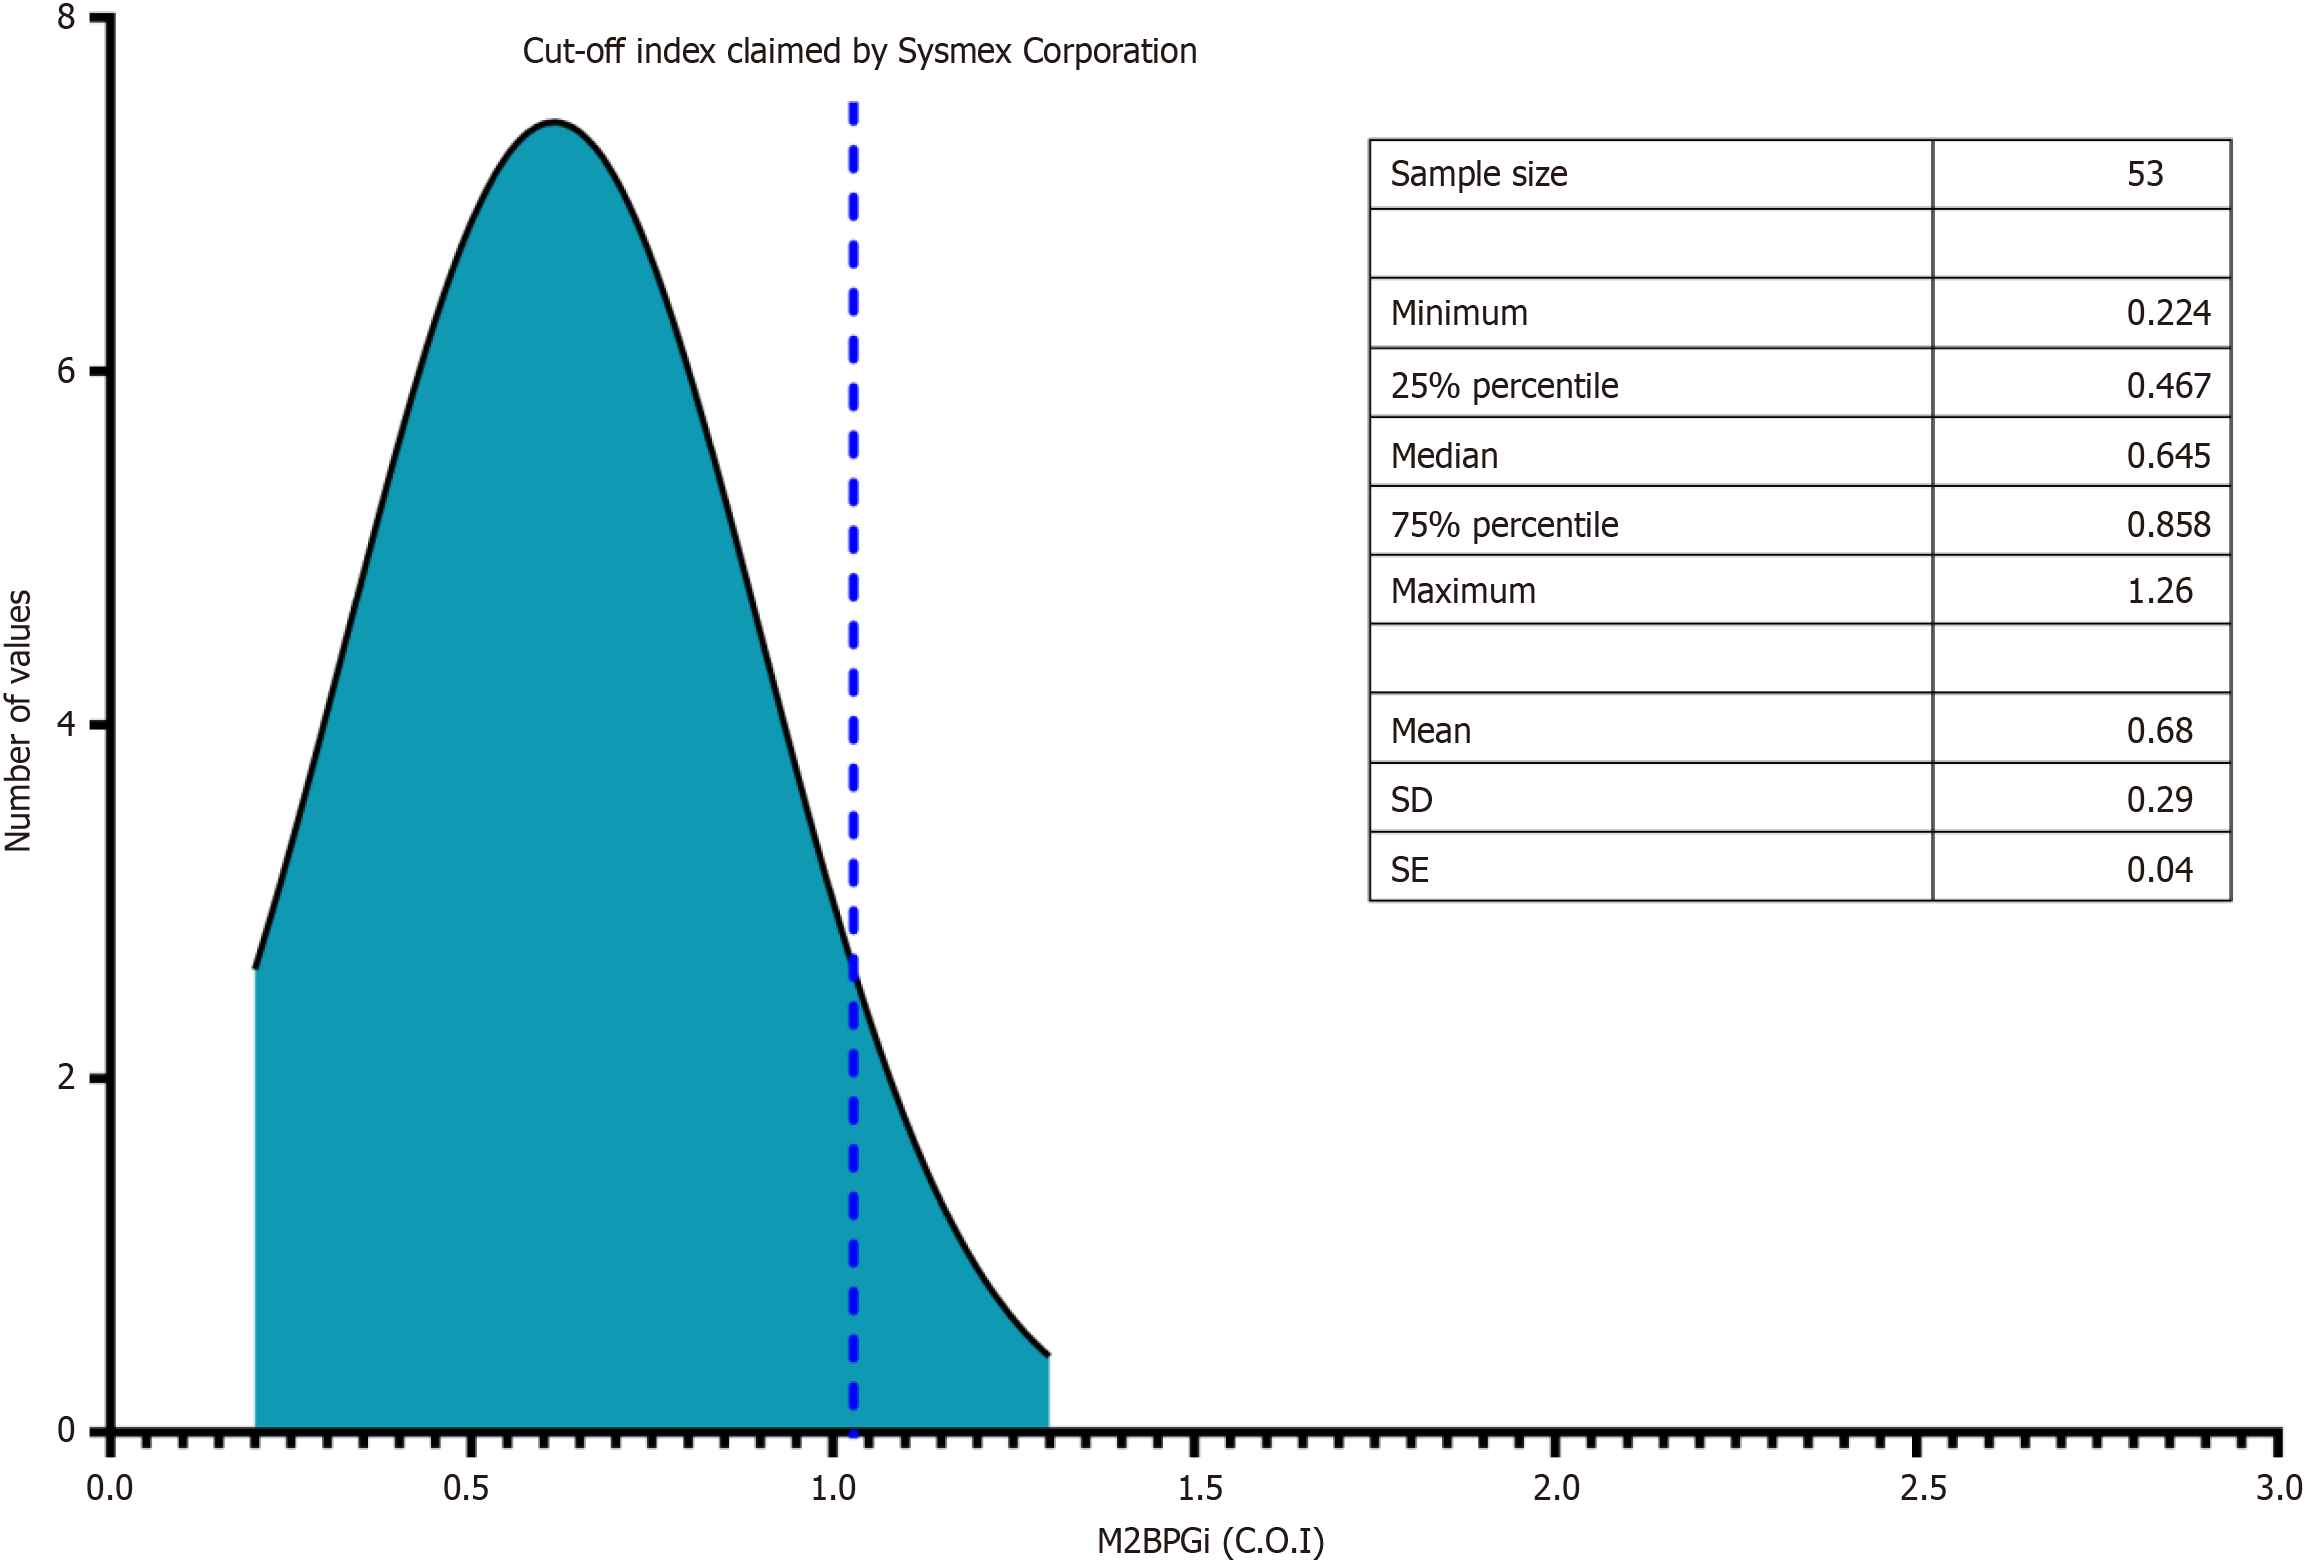
Figure 1 The distribution of Mac-2 binding protein glycosylated isomer levels in healthy volunteers.
M2BPGi: Mac-2 binding protein glycosylated isomer; C.O.I: Cut-off index.
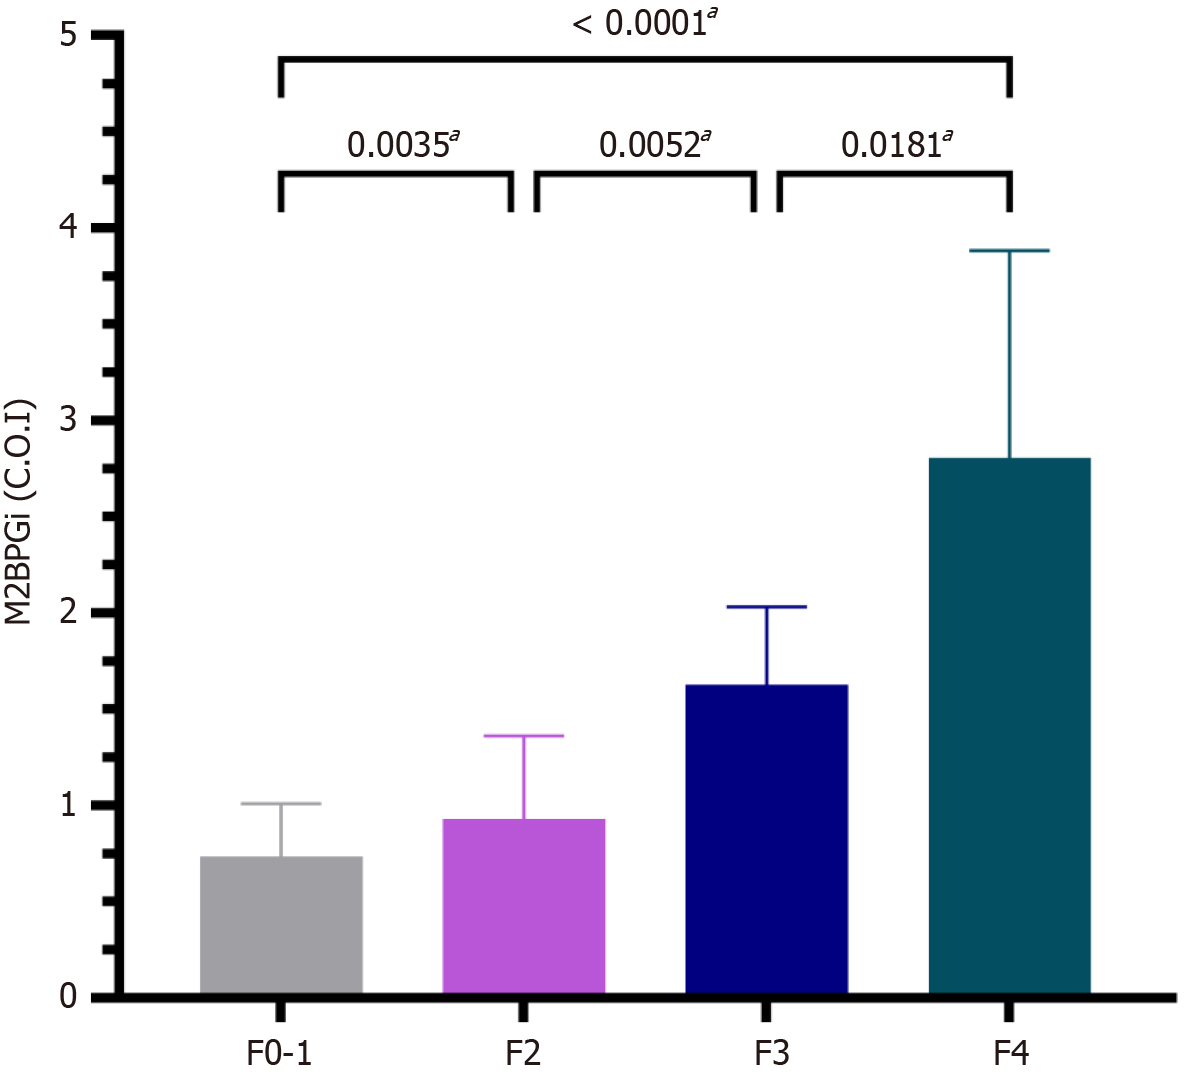
Figure 2 Median of Mac-2 binding protein glycan isomer levels between different fibrosis stages.
aKruskal-Wallis test, P < 0.05; M2BPGi: Mac-2 binding protein glycosylated isomer; C.O.I: Cut-off Index.
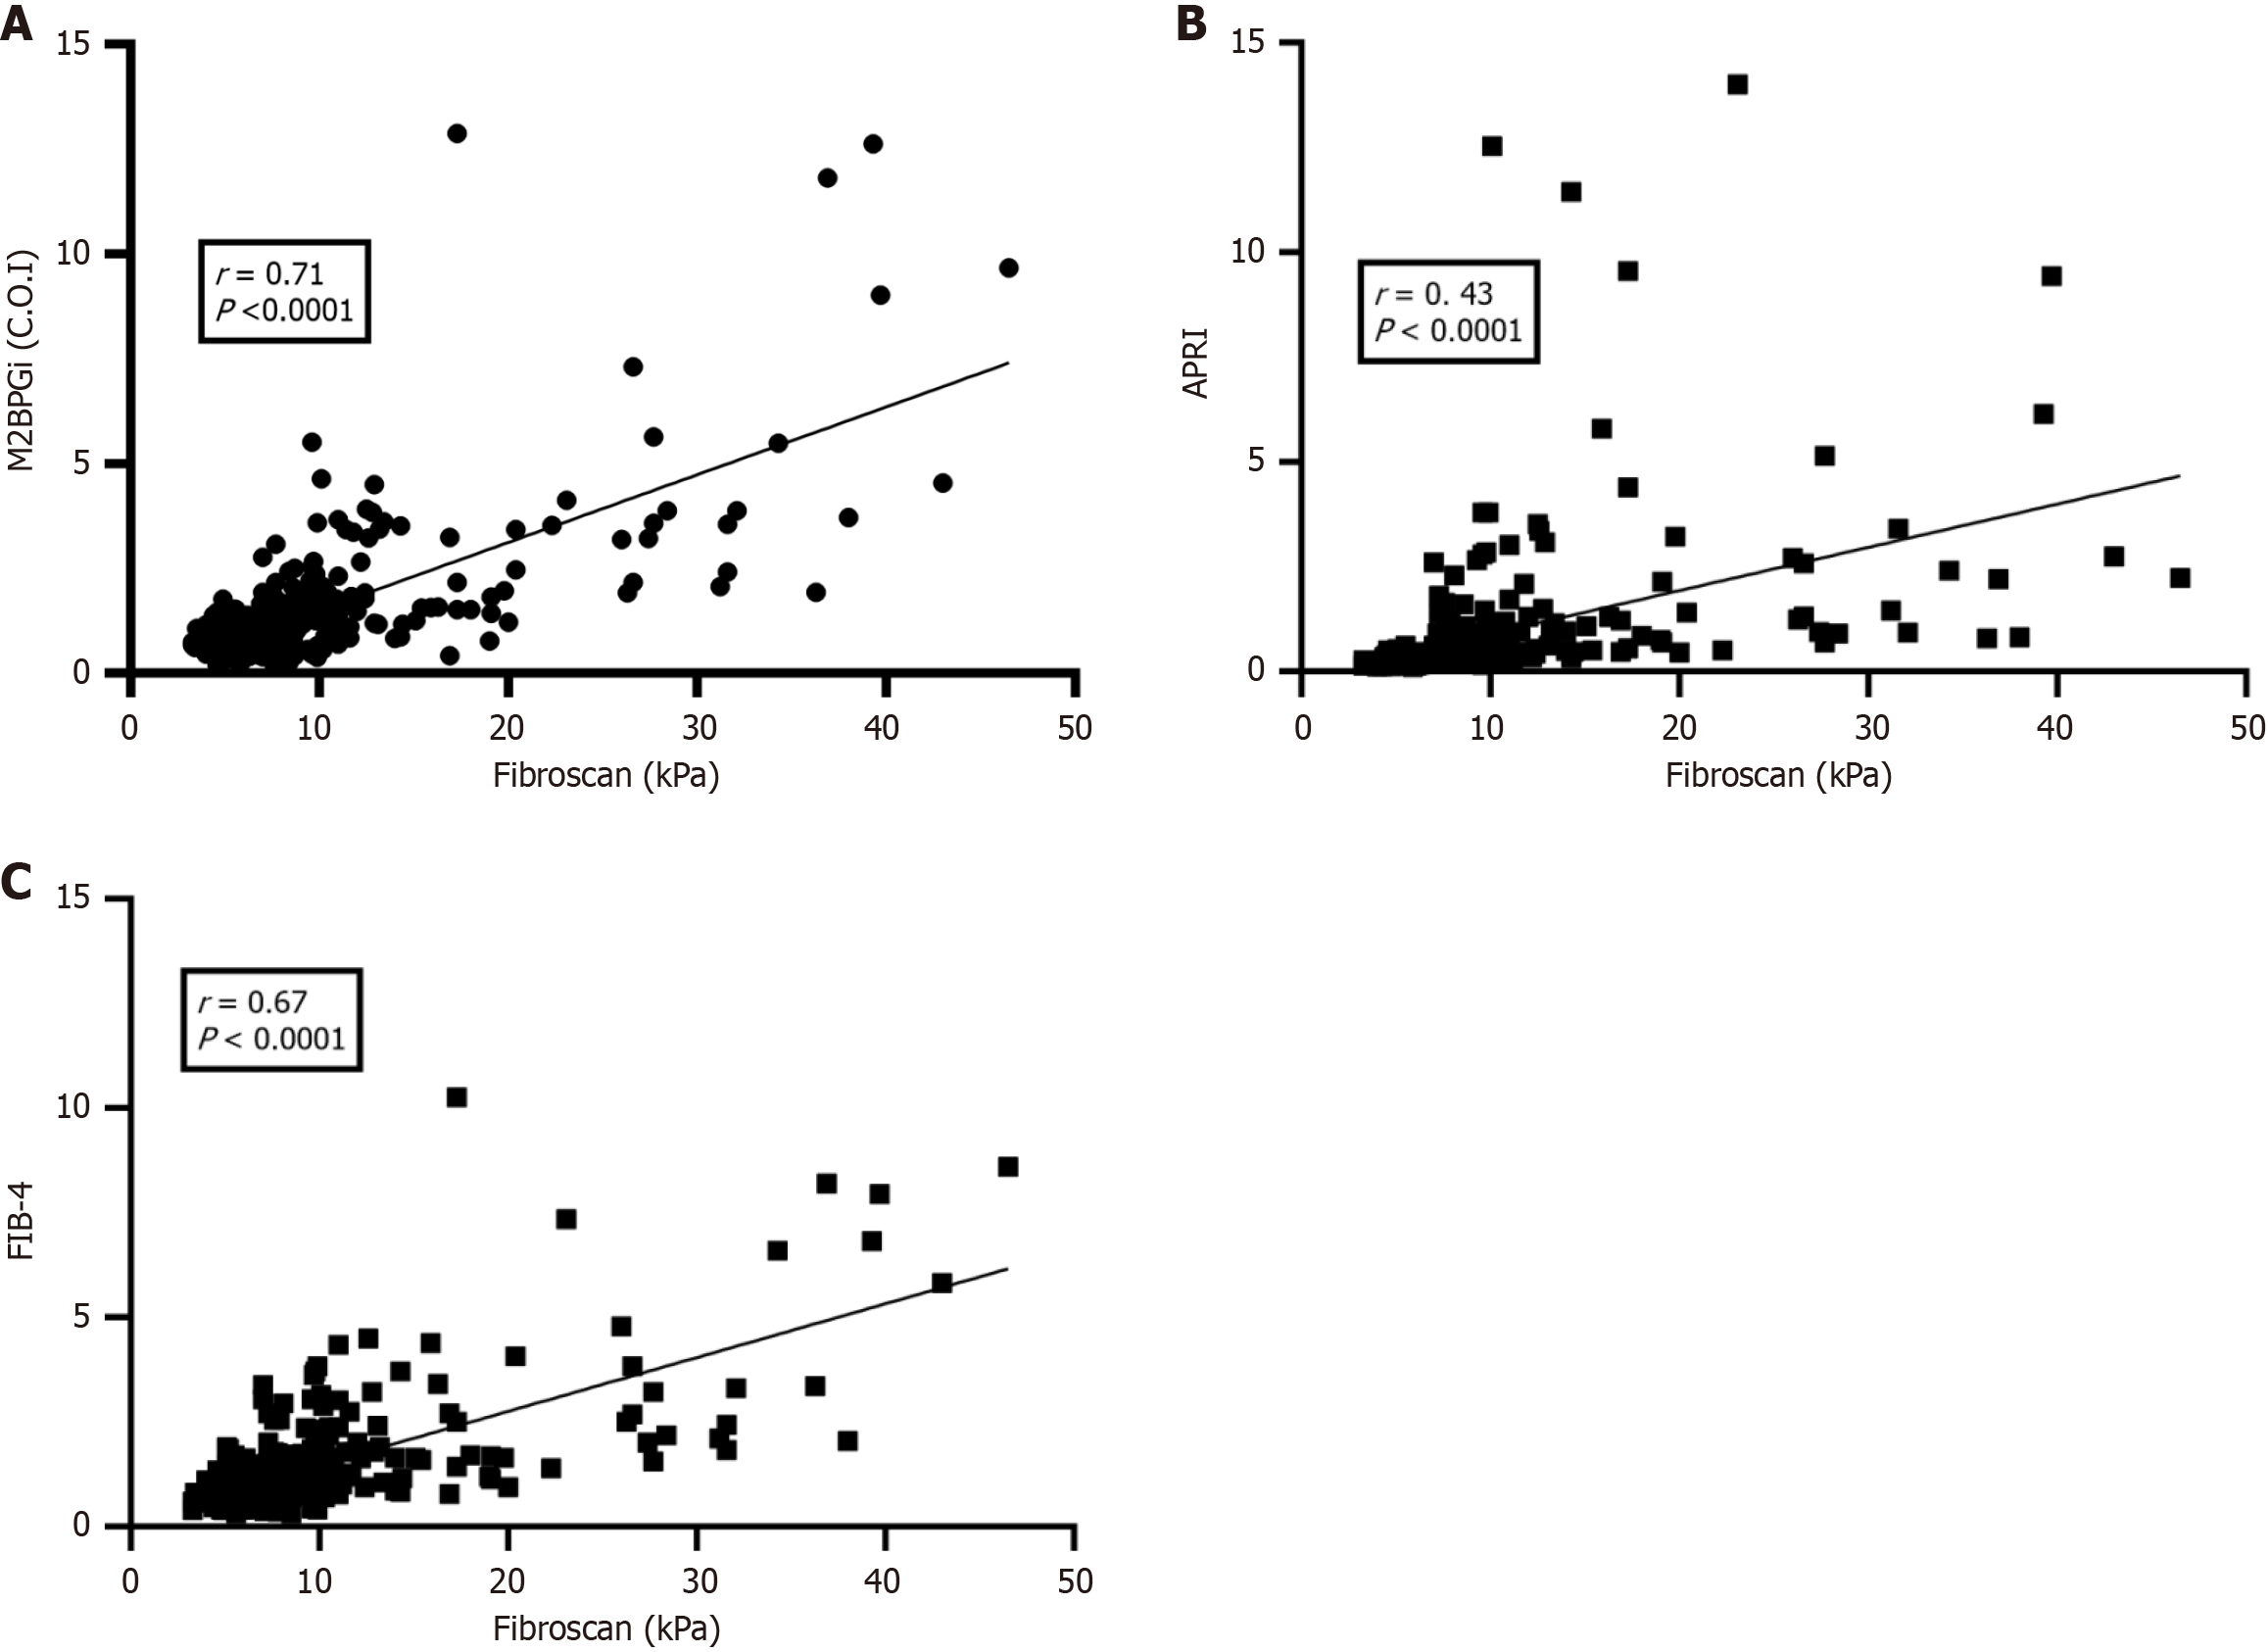
Figure 3 Median of Mac-2 binding protein glycan isomer levels between different fibrosis stages.
aKruskal-Wallis test, P < 0.05; C.O.I: Cut-off Index.
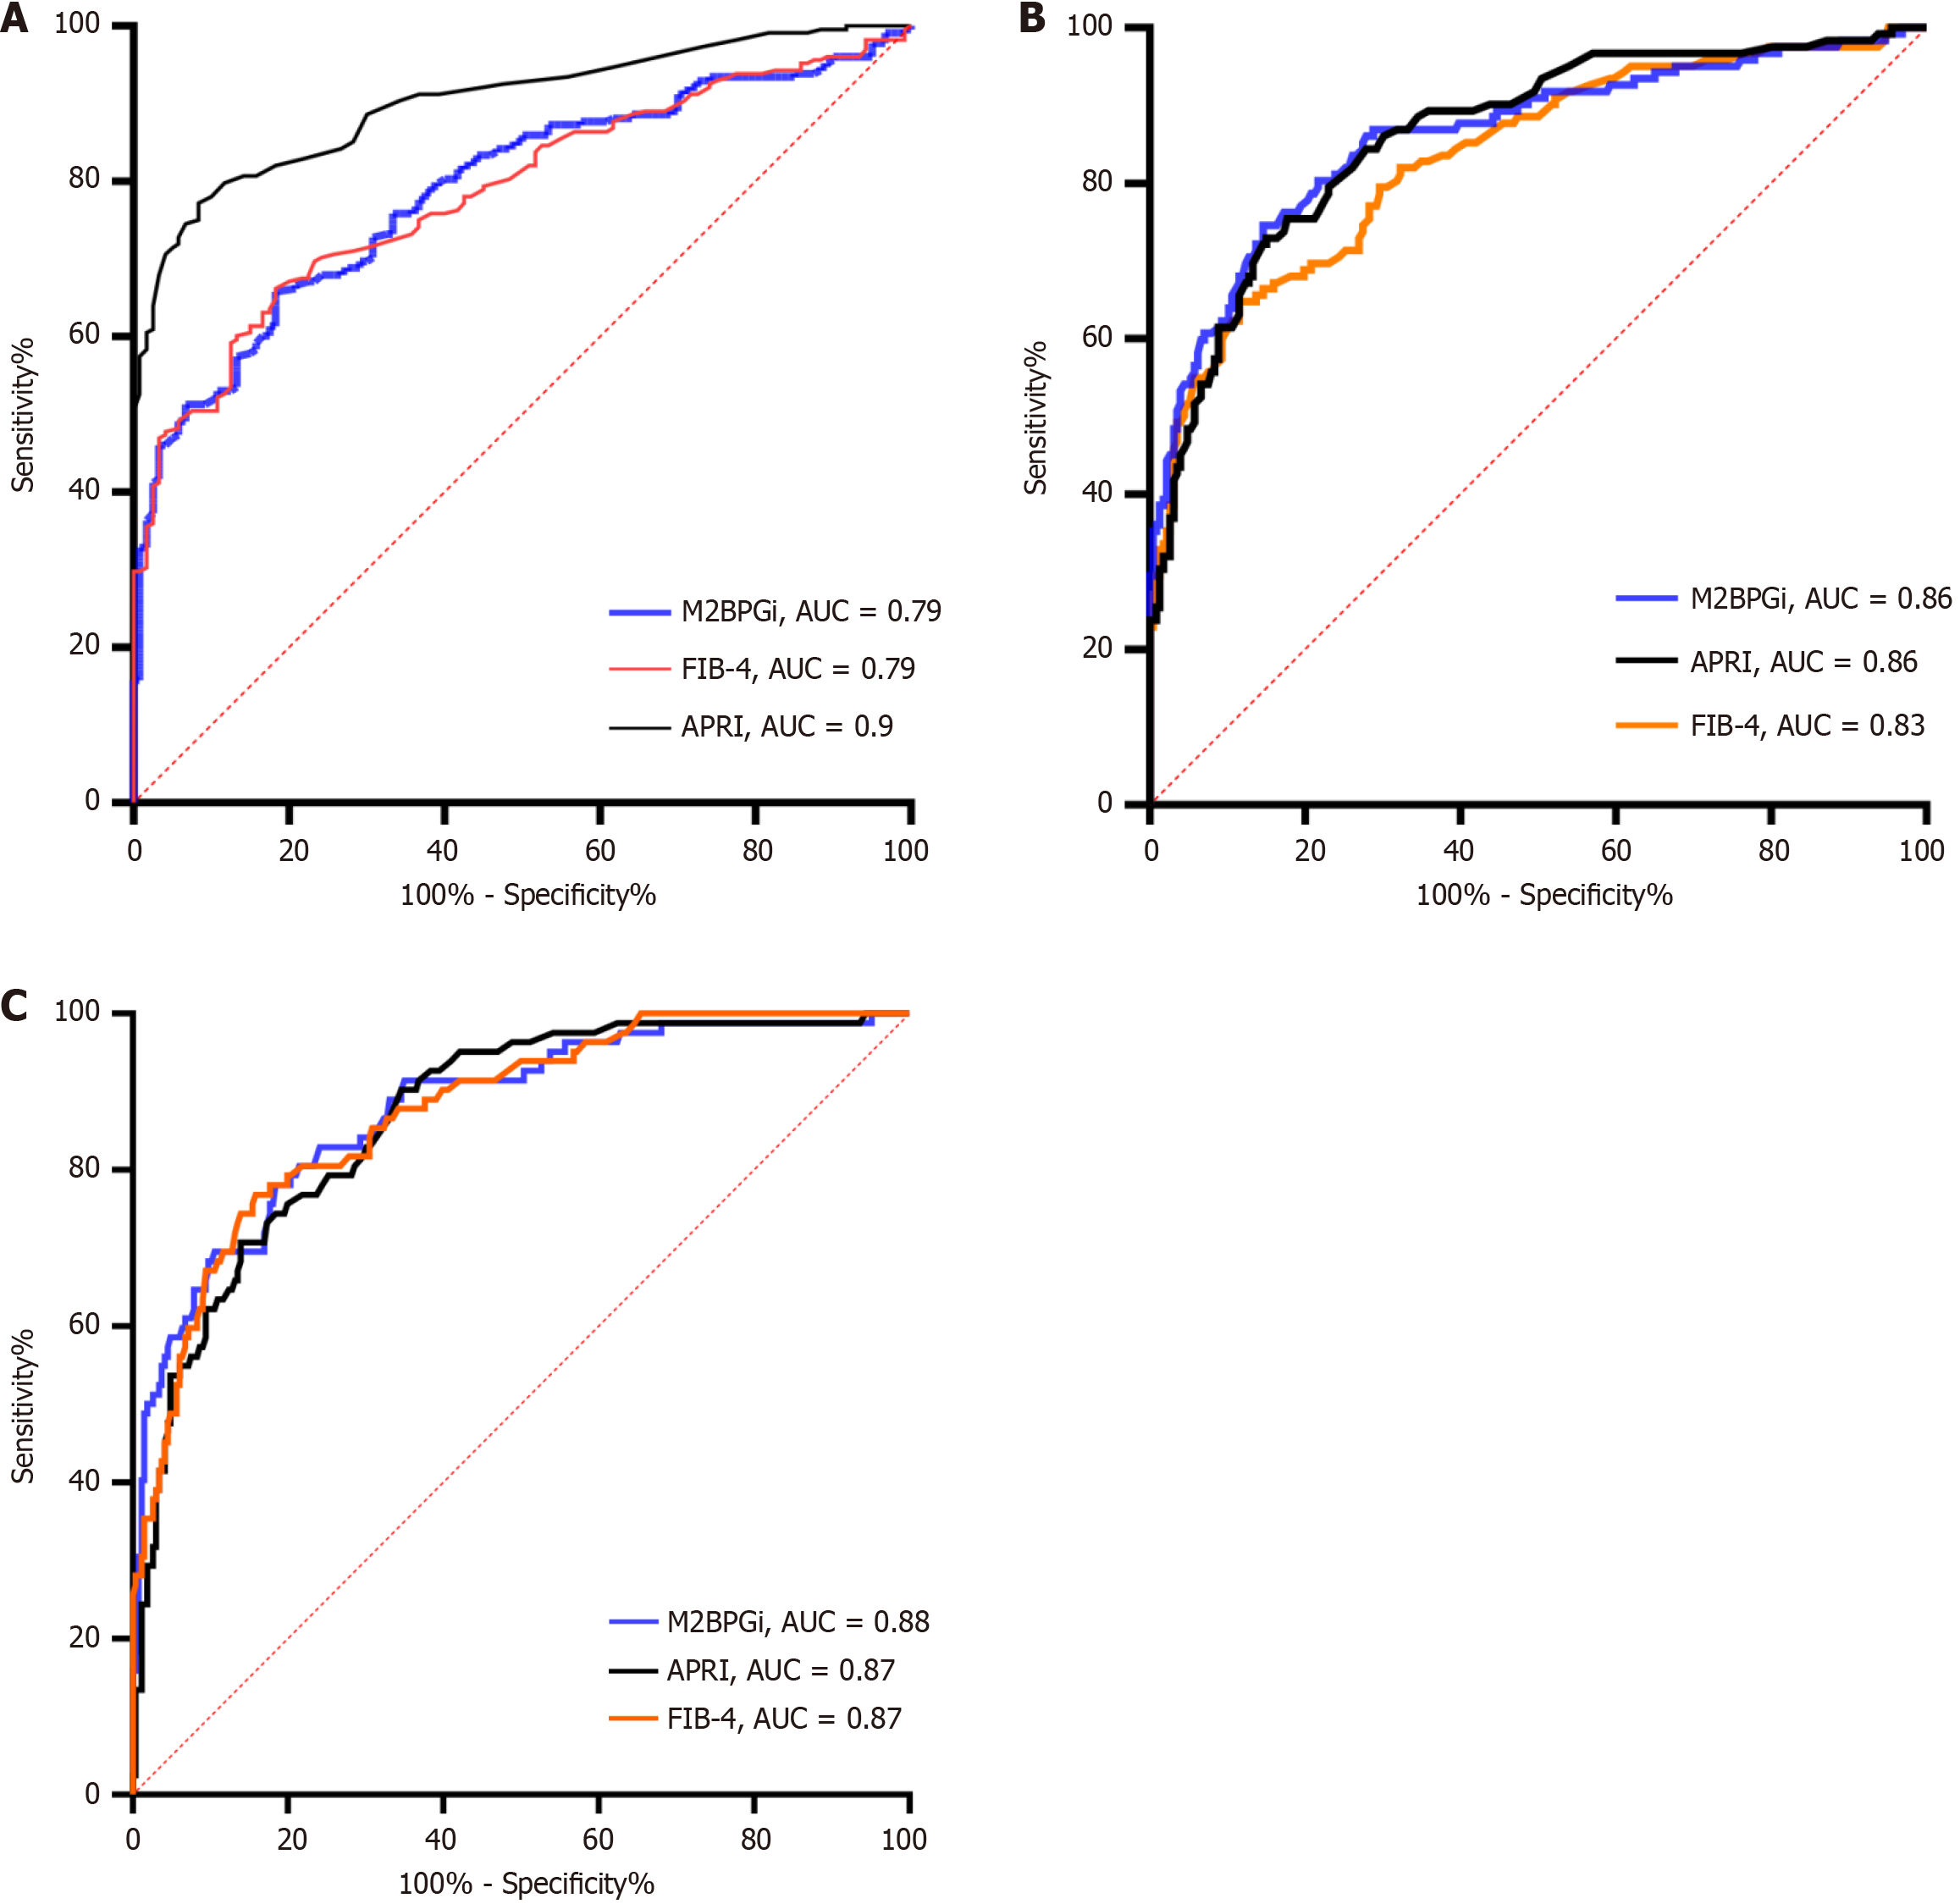
Figure 4 Area under the receiver operating characteristic curves depicting diagnostic performance of noninvasive marker.
A: Area under the receiver operating characteristic curve (AUROC) of significant fibrosis; B: AUROC of advanced fibrosis; C: AUROC of cirrhosis. M2BPGi: Mac-2 binding protein glycosylated isomer; APRI: Aspartate transaminase to platelet ratio index; FIB-4: Fibrosis-4 index; AUC: Area under the curve.
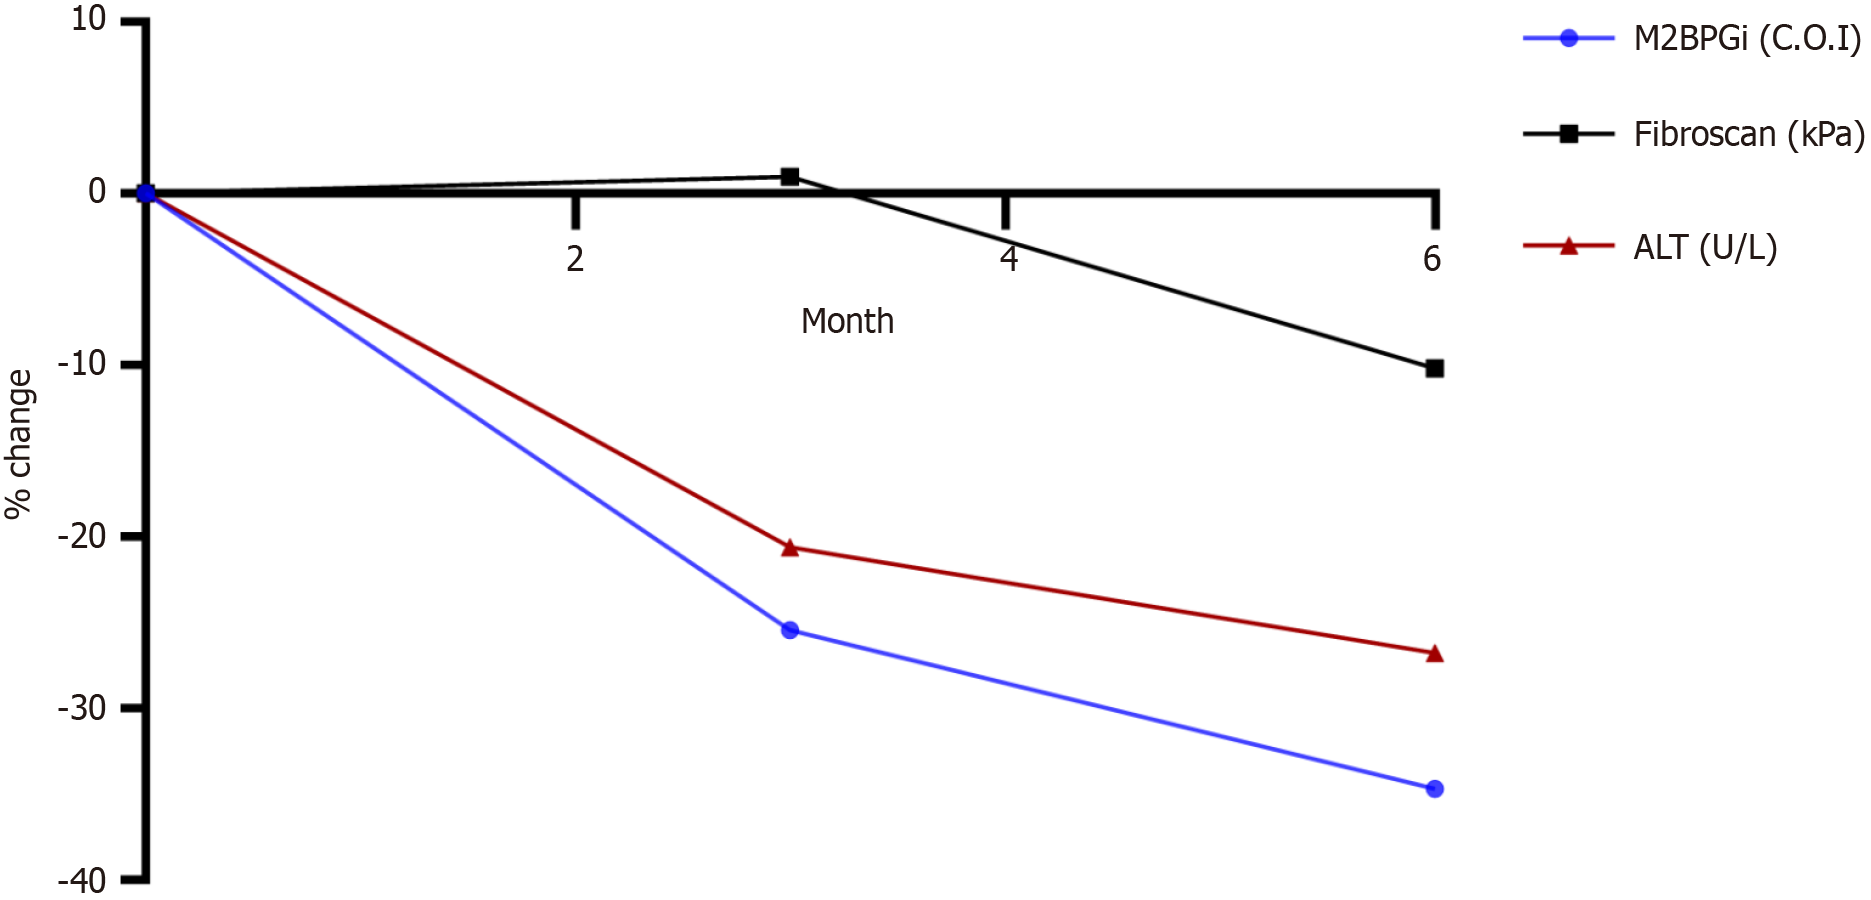
Figure 5 Relative changes of Mac-2 binding protein glycosylated isomer, Fibroscan, and Alanin Aminotransferase over first 6 months of antiviral treatment.
M2BPGi: Mac-2 binding protein glycosylation isomer; ALT: Alanine transaminase; C.O.I: Cut-off index; kPa: Kilopascal.
- Citation: Pham TTT, Ho DT, Phan HT, Nguyen TB, Nguyen KM. Assessing the role of Mac-2 binding protein glycosylation isomer in the management of patients with chronic hepatitis B. World J Hepatol 2025; 17(5): 106916
- URL: https://www.wjgnet.com/1948-5182/full/v17/i5/106916.htm
- DOI: https://dx.doi.org/10.4254/wjh.v17.i5.106916


