Copyright
©The Author(s) 2024.
World J Hepatol. Dec 27, 2024; 16(12): 1458-1467
Published online Dec 27, 2024. doi: 10.4254/wjh.v16.i12.1458
Published online Dec 27, 2024. doi: 10.4254/wjh.v16.i12.1458
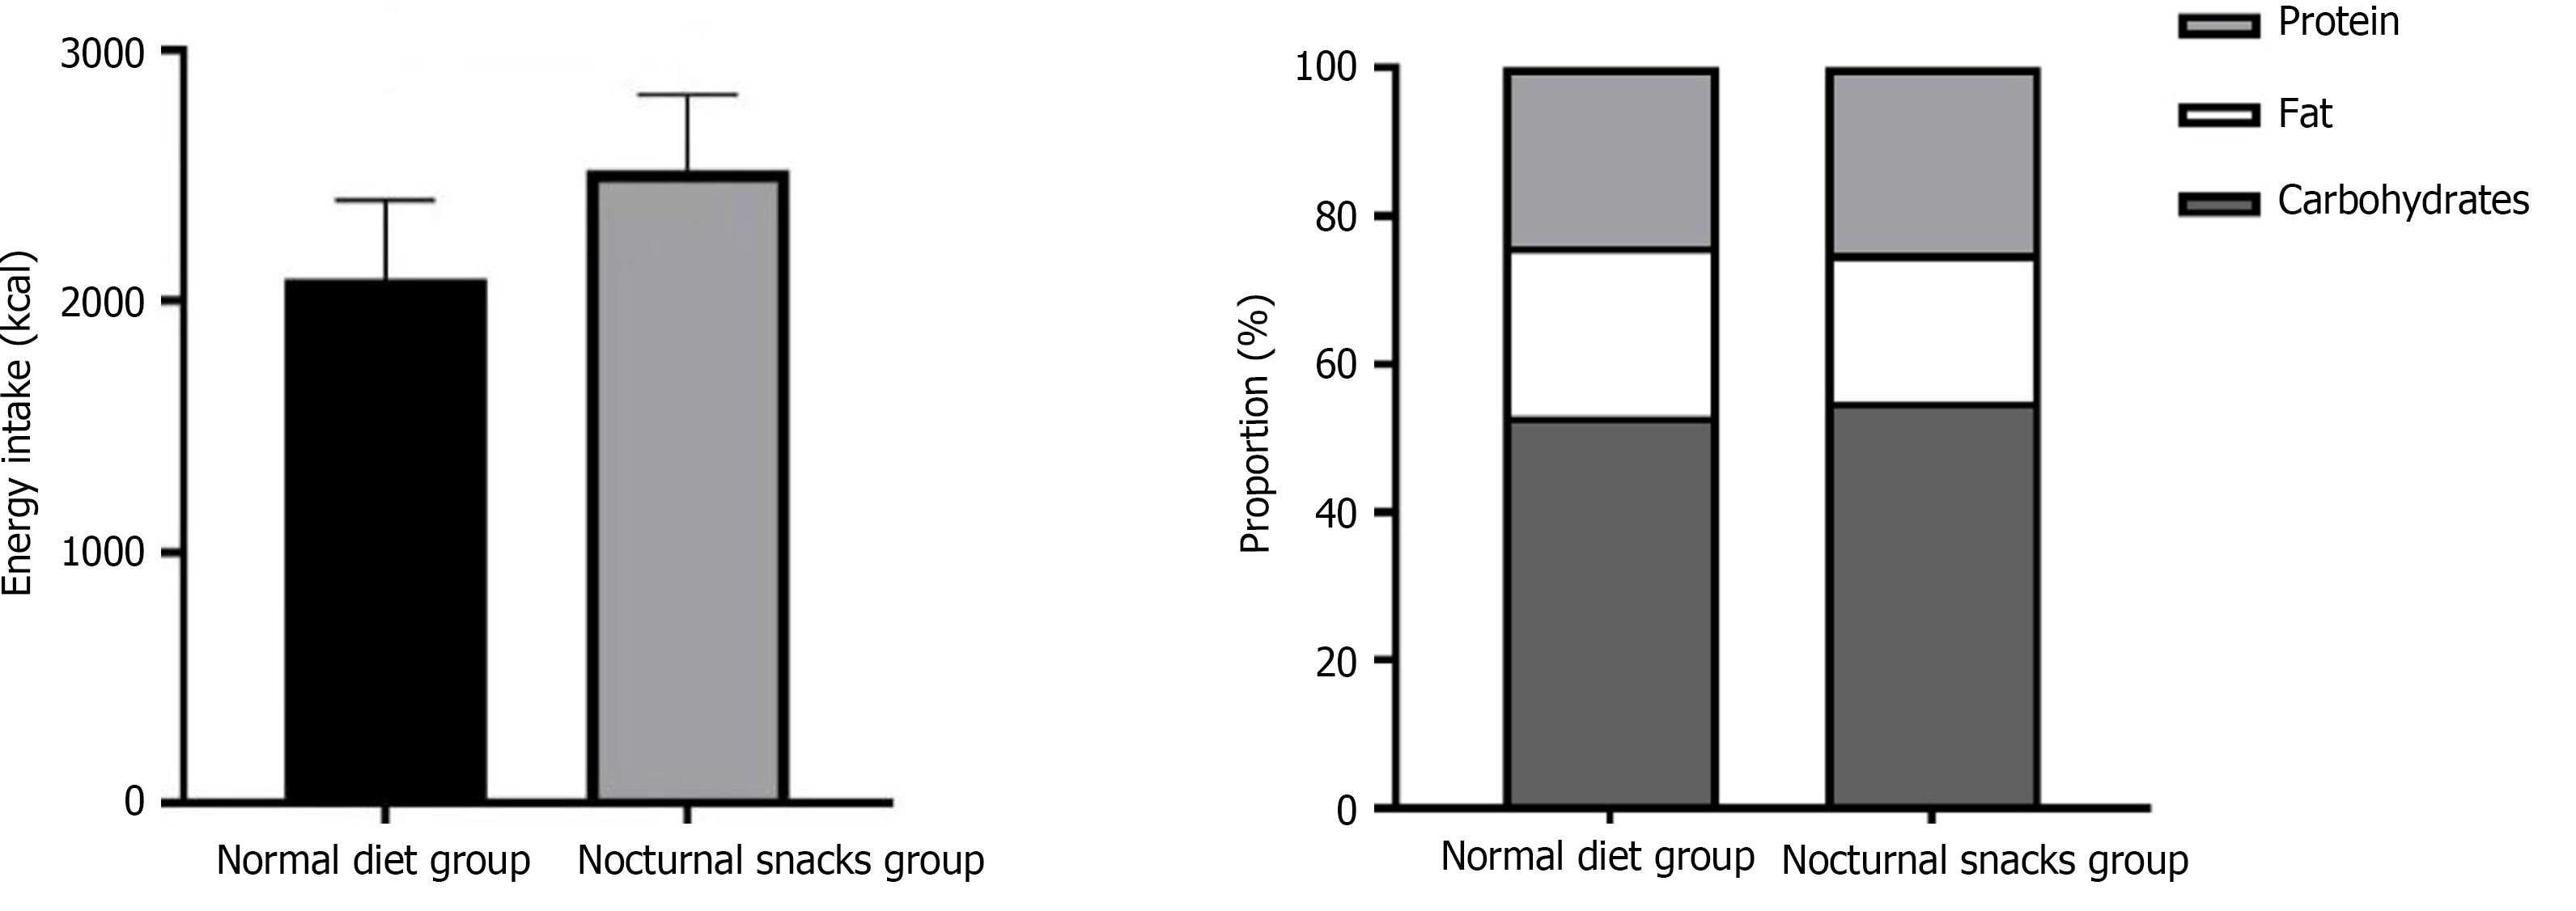
Figure 1 Comparison of dietary energy intake and macronutrient intake between the two groups.
A: Energy intake; B: Macronutrient intake (protein, fat, carbohydrates).
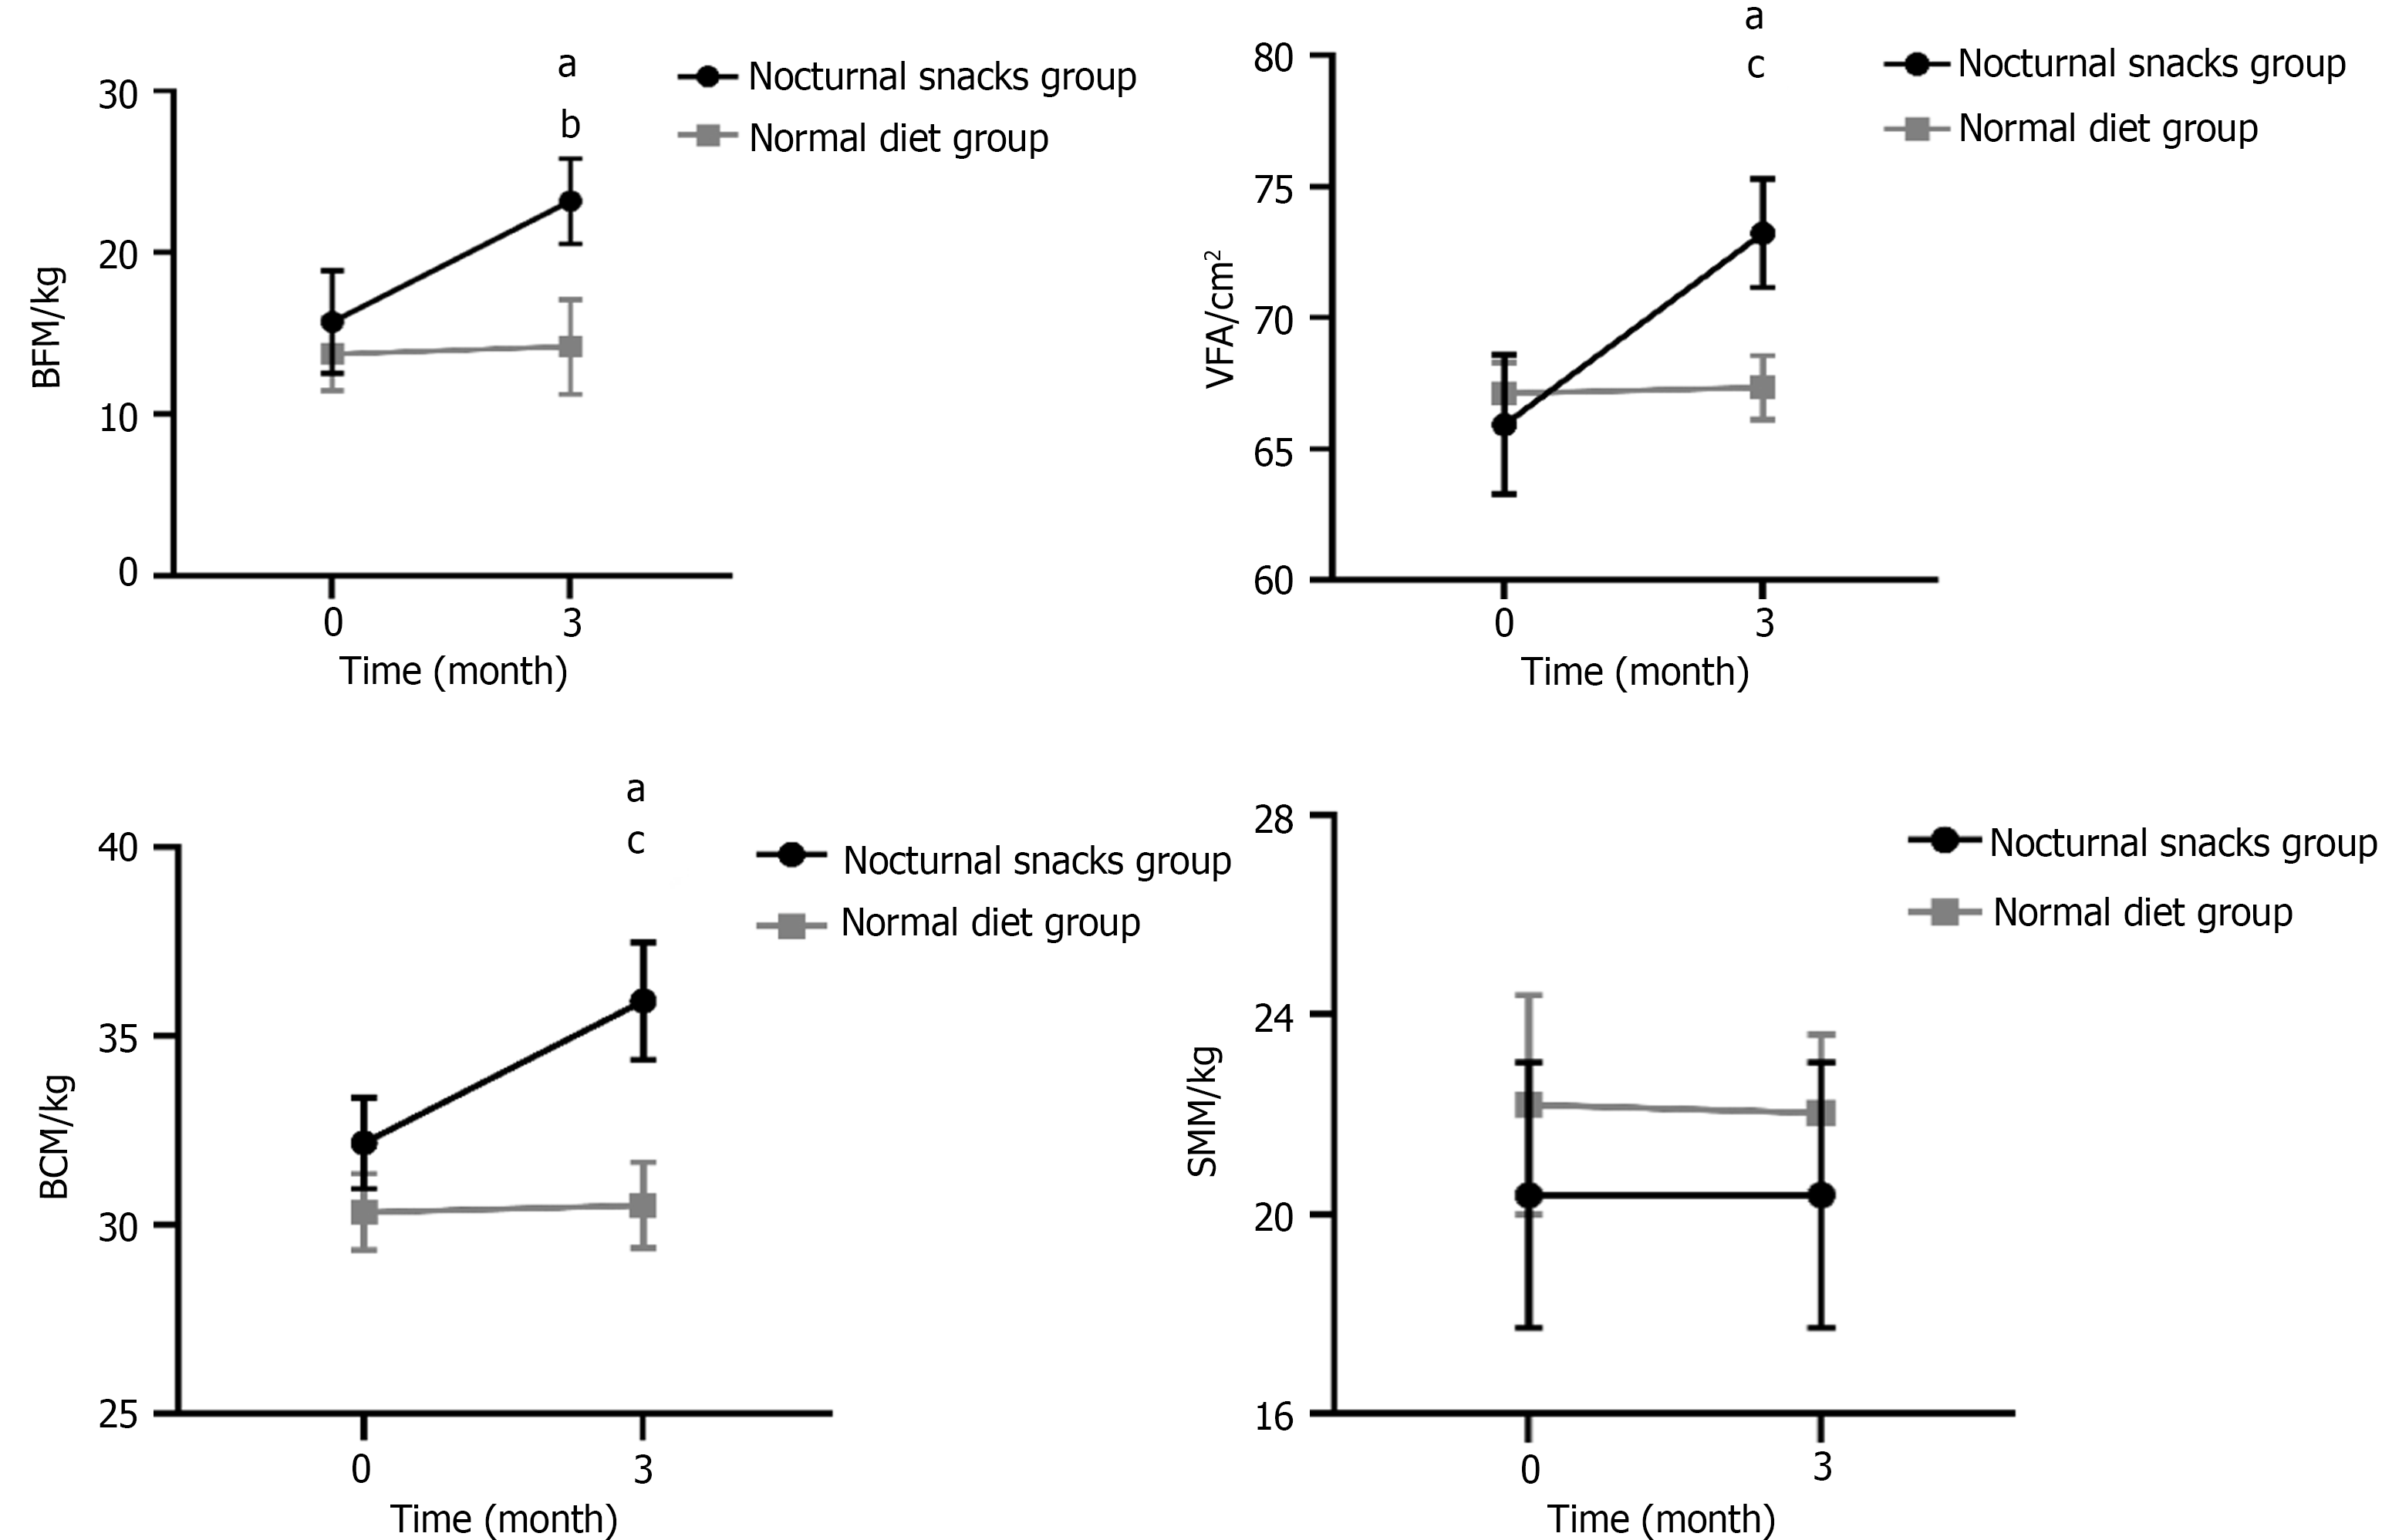
Figure 2 Comparison of body composition between the nocturnal snacks and normal diet groups.
aP < 0.05. bP < 0.01 vs normal diet group. cP < 0.05 vs normal diet group. BFM: Body fat mass; VFA: Visceral fat area; BCM: Body cell mass; SMM: Skeletal muscle mass.
- Citation: Yu YB, Fu XJ, Xu GF, Niu LY, Duan RN, Yao J, Zhao NH. Effects of nocturnal snacks on body composition in patients with liver cirrhosis. World J Hepatol 2024; 16(12): 1458-1467
- URL: https://www.wjgnet.com/1948-5182/full/v16/i12/1458.htm
- DOI: https://dx.doi.org/10.4254/wjh.v16.i12.1458


